Scottish Housing Market Review: Q4 2022
Quarterly bulletin collating a range of statistics on the Scottish housing market, such as house prices and transactions, rental trends, cost and availability of finance, etc.
Part of
1. Sales
National
Source: Registers of Scotland
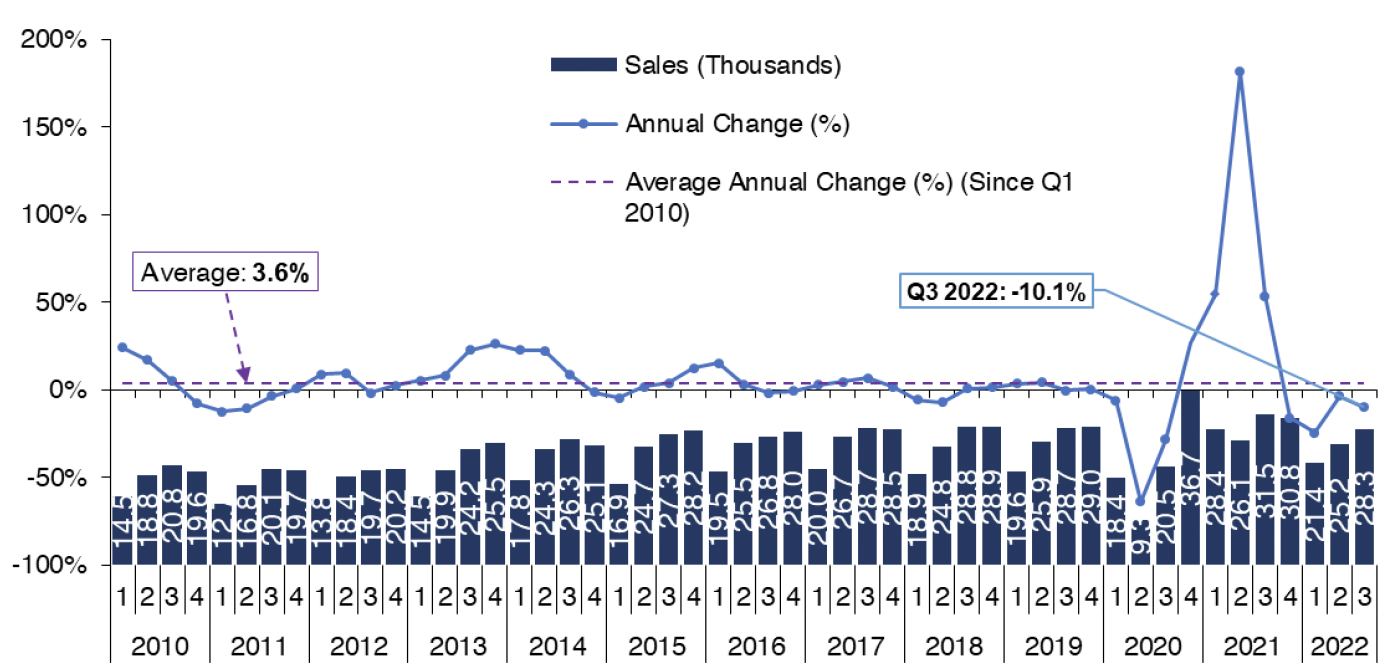
Scottish Sales Performance: National
Following the surge in transactions after home move restrictions were lifted in late June 2020, which was fuelled by pent-up demand as well as the temporary reduction in LBTT (which ended on 31 March 2021), followed by a fall as these impacts came to an end, data for Q3 2022 suggests housing market activity is stabilising at pre-pandemic levels, with Registers of Scotland statistics showing that there were 28,271 residential property sales registered across Scotland. Whilst relative to Q3 2021 this was an decrease of 10.1%, relative to the pre-pandemic average for Q3 (2016 - 2019), transactions increased by 0.1%.
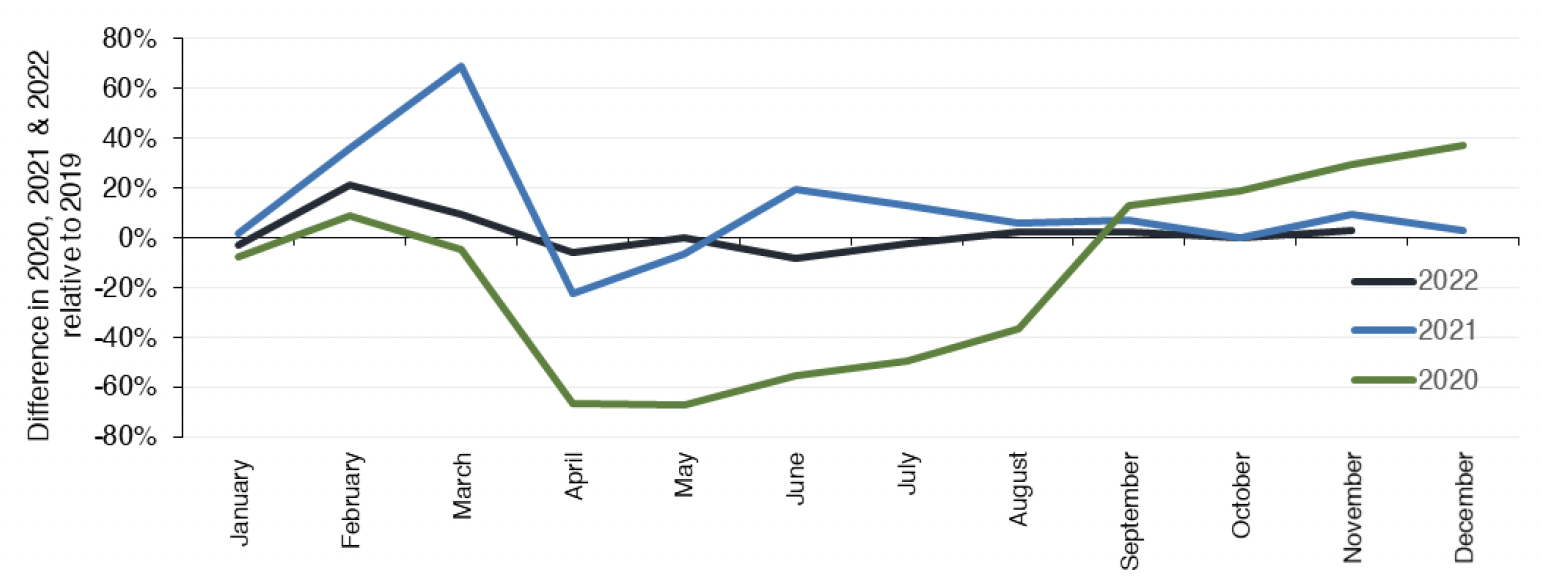
More timely statistics from Revenue Scotland on the number of residential LBTT returns submitted reinforces that housing market activity is stabilising at pre-pandemic levels. Chart 1.2 plots the percentage difference between monthly residential LBTT returns in 2020, 2021 and 2022 relative to 2019 for the corresponding month, with 2019 reflecting pre-Covid market conditions. Analysing the first eleven months of 2022 relative to the same period in 2019, it can be seen that transactions were 1.0% higher in 2022.
Source: Revenue Scotland
Scottish Sales Performance: Regional
Registers of Scotland data shows that housing market activity in Q3 2022 decreased relative to Q3 2021 across Scotland. The largest annual fall in residential property sales, of 17.7%, took place in Argyll & Bute and Highlands & Islands, whilst the smallest decrease, of 3.2%, took place in the Forth Valley. However, the large reductions in residential property sales reflects the high level of transactions in Q3 2021 across Scotland.
Analysing the annual change using a rolling four quarters method, it can be seen that the decrease in transactions at the national level for the one year period to Q3 2022 relative to the year prior has also been experienced across Scotland. The largest fall in residential property sales over this time period (17.2%) also took place in Argyll & Bute and Highlands & Islands, whilst the smallest decrease took place in Aberdeen/shire and Moray, where sales decreased by an annual 5.6%.
A summary of residential property sales activity by Scottish region is outlined in Table 1.1 below. This contains the number of residential property sales registered in Q3 2022, the annual change, as well as the annual change in sales using a rolling four quarter period to Q3 2022. The latter is included to smooth out volatility in quarterly data.
Table 1.1 Regional residential transactions
Aberdeen/shire and Moray
Sales – Q3 2022 3,130
12 Month Change -11.8%
Annual change (rolling 4 quarters) -5.6%
Edinburgh, Lothians and Borders
Sales – Q3 2022 5,813
12 Month Change -8.0%
Annual change (rolling
4 quarters) -13.2%
Argyll & Bute and Highland & Islands
Sales – Q3 2022 1,899
12 Month Change -17.7%
Annual change (rolling
4 quarters) -17.2%
Forth Valley
Sales – Q3 2022 1,491
12 Month Change -3.2%
Annual change (rolling 4
quarters) -12.4%
Ayrshires and Dumfries & Galloway
Sales – Q3 2022 2,608
12 Month Change -7.8%
Annual change (rolling
4 quarters) -14.8%
Tayside & Fife
Sales – Q3 2022 4,158
12 Month Change -11.8%
Annual change (rolling
4 quarters) -16.4%
Clyde Valley
Sales – Q3 2022 9,172
12 Month Change -10.2%
Annual change (rolling
4 quarters) -14.9%
Scotland
Sales – Q3 2022 28,271
12 Month Change -10.1%
Annual change (rolling
4 quarters) -13.9%
Source: Registers of Scotland
Contact
Email: bruce.teubes@gov.scot