Scottish Housing Market Review: Q4 2022
Quarterly bulletin collating a range of statistics on the Scottish housing market, such as house prices and transactions, rental trends, cost and availability of finance, etc.
Part of
5. Mortgage Approvals & LTVs
New Mortgage Advances
Chart 5.1 plots the monthly number of new mortgages advanced to first-time buyers and home movers in Scotland. There were 8,290 new mortgages advanced to first-time buyers in Scotland in Q3 2022, an annual decrease of 15.9% (-1,570). Meanwhile, there were 8,790 new mortgages advanced to home movers in Scotland in Q3 2022, an annual decrease of 8.1% (-770). These large annual decreases are explained by the high number of new mortgages advanced in Q3 2021, as well as interest rate increases since the end of 2021, although the impact from the mortgage market volatility after the UKG Plan for Growth/mini-Budget on 23 September 2022 will likely only be captured in Q4 2022 data, due to the lags between mortgage approval and advance (see further below). Comparing the 12-month period to Q3 2022 against the 12 months prior, new mortgage advances to first-time buyers decreased by 18.4% whilst for home movers they decreased by 17.4%, again reflecting the high levels of housing market activity after the release of Covid-19 pandemic restrictions. (Source: UK Finance).
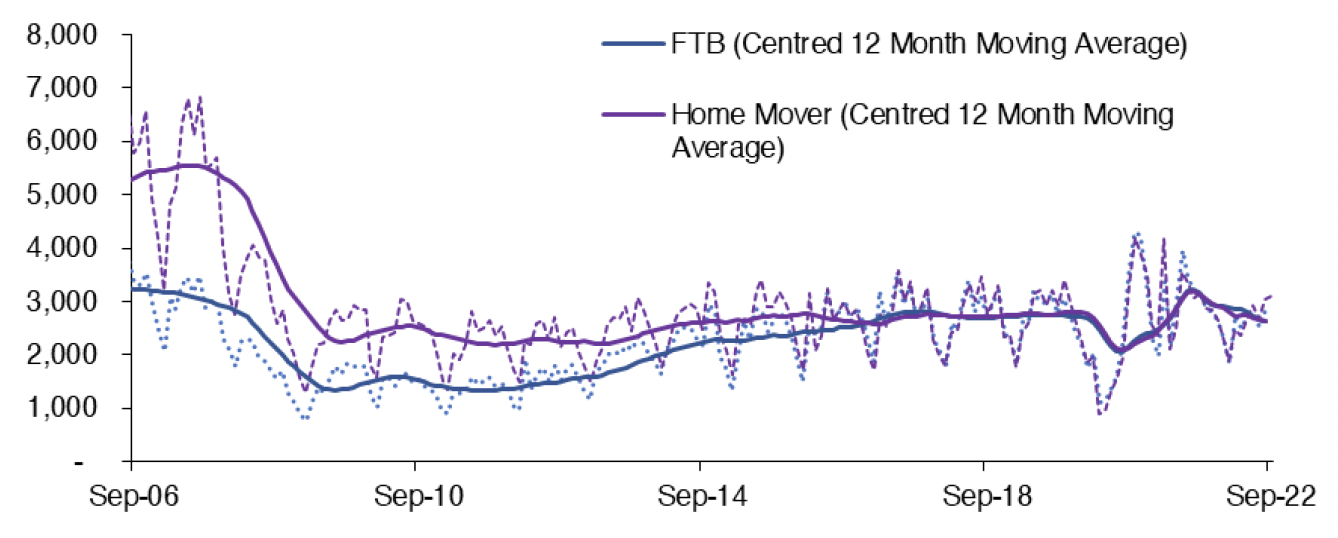
Source: UK Finance
Mortgage Approvals
Chart 5.2 plots the monthly number of mortgage approvals across the UK for house purchase (Source: BoE). Mortgage approvals for house purchase are the firm offers of lenders to advance credit fully secured on dwellings by a first charge mortgage. This data is a leading indicator of mortgage sales as it reflects activity early in the buying process.
Mortgage approvals for house purchase across the UK rebounded strongly following the lockdown in the second half of 2020, with mortgage approvals increasing from 9,922 in May 2020 to 104,806 in October 2020 (see Chart 5.2). Mortgage approvals returned to more normal levels up until September 2022, with mortgage approvals for house purchase 3.0% higher in the first nine months of 2022 relative to the 2016-2019 average for the same months. However, the volatility in the mortgage market following the UKG Plan for Growth/mini-Budget on 23 September 2022 led to a 18.8% fall in mortgage approvals in October 2022 relative to the 2016 – 2019 average for the same month.
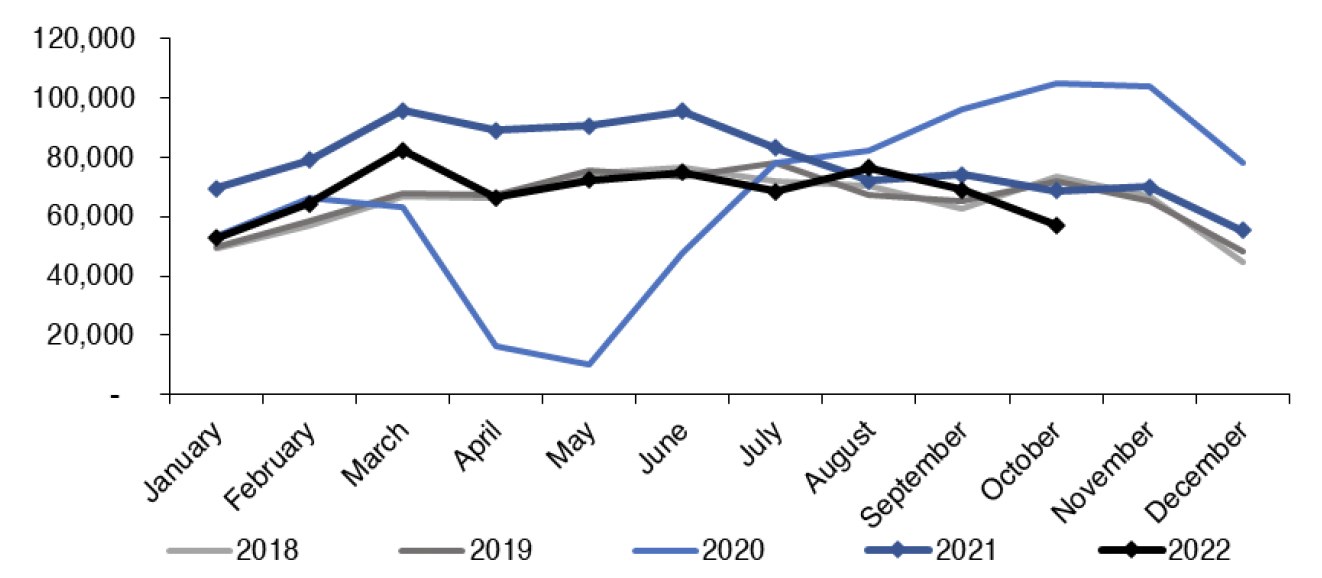
Source: Bank of England
Loan-to-Value (LTV) Ratios
In Q3 2022, the mean Loan-to-Value (LTV) ratio on new mortgages advanced to first-time buyers in Scotland stood at 83.1%, an annual increase of 1.3 percentage points. Meanwhile, the mean LTV ratio for home movers in Scotland stood at 71.7% in Q3 2022, up 0.5 percentage points over the one year period. This is shown in Chart 5.3. (Source: UK Finance).
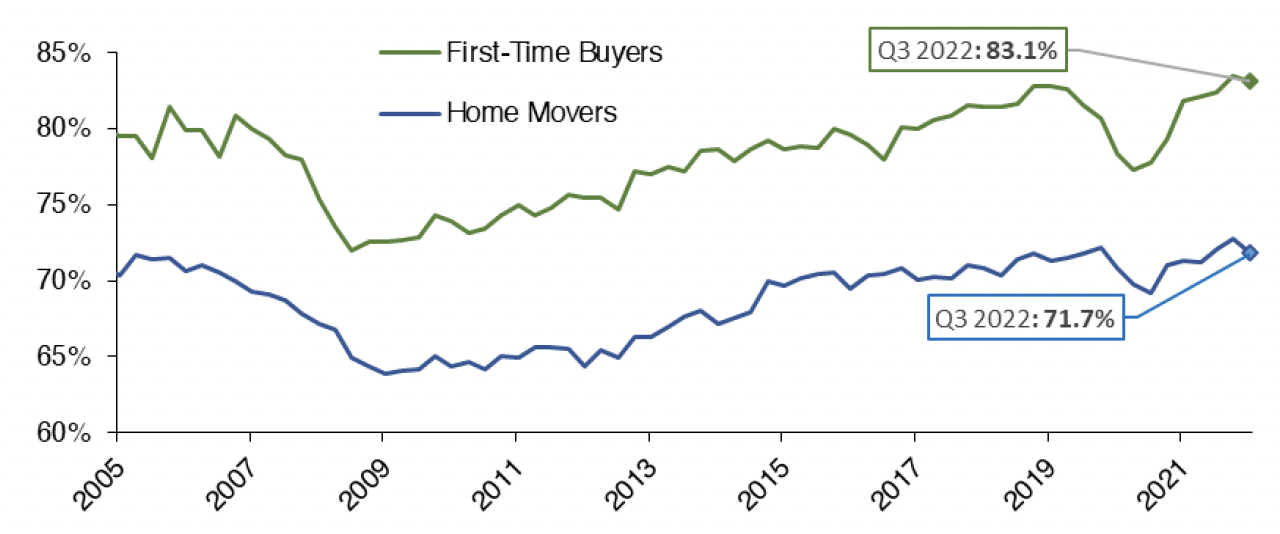
Source: UK Finance
Similarly, Chart 5.4 shows that while there was a reduction in new lending at high LTV mortgage ratios across the UK from March 2020, the market has been recovering. The share of gross mortgage advances across the UK in Q3 2022 with an LTV ratio greater than 90% was 5.0%, 0.9 percentage points above the share in Q3 2021 but 0.9 percentage points lower than the share in Q3 2019. There has also been an increase in lending which is both high LTV and high LTI (loan-to-income) over the quarter, with the share of gross advances classified as high LTV and LTI increasing to 4.1% in Q3 2022, up by 0.8 percentage points on Q3 2021 but 0.4 percentage points lower than the share in Q3 2019. It should be noted that this data will not yet have been affected by the mortgage market volatility in September 2022.
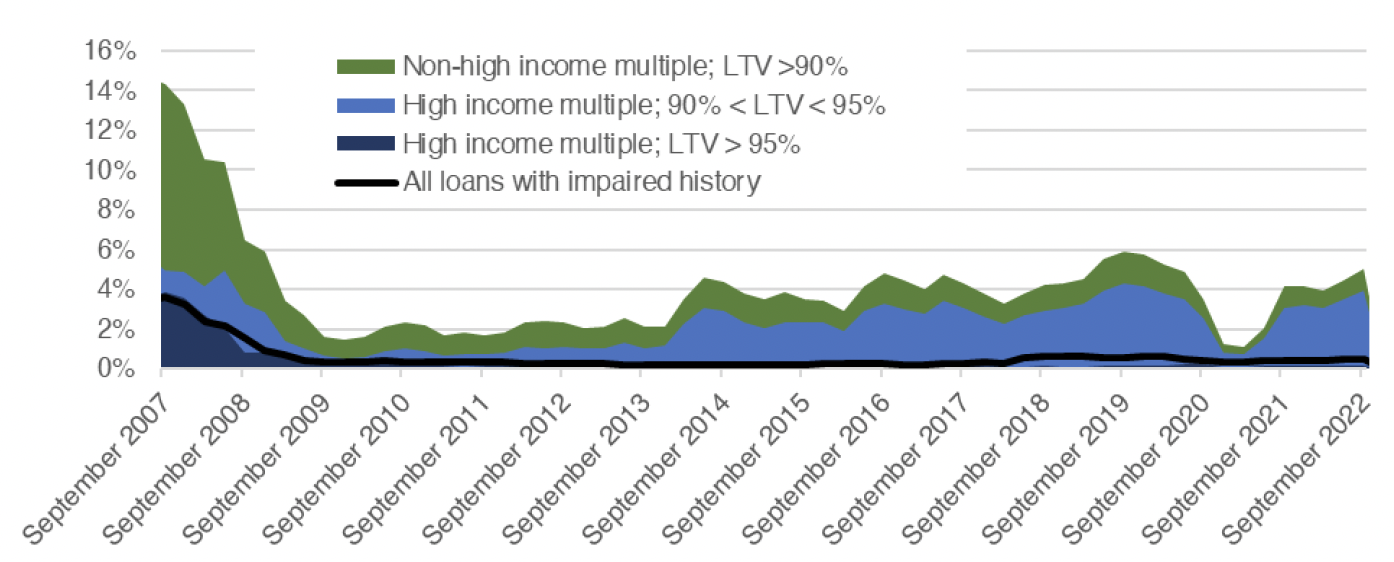
* Higher risk lending is classified by the FCA as an LTV over 90% and an income multiple greater than or equal to 3.5 for single income purchasers, or greater than or equal to 2.75 for joint income purchaser/s
Source: FCA
Falling a sharp fall due to the impact of the Covid-19 pandemic, there was a strong recovery in the number of high LTV products offered by mortgage lenders, with the number of 95% LTV mortgages products increasing from 8 in December 2020 to over 300 in the first 8 months of 2022. However, after the UKG Plan for Growth/mini-budget on 23 September 2022, the number of 95% LTV products dropped to 132 as at 1 October, before increasing slightly to 144 at 1 December. While the impact was starkest in the high LTV sector, the impact on the volatility in the mortgage markets was felt across different LTV levels, leading the total number of residential mortgage products to fall from 4,407 on 1 August 2022 to 2,258 on 1 October 2022, before recovering somewhat to 3,730 on 1 December 2022. (Source: Moneyfacts Mortgage Treasury Report).
Contact
Email: bruce.teubes@gov.scot