Scottish Household Survey 2022: Key Findings
Selected findings from the 2022 Scottish Household Survey, organised by topic area.

9. Culture and heritage
This chapter provides key data on cultural engagement, attendance and participation at a population level, alongside additional detail across various protected and socio-economic characteristics.
The response categories for culture and heritage were amended for the 2022 survey to better understand the nature and frequency of attendance and participation at cultural events, places and activities. Some categories were added, and some were reworded – see SHS questionnaires for details. The changes to the response options are small enough that it is reasonable to make comparisons between 2019 and 2022.
However, as noted in the introduction of the report, the data collection period was from 11 March 2022 to 6 March 2023 and participants were reflecting on their attendance and participation over the last 12 months from the point of being asked these questions (March 2021 to March 2022). COVID-19 has had a substantial impact on Scotland’s cultural life. Measures to reduce exposure to COVID-19 included limits on large gatherings, closure of venues, and cancellation of productions or programmes and large-scale cultural events. This has had a dramatic effect on how people attend and participate in culture since March 2020. Therefore, this should be taken into account when comparing 2022 and 2019 data.
Cultural engagement
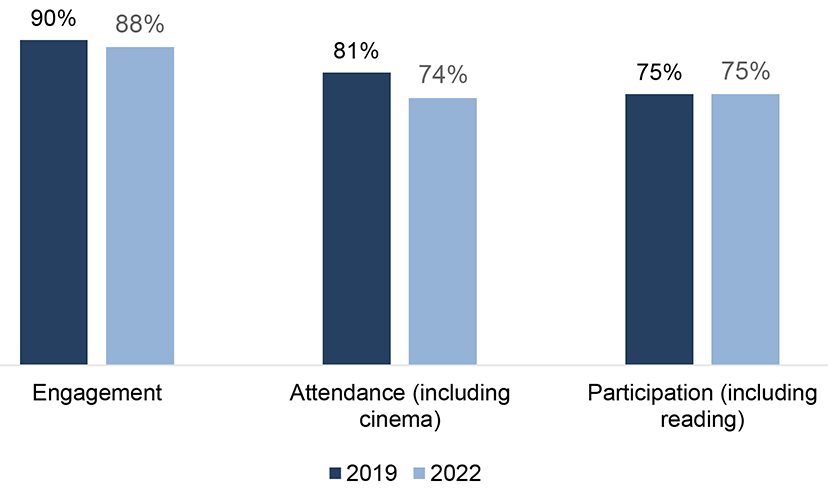
Cultural engagement is defined as those adults who have either attended at least one type of cultural place or who have participated in a cultural activity in the previous 12 months.
2022 data shows that 88% of adults had been culturally engaged in the last year, either by attending a cultural event or place of culture or participating in a cultural activity. This figure has decreased from 90% in 2019 (Chart 9.1 and Table 9.1).
Attendance at cultural events or places
Cultural attendance is captured in the SHS by asking respondents if they have attended specific events or places, from the available list asked of respondents in the survey, at least once in the last 12 months. As in previous reports, results for cultural attendance have been presented both including and excluding visits to the cinema, to help illustrate different elements of cultural attendance.
In 2022, 74% of adults had attended a cultural event or place of culture (a decrease from 81% in 2019). When excluding cinema, the most common cultural event to attend, 65% of adults had attended a cultural event or place of culture in the last year. This has decreased from 74% in 2019 ( Chart 9.1 and Table 9.2).
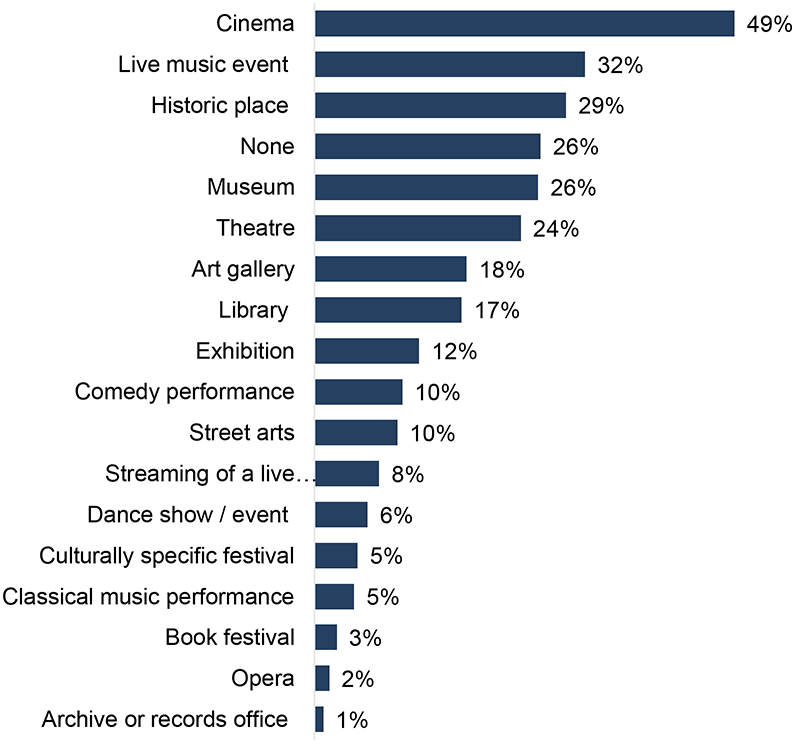
In 2022, the cinema (49% of adults) or a live music event (32% of adults) were the most common cultural events or places of culture to attend. Attendance at all events and places was lower in 2022 than 2019 apart from streaming of a live performance which has maintained (8%) (Table 9.2 and Chart 9.2).
Attendance at cultural events or places by demographic group
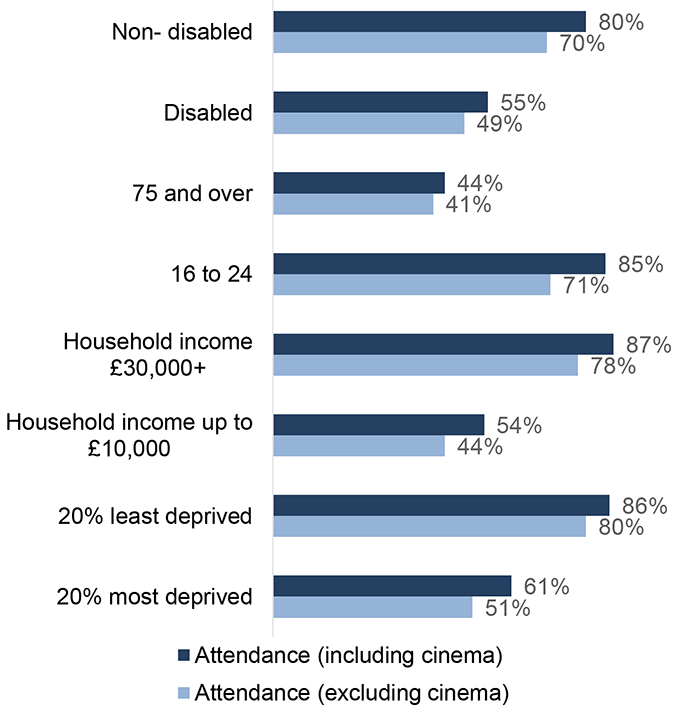
In 2022, rates of cultural attendance were highest among those living in the ‘least deprived’ areas as measured by the Scottish Index of Multiple Deprivation (SIMD). 86% of adults living in the 20% least deprived areas had attended a cultural event or place of culture, including the cinema, compared to 61% of adults living in the 20% most deprived areas. When cinema is excluded this difference was greater (80% and 51% respectively). Adults living in the 20% least deprived areas were more likely to have attended all cultural events or places in the last year, than those living in the 20% most deprived areas apart for trips to the archive or records office where attendance was similar (1%). (Table 9.6 and Chart 9.3).
In 2022, cultural attendance (including cinema) was higher among households with greater net annual household income. Considering specific groups, 87% of those with a net annual household income of over £30,000 had attended or visited a cultural event or place in the last 12 months, compared to 54% of respondents with a net annual household income of between £0 and £10,000. When cinema is excluded the difference was slightly smaller (78% and 44%). The biggest differences by income groups can be seen for visits to the cinema (61% and 34% respectively), live music events (41% and 20% respectively) and visits to historic places (38% and 17% respectively) (Table 9.7 and Chart 9.2).
Attendance at cultural events or places of culture also varied by age. In 2022, 85% of adults aged 16 to 24 had attended a cultural event or place of culture, including the cinema, compared to 44% of adults aged 75 or over. When cinema is removed the difference is smaller (71% and 41% respectively). While the variation in age has been maintained from 2019, for both age groups, attendance was lower in 2022 (Table 9.4 and Chart 9.2).
Only 56% of disabled adults had attended a cultural event or place of culture, including the cinema, compared to 80% of non-disabled adults. When cinema is excluded, the difference was smaller (49% for disabled adults and 70% for non-disabled adults) (Table 9.8 and Chart 9.2).
Frequency of attendance at cultural events or places
In 2022, the library (including mobile and online) was the most frequently visited cultural event or place, compared to the other cultural events or places of culture. 16% of adults visited a library at least once a week, and over one third of adults visited at least once a month (35%) (Table 9.15).
Aspirations of attendance at cultural events and places
Respondents were asked whether there were any cultural events or places that they would like to attend if they had not done so in the last 12 months, or attend more often if they had. Of those who had already attended cultural events or places in the last 12 months, around half (52%) selected one or more events or places that they would like to go to, as they had not been before, or they would like to go more often. (Table 9.16). Of those who had not attended any cultural events or places in the last 12 months, over a third (35%) selected one or more events or places that they would like to go to, as they had not been before. (Table 9.17).
Factors limiting or preventing attendance at cultural events and places[2]
In 2022, the most frequently cited factors limiting or preventing people from attending cultural events and places, were ‘lack of time’ (16%) followed by ‘cost of tickets’ (13%). Both these factors have decreased from 2019 with ‘other reason’ showing the biggest increase since 2019 (from 4% in 2019 to 7% in 2022). (Table 9.18).
Participation in cultural activities
Cultural participation is captured in the SHS by asking respondents if they have done at least one activity from an available list in the last 12 months. As in previous reports, results for cultural participation have been presented both including and excluding reading, to help illustrate different elements of cultural participation.
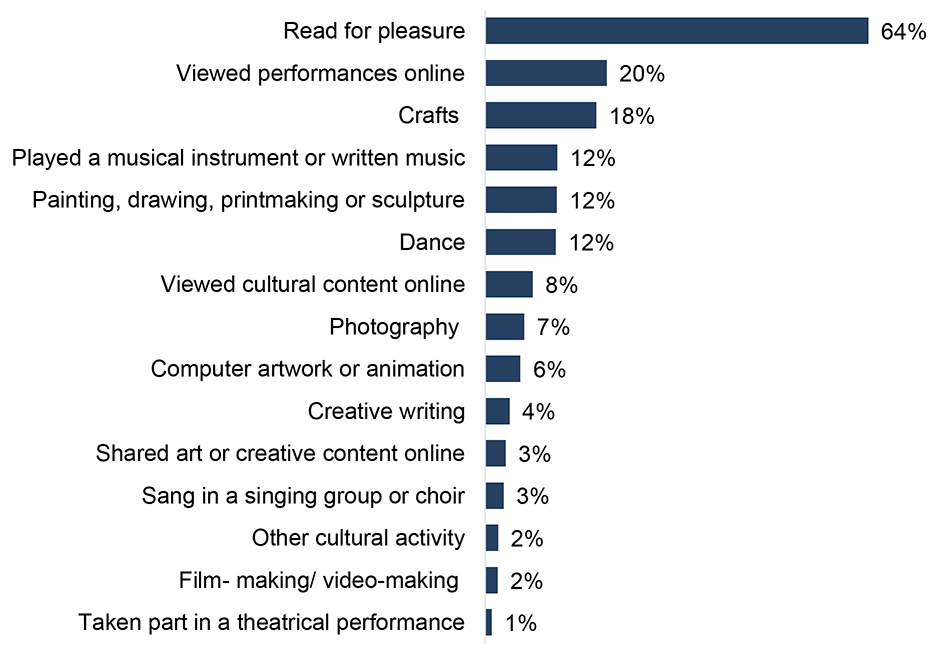
In 2022, 75% of adults had participated in a cultural activity, including reading, in the last year. When excluding reading, 51% of adults had participated in a cultural activity. These figures have maintained since 2019. See Chart 9.1 and Table 9.19. ndividual activities that have seen an increase in participation since 2019 include crafts (18%) and playing a musical instrument or writing music (12%) (Chart 9.4).
Participation in cultural activities by demographic group
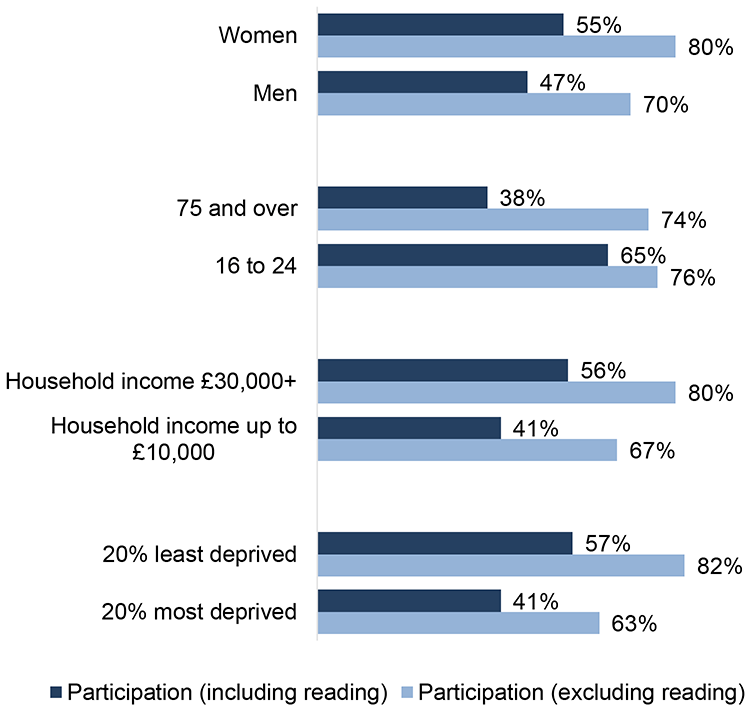
Regarding cultural activity 80% of women had participated in a cultural activity, including reading, in the last year, compared to 70% of men. Excluding reading, 55% of women had participated in a cultural activity compared to 47% of men. Women were more likely than men to participate in crafts, read, dance, paint or sing in a singing group or choir. Men were more likely than women to have played a musical instrument or written music, used a computer to produce artwork or animation and participated in film-making. (Table 9.20 and Chart 9.3).
Adults aged 16 to 24 (65%) were more likely to have participated in a cultural activity than adults aged 75 or over (38%), when excluding reading. Participation was similar when reading was included. Adults aged 75 or over were more likely to read books, poetry or graphic novels / comics for pleasure (68%) than adults aged 16 to 24 (54%). Adults aged 16 to 24 were more likely to participate in all other activities apart from crafts and singing in a singing group or choir, where participation was the same as those aged 75 years and older. (Table 9.21 and Chart 9.3).
Adults living in the 20% most deprived areas were less likely to have participated in a cultural activity (64% including reading and 41% excluding reading) than those living in the 20% least deprived areas (82% including reading and 57% excluding reading). In 2022, adults living in the 20% least deprived areas were more likely to have participated in a number of activities including reading books, poetry or graphic novels / comics for pleasure, viewing performances online, playing a musical instrument or written music and viewing cultural content online than adults living in the 20% most deprived areas. (Table 9.23 and Chart 9.3).
In 2022, cultural participation (including reading) was higher for households with a larger household income. 67% of adults with a net annual household income up to £10,000 participated in a cultural activity, when reading is included, compared to 80% of those with a net annual household income of over £30,000. When reading is excluded, participation was even lower for those with a net annual household income of up to £10,000. It was 41% compared to 56% for those with a net annual income of above £30,000. Adults with a net annual household income above £30,000 were more likely to have participated in a number of activities incuding viewing performances online, reading books, poetry or graphic novels or comics for pleasure and playing a musical instrument or written music than those with a net annual household income of up to £10,000 (Table 9.24 and Chart 9.3).
Frequency of participation in cultural activities
In 2022, the most common cultural activity to participate in was reading books, poetry or graphic novels or comics for pleasure, with 64% of adults having read in the last year. 78% of adults who read books did so at least once a week (this has increased from 75% in 2019) (Table 9.32).
Aspirations of participation in cultural activities
Respondents were asked whether there were any cultural activities that they would like to participate in because they had not done so in the last 12 months, or particiapte in more often. The majority of both those who had participated, as well as those who had not participated in cultural activities in the last 12 months, responded ‘none’ (69% and 90% respectively) (Table 9.33 and Table 9.34).
Factors limiting or preventing participation in activities
In 2022, the most frequently cited factor limiting or preventing people from participating in cultural activites was a ‘lack of time’ (14%). While 5% said they had ‘just did not get round to it’. The percentage of adults reporting these factors has decreased since 2019 (Table 9.35).
Satisfaction with local authority cultural services
This section presents the reported levels of satisfaction (including users and non-users of these services) for three different types of local authority cultural service (libraries, museums and galleries, theatres or concert halls).
In 2022, just under nine out of ten users were satisfied with local authority libraries (89%), museums and galleries (87%), and theatres and concert halls (85%). Satisfaction with libraries and museums and galleries have maintained since 2019. Satisfaction with theatres and concert halls has decreased from 89% in 2019 to 85% in 2022 (Table 9.49).
Satisfaction levels for ‘all adults’ (Table 9.36) are generally lower than among service users. This is because non service users are included, who may express no opinion about the service.
Impact of culture and heritage
In 2022, almost half of respondents (48%) ‘strongly agreed’ or ‘tended to agree’ with the statement “culture and the arts make a positive difference to my life”. 26% ‘neither agreed nor disagreed’, 23% ‘strongly disagreed’ or ‘tended to disagree’ and 4% had ‘no opinion’ (Table 9.52). Of these 48%, just under three in four (74%) reported that “culture and the arts make them feel happy or are something that they really enjoy”. 46% said that “culture and the arts improve their mental health and wellbeing” (Table 9.65).
Over half of adults (53%) ‘strongly agreed’ or ‘tended to agree’ with the statement “culture and the arts make a positive difference to my local community”. Almost half of respondents (47%) ‘strongly disagreed’ or ‘tended to disagree’ with the statement “culture and the arts are not really for me” (Table 9.52).
45% ‘strongly agreed’ or ‘tended to agree’ with the statement that “there are enough opportunities to get involved in culture and the arts if I want to in my local area”. 25% neither agreed not disagreed’, 18% ‘strongly disagreed’ or ‘tended to disagree’ and 12% had ‘no opinion’(Table 9.52)..
The majority of respondents (86%) ‘strongly agreed’ or ‘tended to agree’ that it is “important to them that Scotland’s heritage[3] is well looked after”. The majority of respondents (72%) ‘strongly agreed’ or ‘tended to agree’ that the “heritage of their local area is well looked after” (Table 9.52).
Contact
Email: shs@gov.scot