Scottish Household Survey 2022: Key Findings
Selected findings from the 2022 Scottish Household Survey, organised by topic area.

2. Neighbourhoods and communities
This chapter looks at experiences of neighbourhoods and communities. As noted in the introduction of the report, the data collection period was between 11 March 2022 and 6 March 2023. Many of the questions in this section relate to social contact, and access to community, and areas of community life that were affected by the COVID-19 pandemic and may continue to be affected by the repercussions of the pandemic, including changes to work, recreation, commerce, the design of public services, community social infrastructure, public transport and more. This report does not directly consider the impact of these factors on the results, but it may be useful to bear this in mind when reading the report.
Neighbourhoods
The majority of adults in Scotland (57%) rated their neighbourhood as a ‘very good’ place to live (Table 2.1). This has increased over the last ten years from 55% in 2012. Over nine in 10 adults (95%) rated their neighbourhood as a ‘very good’ or ‘fairly good’ place to live in 2022, an increase from 94% in 2012.
Neighbourhood ratings varied by area deprivation. Adults in the 20% least deprived areas were more likely to rate their neighbourhood as a ‘very good’ place to live than those in the 20% most deprived areas (77% in the least deprived areas, and 29% in the most deprived areas) (Table 2.5 and Chart 2.1). This gap has remained stable over the past ten years.
Chart 2.1: Rating of neighbourhood as a very good or fairly good place to live by Scottish Index of Multiple Deprivation (2022)
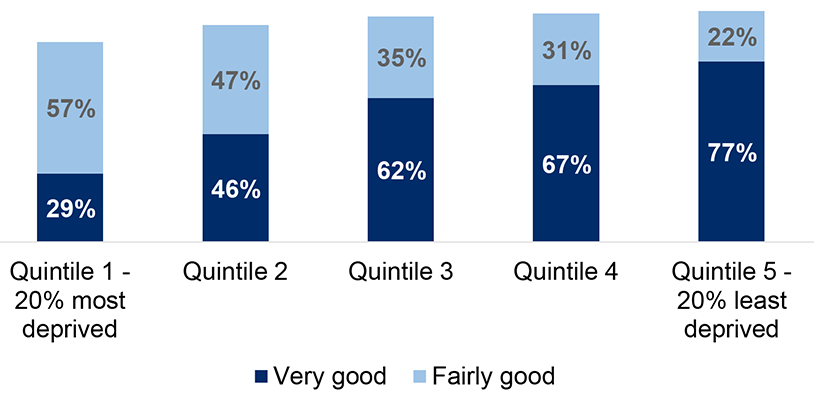
Those in remote rural areas or accessible rural areas (79% and 73%, respectively) were more likely to describe their neighbourhood as a ‘very good’ place to live than those in large urban areas, remote small towns, other urban areas and accessible small towns (48%, 49%, 56% and 63% respectively) (Table 2.2). Since 2019, adults in remote small towns have become less likely to rate their neighbourhood as a ‘very good’ place to live (the percentage reduced from 57% in 2019 to 49% in 2022).
Community
In 2022, people were more positive about the people-based features of their neighbourhood (such as kindness and trust), and less positive about the physical aspects of their neighbourhoods (such as the availability of places to socialise and meet new people). In 2022, 87% agreed with the statement “this is a neighbourhood where people are kind to each other” (Table 2.6) (this has maintained from 2019), 82% agreed “this is a neighbourhood where most people can be trusted” (an increase from 79% in 2019), and 57% agreed “there are places where people can meet up and socialise” (the same as 2019).
In the 20% most deprived areas, over two-thirds (68%) agreed “this is a neighbourhood where people from different backgrounds get on well together” (Table 2.9), an increase from 57% in 2019. There was higher agreement in the least deprived areas, with 79% agreeing with this statement (this figure has maintained since 2019). In 2022 , 69% of people who rent their homes privately agreed “this is a neighbourhood where people from different backgrounds get on well together” (Table 2.10), an increase from 44% in 2019. In remote rural areas, 81% agreed that “this is a neighbourhood where local people take action to help the neighbourhood” (Table 2.8), an increase from 73% in 2019.
Over four-fifths of adults (83%) felt a ‘very strong’ or ‘fairly strong’ sense of belonging to their community in 2022 (Table 2.11). This has increased from 78% in 2019. Sense of belonging varied according to age, sex, ethnic group, deprivation and tenure (Tables 2.11 to 2.15). Sense of belonging was lower for 25 to 34 year olds, ethnic minorities and ‘white other’ groups, people living in deprived areas and people who socially or privately rent. Women were more likely to feel a ‘very strong’ or ‘fairly strong’ sense of belonging to their neighbourhood than men (84% and 81%, respectively).
In 2022, 87% of adults agreed that “If I was alone and needed help, I could rely on someone in this neighbourhood to help me”, an increase from 85% in 2019. Nine-in-ten (91%) agreed that “In an emergency, such as a flood, I would offer to help people in my neighbourhood who might not be able to cope well” and 81% agreed with the statement “I feel I could turn to someone in this neighbourhood for advice or support” (Table 2.16). Since 2019, there has been an increase in women who agreed they would ‘offer to help neighbours in an emergency’, from 89% in 2019 to 91% in 2022 (Table 2.16). For men there was no change between 2019 and 2022 (90%).
In 2022, the SHS asked its biennial questions relating to issues of social isolation. The percentage of adults who met socially with friends, relatives, neighbours or work colleagues at least once a month increased, from 19% in 2018 to 21% in 2022. (Table 2.36). This figure is exlusive of people who reported that they meet weekly. People meeting socially at least once a week has decreased from 73% in 2018 to 69% in 2022. There were changes by age. All age groups except those aged 35 to 44 and 75 and over were meeting socially ‘at least once a week’ less often than they were in 2018. In 2022, disabled people were less likely (63%) than non-disabled people (71%) to meet socially once a week (Table 2.37). This is less than in 2018, when 68% of disabled people met socially at least once a week.
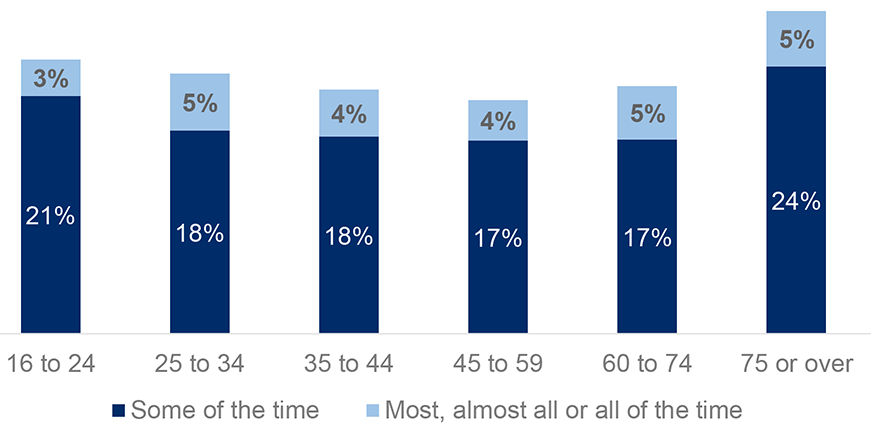
Nearly a quarter of adults living in Scotland (23%) experienced feelings of loneliness in the last week (Table 2.38), an increase from 21% in 2018. Those aged 75 or older reported the highest levels of loneliness, with 29% experiencing loneliness over the last week (Table 2.38 and Chart 2.2). Although levels of deprivation did not impact social isolation, as measured by the number of people meeting socially at least once a week, those living in the 20% most deprived areas were almost twice as likely to experience feelings of loneliness (30%) as those living in the 20% least deprived areas (16%) (Table 2.38). This suggests that factors other than the quantity of social interaction are involved in the higher reported levels of loneliness. Disabled people were over twice as likely (40%) to experience loneliness as non-disabled people (17%) (Table 2.38). Single pensioners, single adults and single parents were also more likely to experience loneliness in the last week compared to adults from other household types (Table 2.39).
Chart 2.2: How often adults have felt lonely in the past week by age (2022)
Over two-fifths (45%) of all adults reported that they did not experience any neighbourhood problems in 2022 (Table 2.25). The neighbourhood problems that were perceived as most common were ‘rubbish or litter lying around’ (34%) and ‘animal nuisance’ (31%) (Table 2.18). Those living in the 20% most deprived areas were more likely to say neighbourhood problems were common than those in the least deprived (72% compared with 39%) (Table 2.20). Since 2019, problems with rubbish and litter, and with vandalism, graffiti or other deliberate damage to property, have increased, particularly for social and private renters and those living in the most deprived areas. More 16 to 24 year olds reported neighbourhood problems than those aged 75 and older for all problems apart from animal nuisance (Table 2.22).
Another Scottish Government population survey, the Scottish Crime and Justice Survey (SCJS), also collects information on perceptions of a range of neighbourhood issues, including feeling of safety, how common specific crimes are believed to be in the local area, alongside respondents’ views on neighbourhood cohesion and community support. As questions are asked in a different survey context, any similar measures should not be directly compared to SHS findings.
Neighbourhood safety
The majority of people (81%) said they felt ‘very’ or ‘fairly safe’ walking alone in their neighbourhood after dark, a decrease from 83% in 2019. There are differences by sex, with 91% of men saying they would feel ‘very’ or ‘fairly safe’ walking alone after dark, compared to 72% of women (Table 2.32). There is a clear association between how adults rated their neighbourhood and how safe they felt in their communities: 83% of adults who rated their neighbourhood as ‘very’ or ‘fairly good', said they felt safe walking alone at night, compared with just 26% of adults who rated their neighbourhood as ‘very poor’ (Table 2.35).
Discrimination and harassment
One in 13 adults (8%) reported that they had experienced discrimination (Table 2.30), and one in 20 adults (5%) had experienced harassment (Table 2.29), in the last 12 months. Some groups were more likely than others to report having experienced discrimination or harassment: for instance, ethnic minorities, disabled people, people who are gay, lesbian or bisexual and those who belong to a religion other than Christianity (Table 2.29). Sixteen to 24 year olds were more likely to report experiencing discrimination and harassment than those aged 75 and older (Table 2.28).
The most commonly perceived reasons for discrimination included the respondent’s ‘accent’ or ‘nationality’ (both 20%) (Table 2.30). The most common perceived reasons for harassment include ‘ethnicity’ (18%) and ‘nationality’ and ‘accent’ (both 16%) (Table 2.31).
Contact
Email: shs@gov.scot