The Scottish Health Survey 2021 - volume 1: main report
Presents results for the Scottish Health Survey 2021, providing information on the health and factors relating to health of people living in Scotland.
Chapter 8 Alcohol and Drugs
Chapter Summary
Prevalence of hazardous or harmful levels of weekly alcohol consumption1 has declined steadily since 2003.
The mean number of units of alcohol consumed per week by adult drinkers has also declined since 2003.
Prevalence of hazardous or harmful weekly alcohol consumption was around twice as high for men as for women in 2021.
- 23% All adults
- 31% Men
- 16% Women
Male drinkers also consumed more units of alcohol per week than female drinkers in 2021.
- 11.3 All adults
- 14.8 Men
- 8.0 Women
In 2021, hazardous or harmful levels of alcohol consumption were highest among those aged between 45 and 74.
In 2021, among all adults, hazardous1 or harmful levels of weekly alcohol consumption were more common in the least deprived areas, while not drinking was more common in the most deprived areas.
In 2021, 12% of adults reported using drugs in the previous 12 months, of these:
- 14% Men
- 11% Women
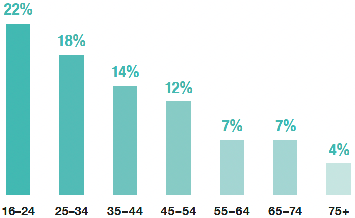
Drug use in the previous 12 months decreased with age:
In 2021, the following proportions of adults used class A, class B or class C drugs in the previous 12 months:
- 4% Class A
- 7% Class B
- 2% Class C
Among all adults, cannabis was the most used drug in 2021 and had the highest prevalence among those aged 16-24.
- 6% All adults
- 18% 16-24 year olds
In 2021, drug use was more common in the most deprived areas, and this was true for both class A and class B drugs.2
In 2021, 9% of adults reported ever having had a problem with alcohol, with 1% saying they still had a problem.
- 10% Men
- 8% Women
In 2021, 3% of adults reported ever having had a problem with drugs, with less than 0.5% saying they still had a problem.
Men were more likely that women to have had a problem with drugs in 2021.
- 4% Men
- 2% Women
In 2021, adults who had used any drug in the last 12 months had significantly lower mental wellbeing as measured by WEMWBS3 on average than those who had not.
- 45.4 used drugs
- 49.1 not used drugs
1 More than 14 units per week.
2 Use of class A drugs was most prevalent in the most deprived areas, but was not significantly higher than in all other deprivation quintiles.
3 WEMWBS scores range from 14 to 70. Higher scores indicate greater wellbeing.
Alcohol and Drugs
Alys Daniels-Creasey
8.1 Introduction
Harmful alcohol consumption has been an ongoing public health challenge in Scotland for decades. It is linked with a risk of physical and mental health problems, as well as social and economic losses to individuals and society.[1] In 2021, 1,245 people died from alcohol-specific causes in Scotland which is a 5% increase from 2020, and the highest number of deaths since 2008.[2] In contrast, however, 2021 (as did 2020) saw the lowest level of alcohol sales over the available time series (1994) – 9.4 litres of pure alcohol were sold per adult in Scotland which represents 18.1 units of alcohol per adult per week[3] nearly 30% above the UK Chief Medical Officers' guidelines of 14 units per adult per week.
In 2021, COVID-19 restrictions continued to affect alcohol sales through on-trade premises (such as pubs, clubs and restaurants). In 2021, 85% of all pure alcohol sold in Scotland was sold through the off-trade (supermarkets and other off-licences): this is a decrease from 90% in 2020 but an increase from 72% in 2019. The average price of alcohol in 2021 in the off-trade was 64 pence per unit, whereas it was £2.04 per unit in the on-trade.
Problem drug use in Scotland is defined as the problematic use of opioids (including illicit and prescribed methadone), and/or illicit use of benzodiazepines, routinely and over prolonged periods. Inevitably, much of the problem drug using population is hidden, and drug prevalence figures can only ever be estimates, combining available data on observed cases with an estimate of the unknown population. Nevertheless, a 2015/16 study estimated prevalence at between 55,800 and 58,900 individuals (1.62% of individuals aged 15-64 years).[4]
Existing inequalities mean that the burden of alcohol-related morbidity and mortality is greatest among those living in the most deprived areas.[5],[6] The disease burden of drug use disorders is also much higher in the most deprived areas than in the least deprived areas.[7]
8.1.1 Policy background
The Alcohol Framework 2018: Preventing Harm[8] endorses the WHO Safer initiative of evidence-based strategies to tackle alcohol-related harm[9] and includes actions related to putting the voices of children and young people at the heart of alcohol preventative measure development; reducing alcohol consumption through affordability; supporting families and communities, keeping the licensing system and statutory guidance under review and consulting on marketing restrictions. In 2021, the Scottish Government launched a national mission to improve and save lives, at the core of which is ensuring that every individual is able to access the treatment and recovery they choose.
The Scottish Government is working on initiatives that will support communities across Scotland to address harmful and hazardous alcohol consumption. These include piloting an innovative Managed Alcohol Programme in Glasgow in partnership with Simon Community Scotland, commissioning Public Health Scotland to conduct a review of alcohol brief interventions in Scotland, consulting on a range of potential alcohol marketing restrictions in Scotland, and supporting the UK Government on reviewing and updating clinical guidelines for alcohol treatment.
The National Mission on Drug Deaths was announced in January 2021 by the First Minister. The National Mission reviewed and learned from best practice at home and internationally and concluded that a public health approach to drugs is the most effective way forward. Its aim is to reduce drug deaths and improve the lives of those impacted by drugs. This will be done by preventing people from developing drug use; reducing harms from the consumption of drugs; getting more people into treatment; addressing the needs of people with multiple and complex needs and supporting families and communities affected by problem drug use.
It sits alongside the Scottish Government's wider commitments to improving population health and requires a whole system approach, working in partnership across the Scottish Government, local authorities and the third sector. This challenge is complex and multi layered and involves tackling deep rooted societal and economic challenges that existed for decades. The approaches, which are all well evidenced, include an emergency response – addressing the immediate harms and preventing overdose from becoming fatal; reducing risk through improving the accessibility and quality of treatment; and reducing vulnerability by addressing the complex needs of people with drug problems.
8.1.2 Reporting on harmful alcohol and drug use in the Scottish Health Survey
This chapter reports weekly alcohol consumption and problem drinking trends and figures for 2021 for adults. It also reports adult drug use and problems with drug use. In addition, drug use is reported by mental wellbeing (WEMWBS).
The area deprivation data are presented in Scottish Index of Multiple Deprivation (SIMD) quintiles. To ensure that the comparisons presented are not confounded by the different age profiles of the quintiles, the data have been age-standardised. For a detailed description of both SIMD and age-standardisation as well as definitions of other terminology used in this chapter and for further details on the data collection methods for alcohol and drug use, problem alcohol and drug use and mental wellbeing, please refer to Chapter 2 of the Scottish Health Survey 2021- volume 2: technical report.
Supplementary tables on alcohol and drug use are also published on the Scottish Government website: Scottish Health Survey.
8.2 Alcohol and Drugs
8.2.1 Estimated usual weekly alcohol consumption level, 2003 to 2021, by sex
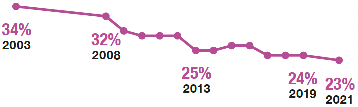
The prevalence of hazardous or harmful drinking levels for all adults significantly decreased from 34% in 2003 to 25% in 2013. Since 2014, levels have remained in the range 23% - 26%, with the 2021 figure of 23% the lowest in the time series. The prevalence of hazardous or harmful drinking by sex has followed a similar pattern over time, with levels consistently around twice as high for men compared with women across the time series (31% for men and 16% for women in 2021).
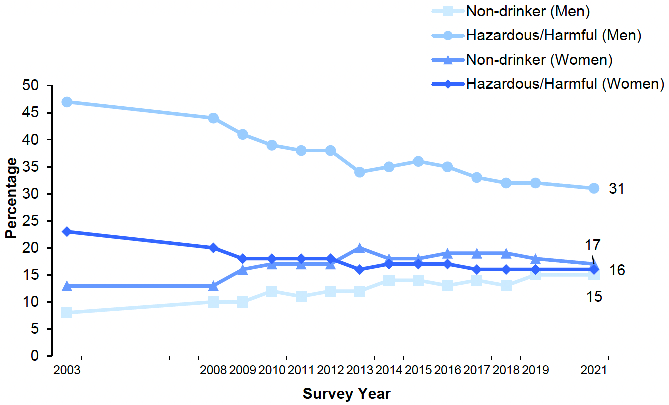
Among all adults an increase in the proportion of non-drinkers was recorded between 2003 and 2013, with prevalence rising from 11% in 2003 to 16% in 2013. Levels have since remained between 16% and 17% (16% in 2021). Across the time series, the prevalence of non-drinkers by sex have shown similar patterns, peaking at 15% in 2019 and 2021 among men and 20% in 2013 among women. Since 2014 levels for both have been relatively stable, in the range 13% - 15% among men and 17% - 19% among women. Figure 8A, Table 8.1
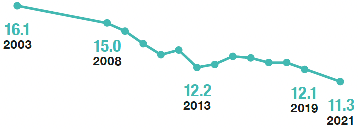
A decrease in the mean number of units of alcohol consumed per week by all adult drinkers has been recorded over time, decreasing from 16.1 units in 2003 to 12.2 units in 2013. The mean number of units consumed per week remained between 12.1 and 12.9 between 2014 and 2019 before decreasing to 11.3 in 2021, the lowest point in the time series.
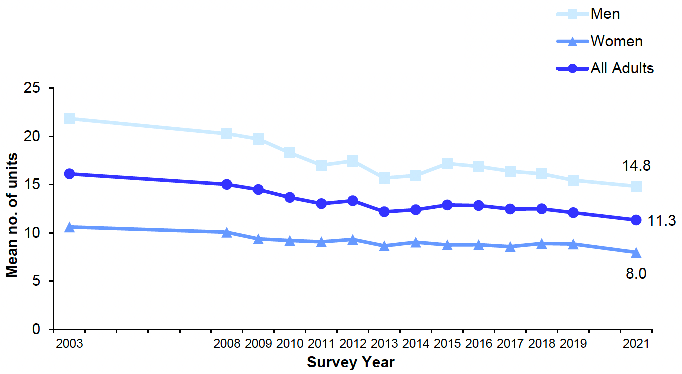
Across the time series, the mean number of units of alcohol consumed per week has been approximately twice as high for men than for women. However, between 2003 and 2021, the decrease in consumption was greater among men compared with women. Among men, the mean number of units consumed per week decreased from 21.8 to 14.8, compared with 10.6 to 8.0 among women over the same time period. Figure 8B, Table 8.1
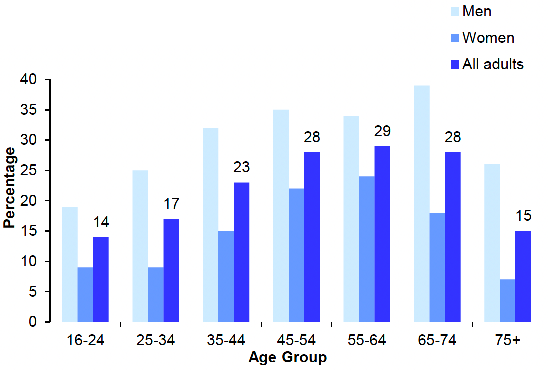
8.2.2 Estimated usual weekly alcohol consumption level, 2021, by age and sex
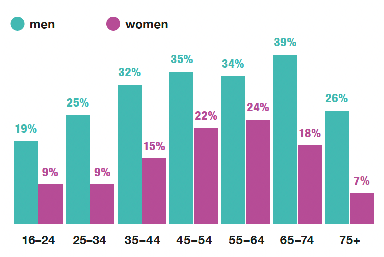
The prevalence of hazardous or harmful drinking levels varied by age, increasing from 14% among those aged 16-24 to 29% among those aged 55-64, before falling to 15% among adults aged 75 and over. Levels of hazardous or harmful drinking were significantly higher among men compared with women across all age groups. Among men, those aged 65-74 recorded the highest prevalence (39%), whilst the lowest was recorded among men aged 16-24 (19%). Among women, prevalence of hazardous or harmful drinking peaked among those aged 55-64 (24%), with the lowest prevalence found among those in the youngest and oldest age groups (9% among those aged 16-34 and 7% among those aged 75 and over).
Among all adults in 2021, the proportion of non-drinkers was highest among those aged 75 and above (24%) compared with a range of 14% - 16% among those between the ages of 25 and 74. There were no significant differences by sex between the age groups.
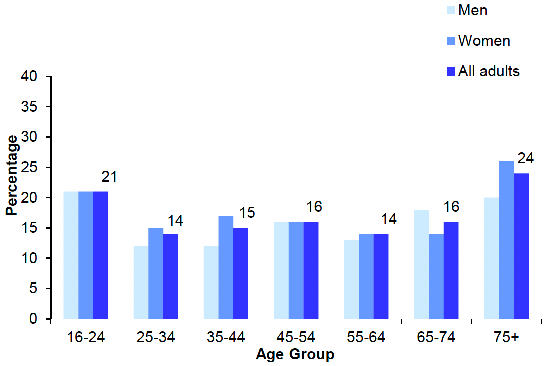
Figures 8C and 8D, Table 8.2
8.2.3 Estimated usual weekly alcohol consumption level (age-standardised), 2021, by area deprivation and sex
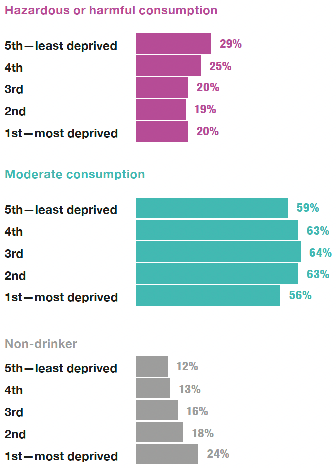
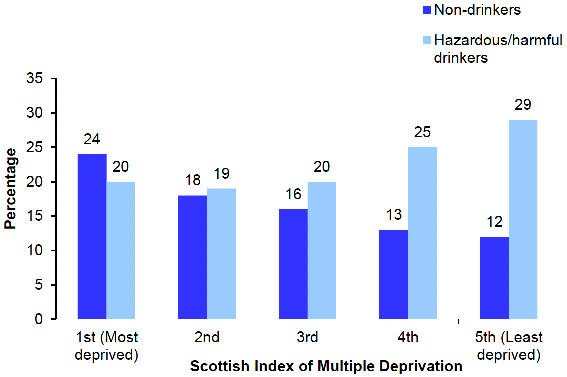
As in previous years, the estimated levels of age-standardised weekly alcohol consumption varied by area deprivation in 2021. Among all adults, the prevalence of hazardous or harmful drinking levels was lowest among those living in the most deprived areas (19% - 20% among those living in the three most deprived SIMD quintiles) and highest among those living in the least deprived areas (25% among those living in quintile 4, and 29% among those living in quintile 5). Similar patterns were recorded by sex.
There continued to be a significant association between area deprivation and non-drinking prevalence in 2021, with the highest proportion of non-drinkers living in the most deprived areas (24%) and lowest proportion living in the least deprived areas (12%). This pattern was recorded amongst both men and women.
The age-standardised mean number of units of alcohol consumed per week by adult drinkers did not vary significantly by area deprivation (in the range 10.4 – 12.1 units). Across all deprivation quintiles, a higher mean number of units of alcohol were consumed per week amongst men compared with women, with the greatest difference found between sexes in quintile 1, the most deprived area (17.8 units for men and 6.3 units for women). Figure 8E, Table 8.3
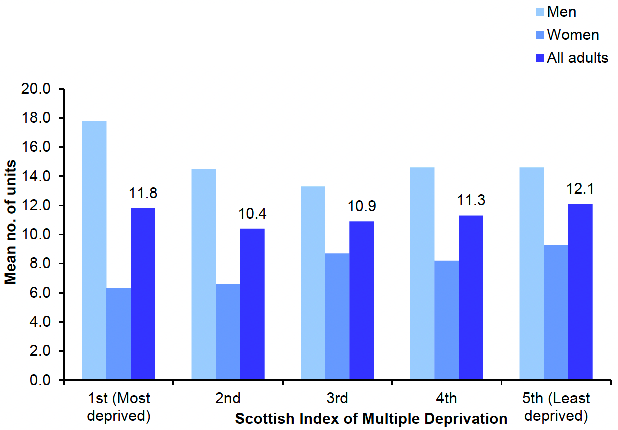
Figure 8F, Table 8.3
8.2.4 AUDIT scores, 2021, by age and sex
AUDIT scores are used to determine alcohol dependency or high-risk use. In 2021, 86% of all adults were abstinent or had low-risk alcohol consumption habits (AUDIT scores of 0-7). As in previous years, women were more likely than men to be abstinent or to drink in a way that conferred low risk (91% compared to 82% respectively).
The prevalence of hazardous, harmful or possibly dependent drinking behaviour (AUDIT scores of 8 or more) among all adults was 14% in 2021, with the proportion recorded amongst men (18%) double that recorded for women (9%). Just 1% of all adults had an AUDIT score of 16+, indicating harmful or possibly dependent consumption levels, with no variation by sex.
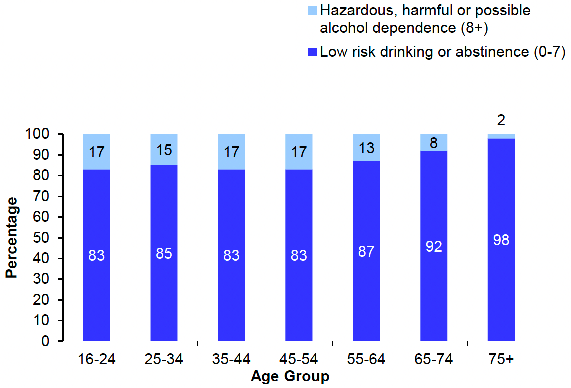
In 2021, abstinence or low-risk drinking (an AUDIT score of 0-7) was higher among the oldest age groups, 92% among those aged 65-74 and 98% among those aged 75 and over, while for younger groups this was in the range 83% - 87%. The prevalence of hazardous, harmful or possible alcohol dependence (AUDIT scores of 8 or more) decreased with age, from 15% - 17% of those aged 16-54 to 2% of those aged 75 and over.
Similar patterns were recorded for men and women with regards to the proportions who were abstinent or low-risk drinkers and the proportions of hazardous, harmful or possible alcohol dependent drinkers. Figure 8G, Table 8.4
8.2.5 AUDIT scores (age-standardised), 2021, by area deprivation and sex
There was no clear association between area deprivation and the age-standardised prevalence of hazardous, harmful or possibly dependent drinking behaviour among all adults or by sex. The greatest proportion of adults with an AUDIT score above 8 was found among those living in the most deprived area (17%), however this was not significantly higher than other groups, which were all in the range 12% - 14%. Similar patterns were recorded by sex. Table 8.5
8.2.6 Adult drug use in the last 12 months by drug type,[10] 2021, by age and sex
In 2021, just over one in ten adults had used any of the drugs included in the survey in the last 12 months (12%), with similar proportions recorded amongst men (14%) and women (11%). Among all adults in 2021, 4% had used Class A drugs in the last year, 7% had used Class B drugs and 2% had used Class C drugs, with similar patterns recorded by sex.
Adults reporting having used any drug in the previous 12 months decreased with age in 2021, from 22% among those aged 16-24 to 4% among those aged 75 and over. The overall pattern of decreasing drug use by age was evident for both Class A and Class B drugs. The proportions reporting use of these drugs in the last 12 months decreased from 7% among those aged 16-34 to 1% among those aged 75 and above for Class A drugs and from 19% to 1% respectively for Class B drugs. Class C drug use was low across all age categories (in the range 0% - 3%). These patterns were similar for men and women.
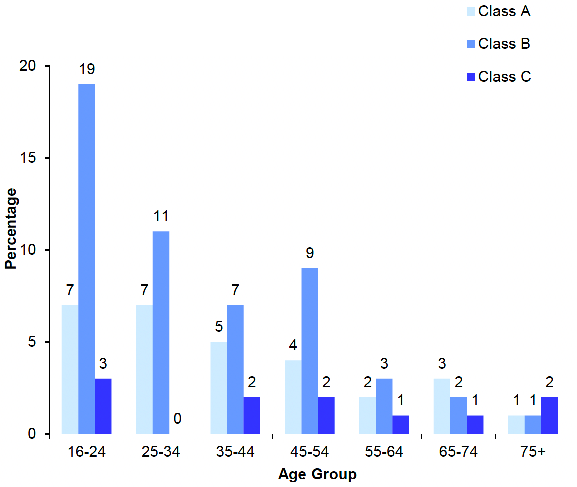
In 2021, cannabis was the drug with the highest reported use (6%) amongst all adults, followed by cocaine (3%), poppers (2%) and prescription drugs not prescribed to them (2%).
A higher proportion of men in 2021 reported having used cannabis in the past 12 months compared with women (8% compared with 5% respectively). Reported cannabis use among all adults in 2021 was higher among those aged 16-24 (18%) compared with those in other age groups (in the range 1% - 9%). Figure 8H, Table 8.6
8.2.7 Adult drug use in the last 12 months by drug type (age-standardised), 2021, by area deprivation and sex
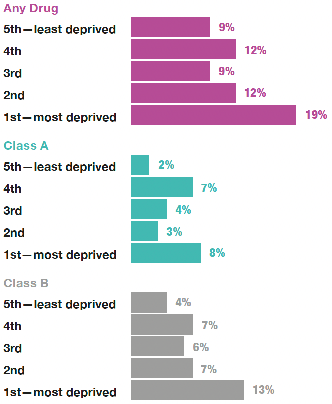
In 2021, the age-standardised prevalence of any drug use in the past 12 months for all adults was highest amongst those living in the most deprived areas (19%), with prevalence ranging between 9% - 12% amongst those living in the other four quintiles. Similar overall patterns were recorded by sex, although there were some non-significant variations recorded.
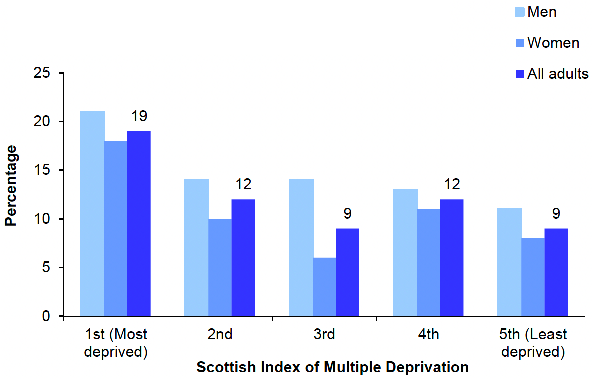
In 2021, the age-standardised prevalence of Class B drugs taken in the last 12 months varied by area deprivation, with a significantly higher prevalence recorded among those living in the most deprived areas (13%) compared to those living in the other four quintiles (ranging from 4% - 7%). A similar but non-significant pattern was recorded for Class A drug use, while low proportions across all areas reported using Class C drugs in the last 12 months. Figure 8I, Table 8.7
8.2.8 Previous and current problem with alcohol and drug use, 2021, by age and sex
In 2021, 9% of all adults reported ever having had a problem with alcohol and 3% reported ever having had a problem with drugs. A small proportion of adults reported a current problem with alcohol (1%), while less than 1% reported having a current problem with drugs. There was no significant difference for those who reported ever having had a problem with alcohol by sex, while there was a significant difference for those who reported ever having had a problem with drug use (4% among men and 2% among women).
Among all adults in 2021, 1% reported ever having had a problem with both alcohol and drugs, with no significant difference between sexes, and less than 1% reported that they currently had a problem with both.
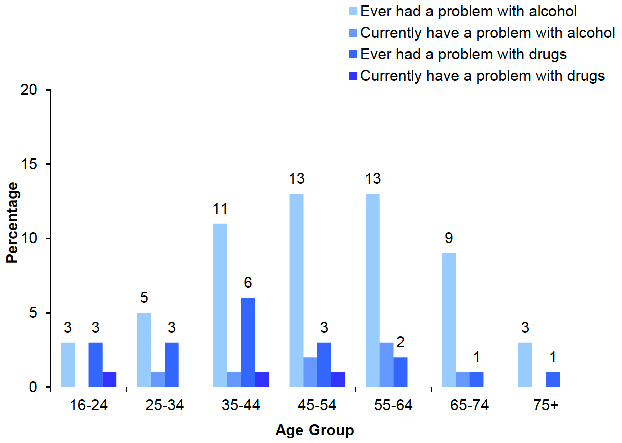
The prevalence of having ever had a problem with alcohol in 2021 was highest among those aged 35-64 (in the range 11% - 13%), with lower proportions recorded among those aged 16-34 (3% - 5%) and those aged 75 and above (3%).
The prevalence of having ever had a problem with drugs ranged from 1% among those aged 65 and above to 3% - 6% among those aged 16-64. Figure 8J, Table 8.8
8.2.9 Adult WEMWBS mean score, 2021, by drug use and sex
In 2021, adults who had used drugs in the previous 12 months reported lower mental wellbeing scores on average than those who had not used drugs (mean WEMWBS scores of 45.4 and 49.1 respectively). Similar patterns were recorded among both men (45.0 and 49.5 respectively) and women (45.8 and 48.6 respectively).
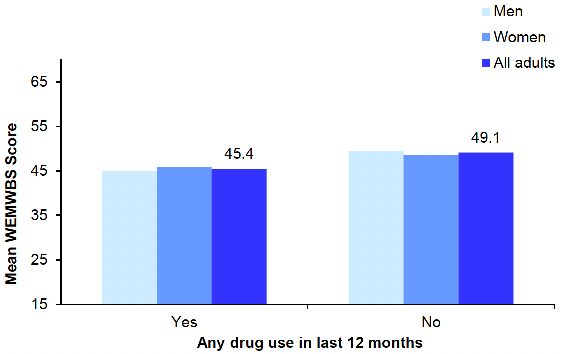
Figure 8K, Table 8.9
Table list
Table 8.1 Estimated usual weekly alcohol consumption level, 2003 to 2021, by sex
Table 8.2 Estimated usual weekly alcohol consumption level, 2021, by age and sex
Table 8.3 Estimated usual weekly alcohol consumption level (age-standardised), 2021, by area deprivation and sex
Table 8.4 AUDIT scores, 2021, by age and sex
Table 8.5 AUDIT scores (age-standardised), 2021, by area deprivation and sex
Table 8.6 Adult drug use in the last 12 months by drug type, 2021, by age and sex
Table 8.7 Adult drug use in the last 12 months by drug type (age-standardised), 2021, by area deprivation and sex
Table 8.8 Previous and current problem alcohol and drug use, 2021, by age and sex
Table 8.9 Adult WEMWBS mean score, 2021, by drug use and sex
The tables can be found on the main report page under supporting files.
References and notes
1. World Health Organization (2018) Alcohol Fact Sheet.
2. Alcohol-specific deaths | National Records of Scotland.
3. Monitoring and Evaluating Scotlands Alcohol Strategy (MESAS), 2022.
4. See Prevalence of Problem Drug Use in Scotland: 2015/16 Estimates.
5. Giles, L and Richardson, E. (2021). Monitoring and Evaluating Scotland's Alcohol Strategy: Monitoring Report 2021. Edinburgh: Public Health Scotland.
6. Katikireddi SV, Whitley E, Lewsey J, Gray L and Leyland AH (2017). Socioeconomic status as an effect modifier of alcohol consumption and harm: analysis of linked cohort data. Lancet Public Health; 2: 267–76.
7. Rights, respect and recovery: alcohol and drug treatment strategy.
8. Scottish Government. (2018). Alcohol Framework 2018: Preventing Harm.
9. SAFER - alcohol control initiative (who.int).
10. For more information on the drugs included in the survey, see Chapter 2 of the Scottish Health Survey 2021- volume 2: technical report.