The Scottish Health Survey 2021 - volume 1: main report
Presents results for the Scottish Health Survey 2021, providing information on the health and factors relating to health of people living in Scotland.
Chapter 5 Obesity
Chapter Summary
In 2021, height and weight measurements for adults were self-reported. BMI calculations have been adjusted to allow for comparison with previous years.
In 2021, two-thirds of adults were living with overweight1, similar to or marginally higher than rates in each year since 2008.
- 67% in 2021
Men have consistently shown higher prevalence of overweight than women each year since 2008.
- 64% women in 2021
- 70% men in 2021
Adults living with obesity2 and morbid obesity3 in 2021.
- 30% obesity
- 4% morbid obesity
Women were more likely to be living with morbid obesity than men in 2021.
- 6% women
- 2% men
In 2021, a much higher proportion of adults aged 16-24 had a healthy weight than those aged 25-34 with further de 67% creases in older age groups.
- 61% aged 16-24
- 36% aged 25-35
In 2021, prevalence of overweight (including obesity) generally increased across the age groups to age 55-64.
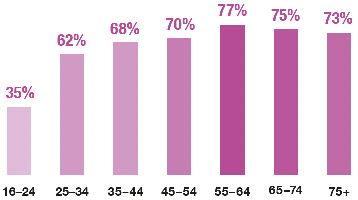
Mean BMI was lowest for those aged 16-24 and highest for those aged 55-64.
- 24.7 kg/m2 aged 16-24
- 29.2 kg/m2 aged 55-64
In 2021, BMI calculations for children were based on unadjusted, self-reported height and weight measurements. It is, therefore, not clear whether any changes compared with previous years are genuine or due to the way the data were collected.
In 2021, almost two thirds of children were in the healthy weight range4, the lowest the survey has recorded.
Almost one in five children were considered at risk of obesity5 in 2021.
- 18% children
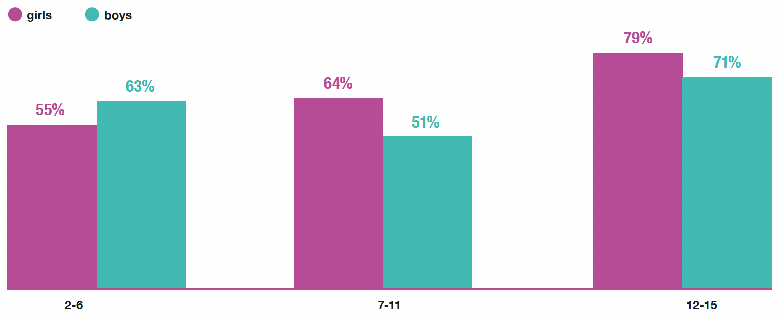
Children aged 12-15 were more likely to be in the healthy weight4 category than younger children in 2021.
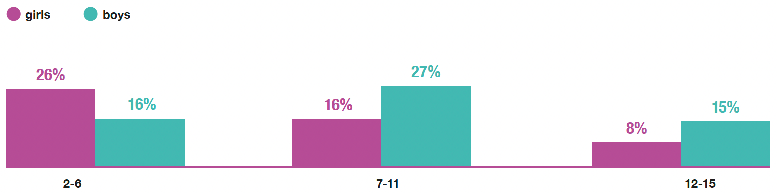
The risk of obesity5 was highest for boys aged 7-11 and girls aged 2-6 in 2021.
1 A BMI of at least 25 kg/m2
2 A BMI of at least 30 kg/m2
3 A BMI of at least 40 kg/m2
4 Within healthy range = BMI above 2nd percentile, below 85th percentile.
5 At risk of obesity = BMI at or above 95th percentile.
Obesity
Sophie Birtwistle
5.1 Introduction
Obesity is defined by the World Health Organisation as a disease characterised by excess adiposity. It is a "chronic, relapsing disease resulting from complex interactions between a range of factors, including those that occur at a biological, commercial, social and political level".[1]
Obesity is classified as having a Body Mass Index (BMI) of 30 kg/m2 or more.
Research has shown that more than 1 in 20 adult cancer cases are linked to excess weight in the UK making obesity possibly the second largest preventable cause of cancer.[2] Obesity has been linked to a range of comorbidities including diabetes, cardiovascular disease (CVD), hypertension and certain cancers in adults.[3],[4] Such conditions and/or the risk could be reduced overall even with modest reductions in body mass.[5]
Studies have indicated that there is an association between mental health problems such as depression and anxiety and living with obesity.[6],[7],[8] There is also evidence of a link between living with overweight and obesity in midlife and possible dementia in late life.[9],[10],[11] The evidence also suggests that younger people in the UK are living with a higher BMI at an earlier age and staying at that higher BMI for longer.[12] The longer a person lives with a higher BMI, the greater their risk of developing chronic diseases and some forms of cancer.[13] More recently, evidence suggests that living with excess weight is also associated with an increased risk of serious COVID-19 outcomes.[14],[15]
5.1.1 Policy background
The Scottish Government published A Healthier Future: Scotland's Diet and Healthy Weight Delivery Plan[16] in July 2018. The Scottish Government sets out an aim to halve child obesity by 2030 and significantly reduce diet-related health inequalities. It sets out a wide range of actions aimed at ensuring:
- Children have the best start in life – they eat well and have a healthy weight.
- The food environment supports healthy choices.
- People have access to effective weight management services.
- Leaders across all sectors promote healthy weight and diet.
- Diet-related inequalities are reduced.
The Scottish Government also published its Out Of Home Action Plan in September 2021. The plan includes a commitment to consult on mandating calorie labelling and the creation of a code of practice for children's menus.
5.1.2 Reporting obesity in the Scottish Health Survey (SHeS)
This chapter updates trends for adults and children for body mass index (BMI)[17] as well as prevalence for 2021.
In 2021, the telephone format of the survey meant that height and weight measurements used to calculate BMI were self-reported by respondents rather than being taken by the interviewer as in previous years. The self-reported measurements for adults were uprated based on a comparison study by the Health Survey for England. No equivalent adjustment factors are available for children and hence the analysis is based on self-reported measurements.
For detailed definitions of terminology used in this chapter and for further details on the data collection methods for obesity, please refer to Chapter 2 of the Scottish Health Survey 2021- volume 2: technical report.
Supplementary tables on obesity are also published on the Scottish Government website: Scottish Health Survey.
5.1.3 Comparability with other UK statistics
Adult obesity is defined consistently in the Scottish Health Survey (SHeS) and the other health surveys within the UK using BMI classifications. Sampling methodologies differ between the surveys. Of the four UK health surveys, SHeS and Health Survey for England are the most closely aligned.
5.2 Obesity
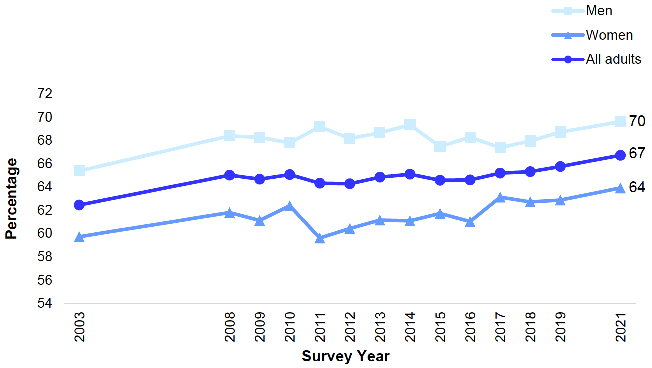
5.2.1 Adult BMI, 2003 to 2021, by sex
Since 2008 prevalence of overweight including obesity (BMI of 25 kg/m² or over) has remained fairly constant, although levels in 2021 were slightly higher than a decade earlier (67% compared with 64% in 2011 and 2012).
The prevalence of overweight including obesity remained consistent for both men and women between 2008 and 2021. However, men consistently had a higher rate of overweight including obesity compared with women. Since 2008 it has fluctuated between 67 - 70% for men and 60-64% for women, with figures for 2021 being at the top end of those ranges in both cases.
In 2021, there was no significant difference in the prevalence of obesity (BMI of 30 kg/m² or over) between men and women (30% overall: 29% for men and 31% for women). Between 2008 and 2021 the prevalence has fluctuated between 26 - 29% for men and 27 - 31% for women.
Prevalence of morbid obesity (BMI of 40kg/m² or over) has increased slightly since 2015, from 3% to 4% in 2021. While levels of morbid obesity have remained fairly constant for men at between 2% and 3% (2% in 2021), during this period prevalence of morbid obesity has doubled for women, from 3% to 6%.
Mean BMI in 2021 was 28.0 kg/m2 (27.9 for men and 28.2 for women). These figures have gradually risen since 2012, when mean BMI was 27.4 kg/m2 for both men and women. Figure 5A, Table 5.1
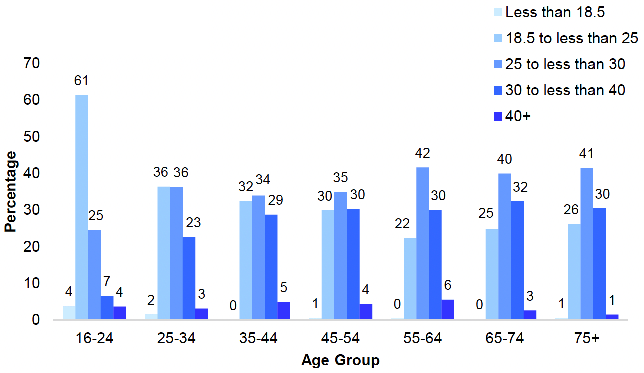
5.2.2 Adult BMI, 2021, by age and sex
In 2021, a third (32%) of all adults had a BMI of 18.5 to less than 25kg/m² and classed in the healthy weight category. There were a higher proportion of women in the healthy weight category compared with men (35% compared with 30%). Two thirds (67%) of all adults were living with overweight in 2021, and the prevalence was significantly higher for men compared with women (70% compared with 64%). The prevalence of living with obesity did not vary significantly between men and women in 2021 (29% and 31% respectively). However, the prevalence of morbid obesity was higher for women than for men (6% compared with 2%).
61% of adults aged 16-24 were in the healthy weight category. For other age groups this varied between 22 - 36%. Those aged 16-24 had a significantly lower prevalence of overweight and obesity, with 35% prevalence of overweight (including obesity) and 10% prevalence of obesity (including morbid obesity). By comparison, overweight and obesity were most prevalent among those aged 55-64 (77% and 36% respectively).
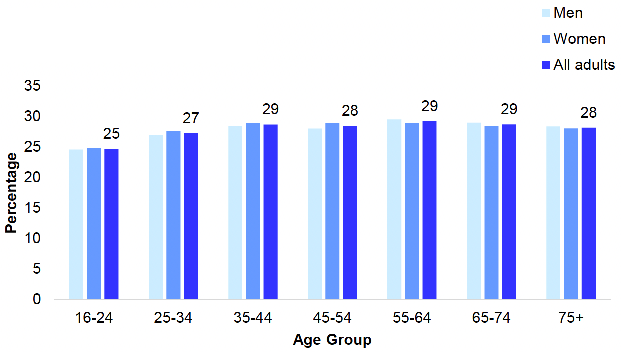
In 2021, mean BMI was 28.0 kg/m2. It was lowest for those aged 16-24 at 24.7 kg/m² and increased across the age groups until age 55-64 (29.2 kg/m²), before decreasing slightly to 28.2 kg/m2 among those aged 75+. Similar patterns were observed for both and women across age groups for mean BMI. Figure 5B and 5C, Table 5.2
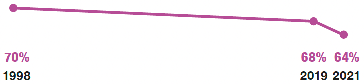
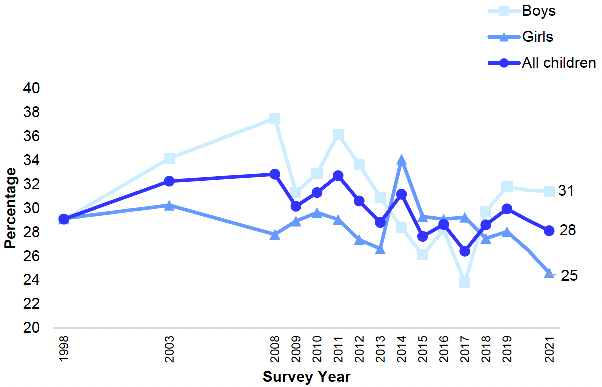
5.2.3 Child BMI, 1998 to 2021, by sex
The proportion of children in the healthy weight range (BMI above 2nd percentile and below 85th percentile) remained relatively consistent between 1998 and 2019. Figures for 2021 showed a decrease of 4% in the proportion of children in the healthy weight range, from 68% in 2019 to 64% in 2021; the lowest the survey has recorded since 1998. As heights and weights were self-reported in the 2021 survey and not adjusted, it is not clear whether this represents a genuine change or is due to the way the data were collected. More details are provided in chapter 2 of the technical report. The proportion of children in the healthy weight category had decreased for both boys and girls since 2019 (from 66 - 61% and 70 - 67% respectively). Between 1998 and 2021, the proportion of children in the healthy weight range has fluctuated more for boys than for girls (between 61 - 75% and 65 - 72% respectively).
The proportion of children at risk of overweight including obesity (BMI at or above 85th percentile) has remained relatively stable, fluctuating between 26 - 33% between 1998 and 2021. In 2021 the proportion of children at risk of overweight including obesity was 28%. The proportion of girls in this category in 2021 was at the lower end of the range across the years (25% in 2021, 27 - 34% in earlier years of the survey), and lower than the proportion of boys in this category in 2021 (31%). This figure for boys was in the middle of the range of previous survey years (24 - 38%). Again, it is not clear whether these figures for girls represent a real change or reflect the difference in methodology from previous years.
The proportion of children at risk of obesity (BMI at or above 95th percentile) has remained relatively constant between 1998 and 2021. However, 2021 recorded the highest proportion of children at risk of obesity at 18%, a 5% increase on 2017 figures (13%). Figure 5D, Table 5.3
5.2.4 Child BMI, 2021, by age and sex
In 2021, there was a difference between the proportion of boys and girls in the healthy weight category (61% for boys and 67% for girls) but it was not significant. However, there were significant differences across age groups. Sixty-three percent of boys aged 2-6 were in the healthy weight category. This figure decreased to 51% for those aged 7-11 and then greatly increased to 71% for those aged 12-15. This pattern was not the same for girls as there was continuous increase in the proportion of girls in the healthy range from 55%, then to 64% and then to 79% through the age groups.
In 2021, there was no significant difference between the proportion of boys and girls at risk of overweight (11% for boys and 9% for girls). There were differences across age groups in this weight category. Eight percent of boys aged 2-6 were at risk of overweight, this increased to 14% for boys aged 7-11 and decreased to 11% for boys aged 12-15. This pattern was similar for boys and girls.
In 2021, there was no significant difference between the proportion of boys and girls at risk of obesity (20% and 16% respectively). However, there was a significant difference across age groups for this weight category. Sixteen percent of boys aged 2-6 were at risk of obesity; this increased to 27% for boys aged 7-11 and decreased to 15% for boys aged 12-15. This pattern was not replicated for girls, as there was continuous decrease in the proportion of girls in this weight category, from 26% to 16% then to 8% across the age groups. Figure 5E, Table 5.4
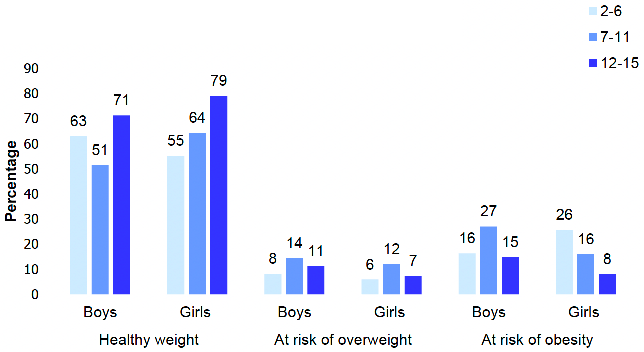
Table list
Table 5.1 Adult BMI, 2003 to 2021, by sex
Table 5.2 Adult BMI, 2021, by age and sex
Table 5.3 Child BMI, 1998 to 2021, by sex
Table 5.4 Child BMI, 2021, by age and sex
The tables can be found on the main report page under supporting files.
References and notes
1. World Obesity Federation. Available at: Addressing weight stigma and misconceptions about obesity in Europe: Considerations for policymakers.
2. Brown, K. F. et al. The fraction of cancer attributable to modifiable risk factors in England, Wales, Scotland, Northern Ireland, and the United Kingdom in 2015. Br. J. Cancer 118, 1130–1141 (2018).
3. Defined in adults as a body mass index (BMI) of 30 kg/m² or greater.
4. Abdelaal M, le Roux, C and Docherty, N (2017). Morbidity and mortality associated with obesity. Annals of Translational Medicine; 5(7): 101: p.1.
5. World Cancer Research Fund/American Institute for Cancer Research (2018). Diet, nutrition, physical activity and cancer: a global perspective. Continuous Update Project Expert Report. Food, Nutrition and Physical Activity and the Prevention of Cancer: a Global Perspective. [Online]
6. Floriana, S, Luppino, MD, Leonore, M, de Wit, MS, Paul, F, Bouvy, MD et al. (2010). Overweight, obesity and depression: A systematic review and meta-analysis of longitudinal studies. Arch Gen Psychiatry.229-220:)3(67;2010 .doi:10.1001/archgenpsychiatry.2010.2.
7. Gatineau, M, Dent, M (2011). Obesity and mental health. National Obesity Observatory. SCIE Social Care [Online]
8. Rivenes, AC, Harvey, SB, Mykletun, A (2009). The relationship between abnormal fat, obesity and common mental disorders: Results from the HUNT study. Journal of Psychosomatic Research, 66(4): 269-275
9. Anstey, KJ, Cherbuin, N, Budge, M, and Young, J (2011). Body mass index in midlife and late-life as a risk factor for dementia: a meta-analysis of prospective studies. Obesity Reviews; 12(5):426-37.
10. Xu, WL, Atti, AR, Gatz, M, Pedersen, NL, Johansson, B, and Fratiglioni, L. Midlife overweight and obesity increase late-life dementia risk: a population-based twin study. Neurology; 76(18): 1568-74.
11. Loef, M and Walach, H. Midlife obesity and dementia: meta-analysis and adjusted forecast of dementia prevalence in the United States and China. Obesity; 21(1): 51-5.
12. Johnson, W, Li, L, Kuh, D, Hardy, R (2015) How Has the Age-Related Process of Overweight or Obesity Development Changed over Time? Coordinated Analyses of Individual Participant Data from Five United Kingdom Birth Cohorts. PLoS Med 12(5).
13. Arnold, M. et al. Overweight duration in older adults and cancer risk: a study of cohorts in Europe and the United States. Eur. J. Epidemiol. 31, 893–904 (2016).
14. Public Health England (2020). Excess Weight and COVID-19: Insights from new evidence. [online]
15. Gao, M et al (2021) Associations between body-mass index and COVID-19 severity in 6.9 million people in Edngland: a prospective, community-based cohort study. The Lancet, Diabetes and Endocrinology.
16. A Healthier Future: Scotland's Diet & Healthy Weight Delivery Plan, Edinburgh: Scottish Government, 2018.
17. Based on self-reported height and weight data.