Rural Payments and Inspections Division (RPID): customer satisfaction survey 2021
The RPID customer satisfaction survey was held throughout August and the first week of September and all RPID Single Application Form customers were included. The survey was entirely online and 2147 (14%) of customers completed the survey.
Customers' views on the SAF and submitting applications
SAF: schemes SAF schemes customers apply to applied to
Almost all (99%) of RPID's customers had submitted an SAF in the last 12 months.
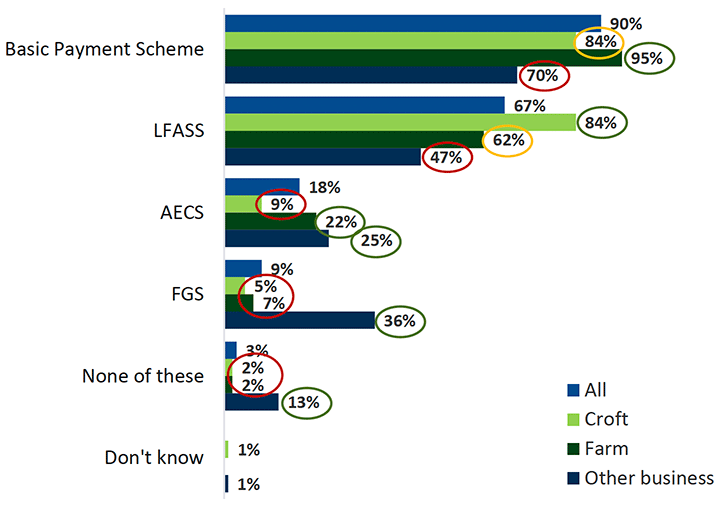
The Basic Payment Scheme was the most applied to scheme (90%), and the LFASS (67%) was also widely applied to.
There were several differences by business type, with:
- Farmers most likely to apply to the Basic Payment Scheme (95% vs. 70% of other businesses);
- Crofters most likely to apply to the LFASS (84% vs. 47% of other businesses); and
- Other businesses most likely to apply to the FGS (36% vs. 5% of farmers).
There were also differences by area office, with customers based in Kirkwall more likely than average to apply to each of the following:
- LFASS (96% vs. 67% on average); and
- AECS (49% vs. 18%).
Tenants (83%) were also more likely than owners (65%) to have applied to the LFASS.
In the 2013 survey, 59% applied to LFASS.
SQ3: In your most recent SAF, did you apply to any of the following…? Base (all who submitted an application): 2,030
SAF: support applying
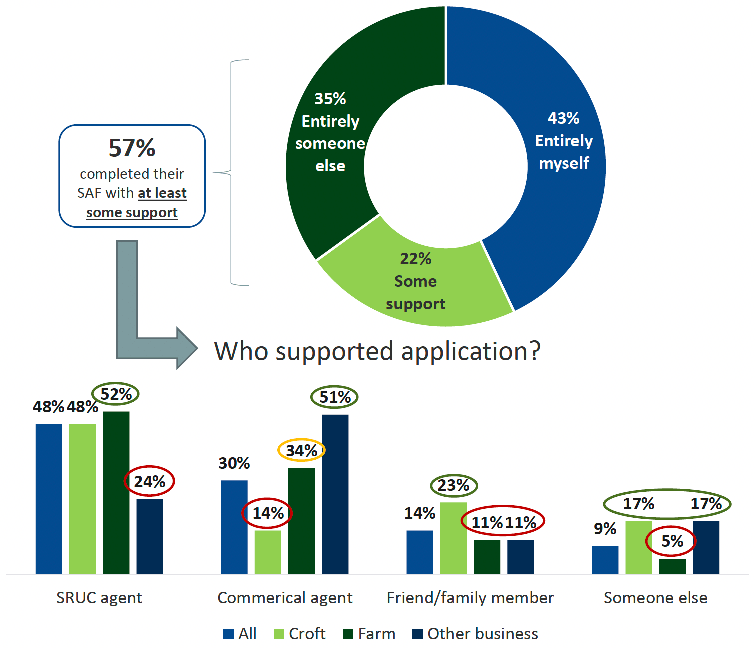
RPID customers were more likely to complete their SAF with at least some support (57%) than on their own (43%).
There were key differences by job role and business type in terms of customers who reported that someone had completed the application for them:
- Business partners (40%) and owners (36%) were more likely to report this than tenants (29%); and
- Farmers (40%) were more likely to report this than crofters (23%).
Customers were most likely to be supported by agents to complete their application, with SRUC agents being the most common (48%).
Commercial agents were more likely to be used by each of the following:
- Other businesses (51%) than crofts (14%);
- Business partners (36%) and owners (31%) than tenants (15%); and
- Younger (37%) than older (25%) customers.
SQ5: Which of the following best describes how you completed your most recent SAF? Base (all): 2,147
SQ6: Who supported you with your application? Base (all who had support completing application): 1,217
SAF: support applying
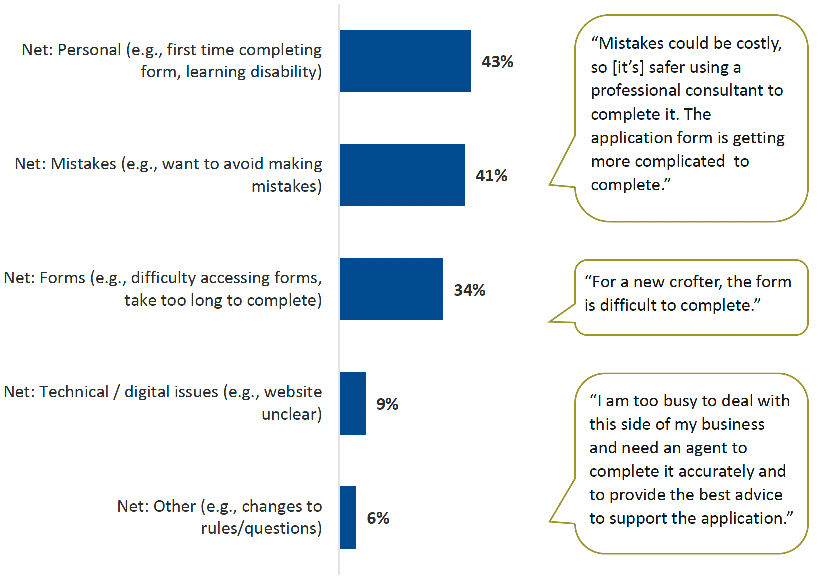
The chart provides a high-level summary of the themes customers reported as to why they needed support with their most recent SAF.
The reasons customers gave for needing support with their most recent SAF were varied, although two key themes emerged: personal reasons (43%) and avoiding mistakes (41%).
Personal reasons encompassed a range of factors including being new to the process of completing an SAF, lacking confidence to complete the forms, and having a disability which impacted their ability to understand how to complete the forms.
Avoiding mistakes encompassed two main factors: wanting to avoid the penalties for making mistakes; and wanting to doublecheck that the information customers had provided was correct.
Please note, this chart only shows the overarching summary codes emerging from this open-ended question. The full analysis is provided on the next slide.
SQ6a: Can you tell us the reasons why you needed some support with your most recent SAF? Base (all who gave a reason for needing support): 1,018
| Reasons support needed | % |
|---|---|
| NET: Personal | 43% |
| Leave it to a professional | 19% |
| Disability/tech literacy (respondent feels unable) | 10% |
| New to this/first time completing form | 7% |
| The way I've always done it | 6% |
| Lack of confidence (general) | 4% |
| Not familiar/only complete them once a year | 2% |
| Too busy to complete forms – generally | 2% |
| Too busy to complete forms in spring/busy time of year | 1% |
| NET: Mistakes | 41% |
| Want to avoid mistakes/double check it's correct (general) | 25% |
| Want to avoid the penalties for mistakes | 12% |
| Too important to make mistakes | 6% |
| NET: Forms | 34% |
| Forms difficult/unclear/complicated | 29% |
| My case is unique/complicated/not covered in form | 4% |
| Takes too long to complete forms | 3% |
| Difficulty accessing form (form unavailable) | 1% |
| NET: Technical/digital issues | 9% |
| Website/system unclear/complex | 4% |
| Technical issues (errors, crashes) | 3% |
| No/poor internet access | 2% |
| Don't trust/anxious about online | <1% |
| NET: Other | 6% |
| Changes to rules/questions | 5% |
| Issues relating to Covid | <1% |
| General concern re how much it costs to complete forms | <1% |
| Base (all who gave a reason) | 1,018 |
SQ6a: Can you tell us the reasons why you needed some support with your most recent SAF? Base (all who gave a reason for needing support): 1,018
SAF: other applications
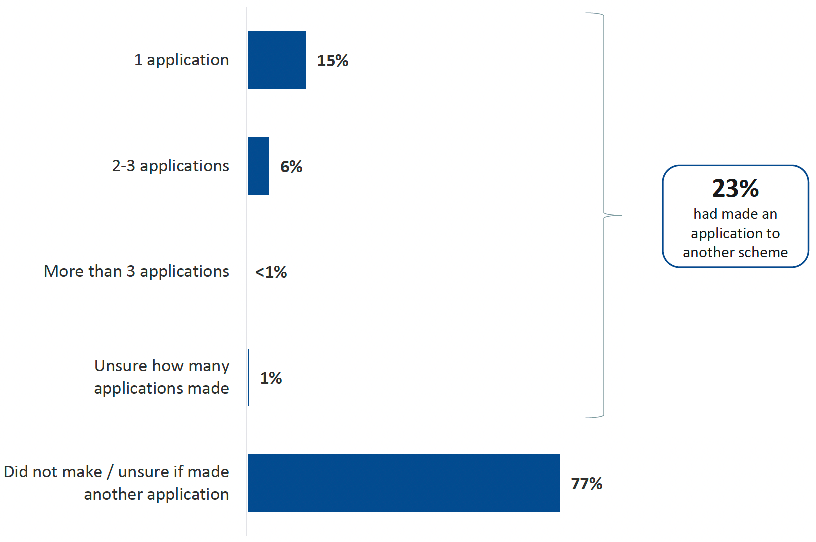
Around one quarter (23%) of RPID customers had made an application to another none-SAF scheme in the last 12 months. Virtually all of them applied to between one and three other schemes.
The following groups were more likely not to have made another application:
- Owners (80%) than tenants (74%) and business partners (70%);
- Other businesses (84%) and farms (79%) than crofts (73%);
- Older (84%) than younger (66%) customers; and
- Customers that completed their SAF with support (81%) than those that completed it on their own (74%).
In the 2013 survey, 37% applied to another scheme.
SQ7/8: How many applications to other schemes have you made in the last 12 months? Base (all): 2,147
SAF: online & paper applications
The vast majority (96%) of customers submitted their most recent SAF via an online application. This may have been on their own or with some support.
There were key differences by job role and business type, with the following groups more likely to submit an online application:
- Farmers (98%) vs. other businesses (95%) and crofters (94%); and
- Business partners (99%) vs. owners (96%).
Additionally, those who used face-to-face support from area offices to submit their applications were more likely to submit a paper application (4% vs. 1%).
It is worth noting that because nearly three in five (57%) customers completed their SAF with at least some support, we cannot say for certain that these figures reflect knowledge of actual completion method (although very few said they did not know). There were, however, few substantial differences in application method by whether customers received some or no support – although those who completed with some support were more likely to complete a paper application (5%, compared with 2% who completed on their own).
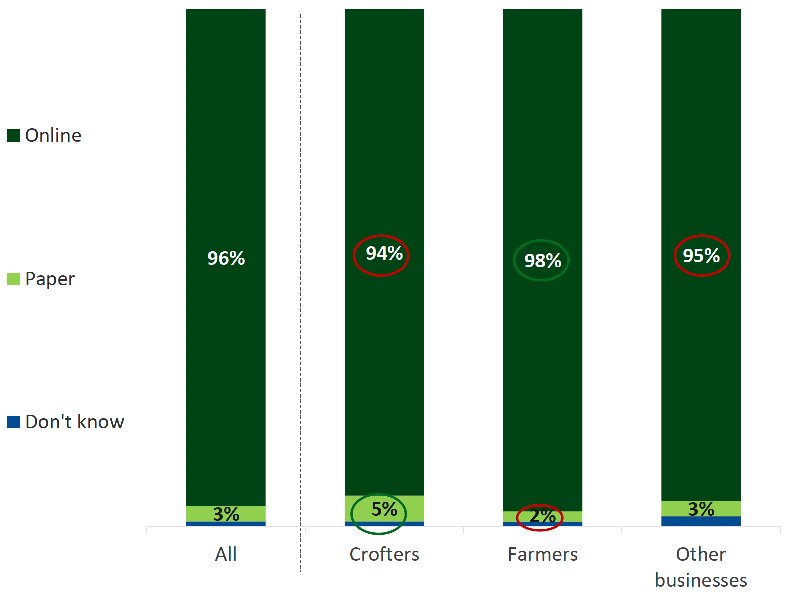
SQ4: For your most recent SAF, how was it submitted? Base (all who had submitted an application): 2,130.
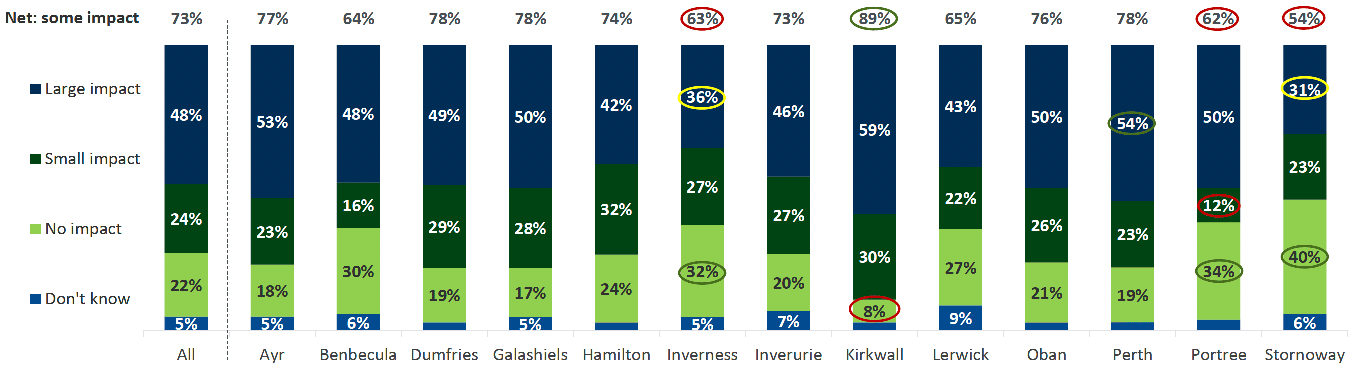
Despite the high proportion of customers that submit their SAF online, quality of broadband had at least some impact on three in four (73%) customers, and it was more likely to have a big (48%) than small (24%) impact.
There were key differences by area office, with customers in Kirkwall (89%) more likely than average – and customers in Stornoway (54%), Portree (62%) and Inverness (63%) less likely than average – to report that broadband quality somewhat impacted their ability to submit their RPID applications online.
Q21. How, if at all, does the quality of broadband/internet service in your area affect your ability to complete RPID applications online? Base (all who submitted online application): 2,054
NB: only significant differences vs. average are shown on this chart. White circles are used to highlight significant differences instead of red circles due to the colour of the bars.
Satisfaction with online applications
Customers were most likely to agree (62%) that information provided on the Rural Payments and Services online system is accurate.
They were, however, more likely to agree (39%) than disagree (31%) that they have difficulties finding their way around the website.
Differences by business type and job role were common. Farmers and crofters were more likely to agree that:
- Information provided on Rural Payments and Services is accurate (64% and 61%, compared with 49% of other businesses);
- Rural Payments and Services looks and feels well designed (43% and 39%, compared with 49%).
Similarly, business partners were more likely to agree that:
- Information provided on Rural Payments and Services is accurate (70%, compared with 60% of owners);
- Rural Payments and Services looks and feels well designed (47%, compared with 40%).
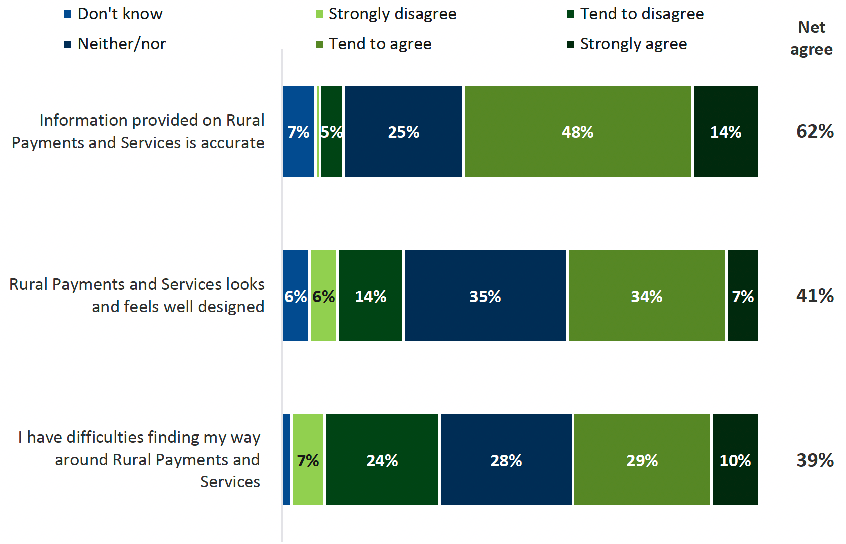
Q20: Thinking about your experience of using the Rural Payments and Services online system, to what extent do you agree or disagree with the following statements? Base (all who submitted application online): 2,054
Submitting paper applications
Of the minority (3%) of customers that submitted their SAF as a paper application, this was more likely to be because they were sent a paper application (47%), than not being confident using the internet (38%), or broadband being poor quality in their area (35%).
This would suggest that some paper applicants would be able to make the transition to online applications.
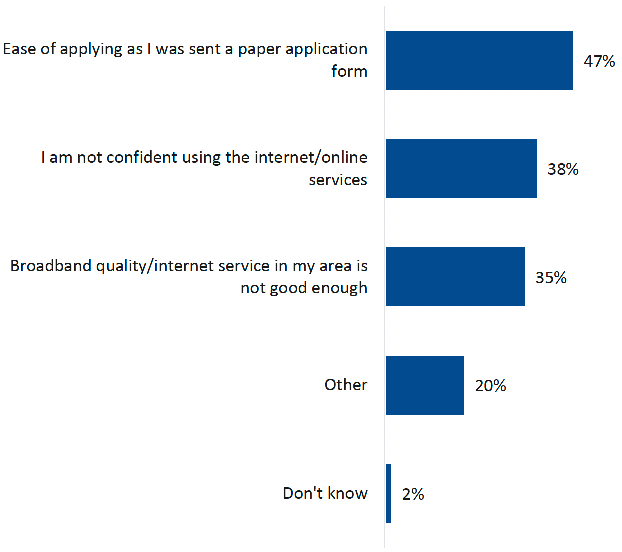
Q22: Which, if any, of the following are reasons for completing the application on paper rather than online? Base (all who submitted paper application): 55
Contact
Email: marcus.mackenzie@gov.scot