Rural Payments and Inspections Division (RPID): customer satisfaction survey 2021
The RPID customer satisfaction survey was held throughout August and the first week of September and all RPID Single Application Form customers were included. The survey was entirely online and 2147 (14%) of customers completed the survey.
Sample profiles
Sample profile: Business type & job role
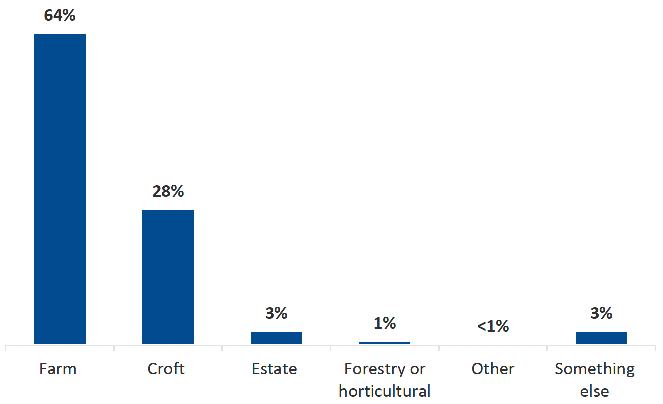
SQ9: Moving on slightly, which of the following best describes your organisation/business? Base (all): 2,147
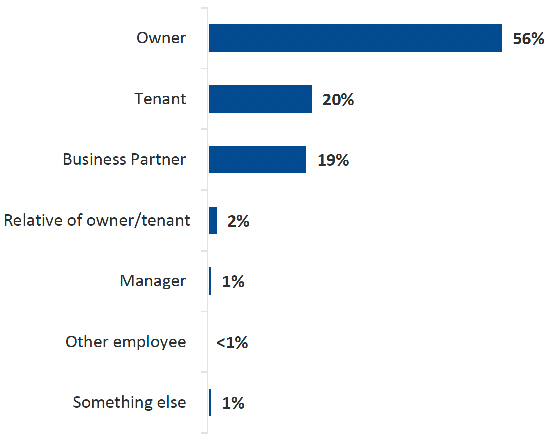
SQ11: And which of the following best describes your main role or job title in your organisation/business? Base (those working in farms/crofts/forestry or agriculture): 2,002
Sample profile: Job role by business type
The table below shows the proportion of customers in each job role, broken down by business type.
It shows that customers working on farms were significantly more likely than those working on crofts to be:
- Owners (59% vs. 49% of crofters);
- Business partners (25% vs. 43%); and
- Managers (2% vs. none).
On the other hand, customers working on crofts were more likely than farmers to be tenants (43% and 11%, respectively).
| All | Croft | Farm | Forestry and horticultural business | |
|---|---|---|---|---|
| Owner | 1,128 | 296 | 817 | 15 |
| 56% | 49% | 59% | 68% | |
| Tenant | 404 | 255 | 149 | - |
| 20% | 43% | 11% | - | |
| Business partner | 380 | 36 | 341 | 3 |
| 19% | 6% | 25% | 14% | |
| Manager | 29 | - | 26 | 3 |
| 1% | - | 2% | 14% | |
| Relative to farm owner / tenant | 43 | 8 | 35 | - |
| 2% | 1% | 3% | - | |
| Other | 18 | 5 | 12 | 1 |
| 1% | 1% | 1% | 5% |
Sample profile: Produce type
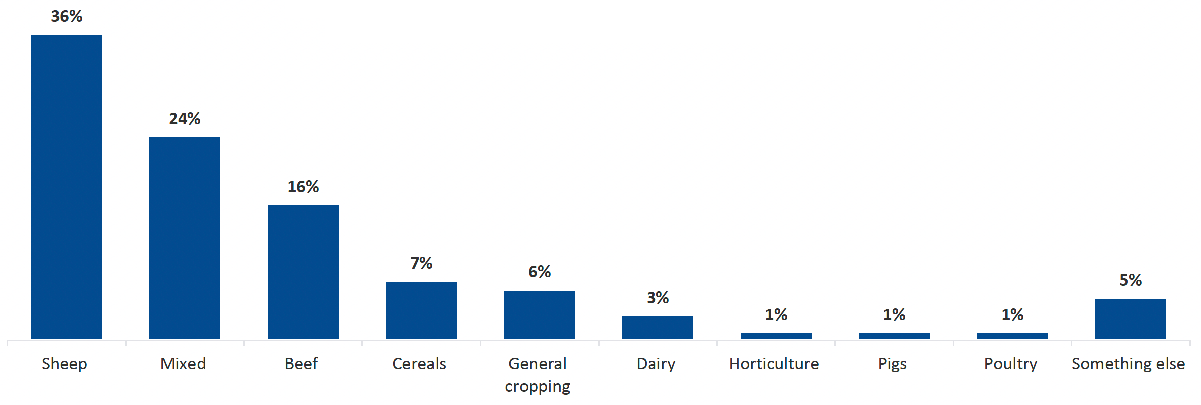
SQ10: And which of the following best describes what you produce? Base (those working in farms/crofts/forestry or agriculture): 2,002
Sample profile: Personal demographics
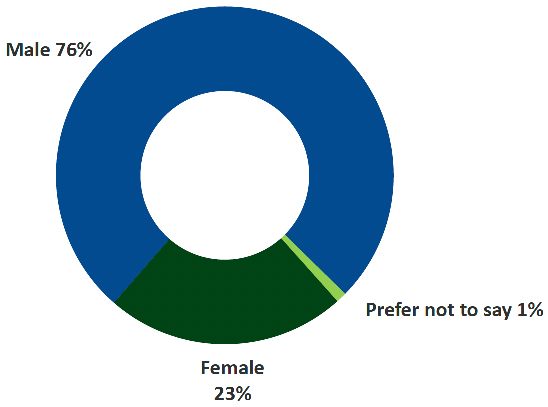
SQ12. Please select the option that applies to you.
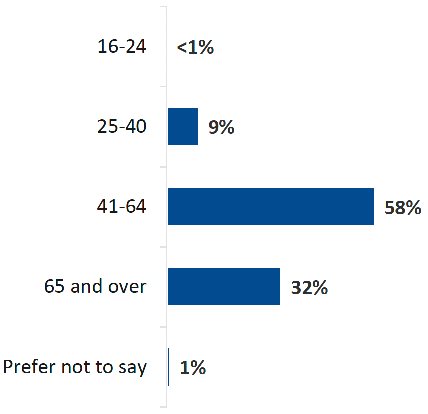
SQ13: Which of the following age groups applies to you? Base (all): 2,147
Sample profile: Age by gender
The table below shows the proportion of customers in each age group, broken down by gender.
As shown here, the age profile was broadly similar for men and women, although men were slightly more likely to be over the age of 64 (33%, compared to 29% of women).
| Age | All | Male | Female |
|---|---|---|---|
| 16-24 | 6 | 3 | 3 |
| 0% | 0% | 1% | |
| 25-40 | 184 | 132 | 52 |
| 9% | 8% | 11% | |
| 41-64 | 1,249 | 948 | 291 |
| 58% | 58% | 59% | |
| 65 and over | 686 | 545 | 140 |
| 32% | 33% | 29% |
Sample profile: Age and gender by business type
The table below shows the proportion of customers in each gender and age group, broken down by business type.
It shows key differences by gender, with crofters more likely to be female (26% vs. 21% of farmers) and farmers more likely to be male (78% vs. 73% of crofters).
A greater proportion of farmers than crofters fell into the 41-64 age bracket (61% vs. 54%), with representation in the other age brackets broadly similar for farmers and crofters.
| All | Croft | Farm | Forestry and horticultural business | |
|---|---|---|---|---|
| Gender | ||||
| Male | 1,632 | 436 | 1,074 | 122 |
| 76% | 73% | 78% | 73% | |
| Female | 490 | 155 | 295 | 40 |
| 23% | 26% | 21% | 24% | |
| Age | ||||
| 16-24 | 6 | 2 | 4 | - |
| 0% | 0% | 0% | - | |
| 25-40 | 184 | 62 | 107 | 15 |
| 9% | 10% | 8% | 9% | |
| 41-64 | 1,249 | 322 | 837 | 90 |
| 58% | 54% | 61% | 54% | |
| 65 and over | 686 | 206 | 422 | 58 |
| 32% | 34% | 31% | 35% | |
Sample profile RPID area
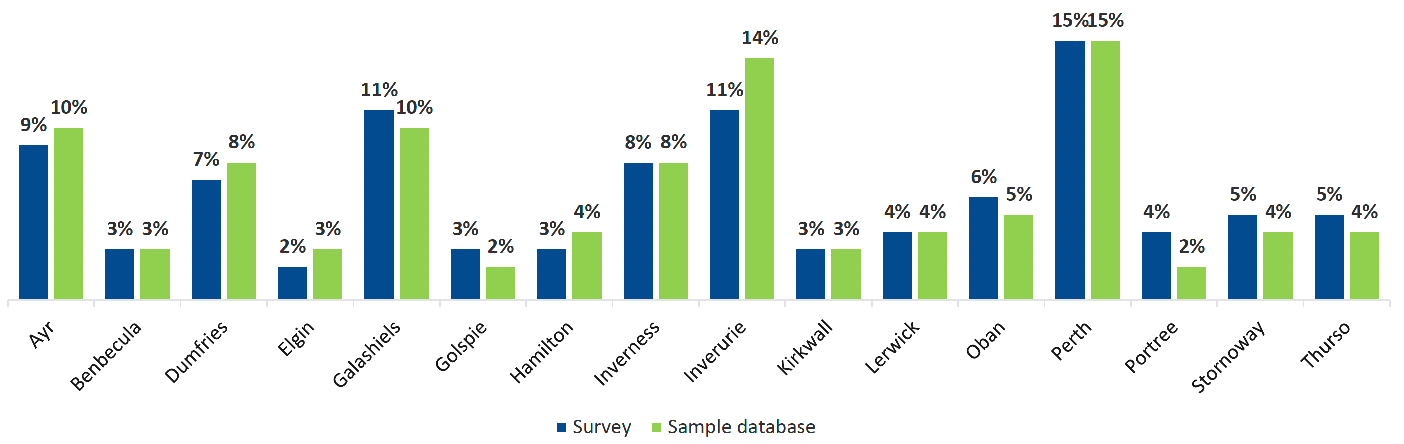
Area office: sample vs. survey. Base (all): 2,147
Contact
Email: marcus.mackenzie@gov.scot