Marine economic statistics 2017: corrected April 2020
Statistics on economic contributions of Scotland’s marine sectors present a time series of Gross Value Added (GVA), turnover and employment for industrial categories defined as part of the marine sector. This publication was originally published in October 2019 and was corrected in April 2020.
Part of
2. Marine Economy Overview
2.1 Marine Economic Key Points
In 2017, the Scottish marine economy generated £5.1 billion in GVA: accounting for 3.9% of the overall Scottish economy. The Scottish marine economy provided employment for 74,500 people (headcount), contributing 3.0% of the total Scottish employment.
The oil and gas services sector is the biggest contributor to the marine economy in terms of turnover and GVA. However, marine tourism employs the most people of all the sectors covered in this report. Oil and gas services provide 42% of the marine economy GVA and 24% of the employment while marine tourism provides 12% of the GVA and 38% of the employment (see Table 1 and Figure 1).
There are considerable variations in labour productivity (GVA per worker) across the marine economy, with Aquaculture having the highest GVA per worker in 2017 (£158,000), and marine tourism producing the lowest at £21,000. In 2016, freight water transport had produced the highest GVA per employee.
Oil and gas extraction is not included in these figures, although support services for oil and gas are included. This broadly aligns the figures with those provided by the onshore values in the National Accounts for Scotland.
| Description | GVA £M |
Turnover £M |
Employment Headcount '000s |
GVA Per Head £ |
|---|---|---|---|---|
| Fishing | 316 | 582 | 4.8 | 65,873 |
| Aquaculture | 354 | 1,087 | 2.2 | 157,697 |
| Support for oil & gas | 2,176 | 4,492 | 17.8 | 122,264 |
| Processing | 392 | 1,790 | 7.7 | 50,922 |
| Ship building | 572 | 1,561 | 7.7 | 74,221 |
| Construction & water transport services | 591 | 722 | 4.3 | 137,326 |
| Passenger water transport | 90 | 200 | 1.1 | 81,545 |
| Freight water transport | 45 | 118 | 0.5 | 90,000 |
| Renting & leasing of water transport equipment | 11 | 18 | 0.1 | 106,000 |
| Marine Tourism | 594 | 1,018 | 28.3 | 20,989 |
| 5,140 | 11,587 | 74.5 | 68,949 |
1 Figures corrected on 15th April 2020, for more information see Annex B section 17.11
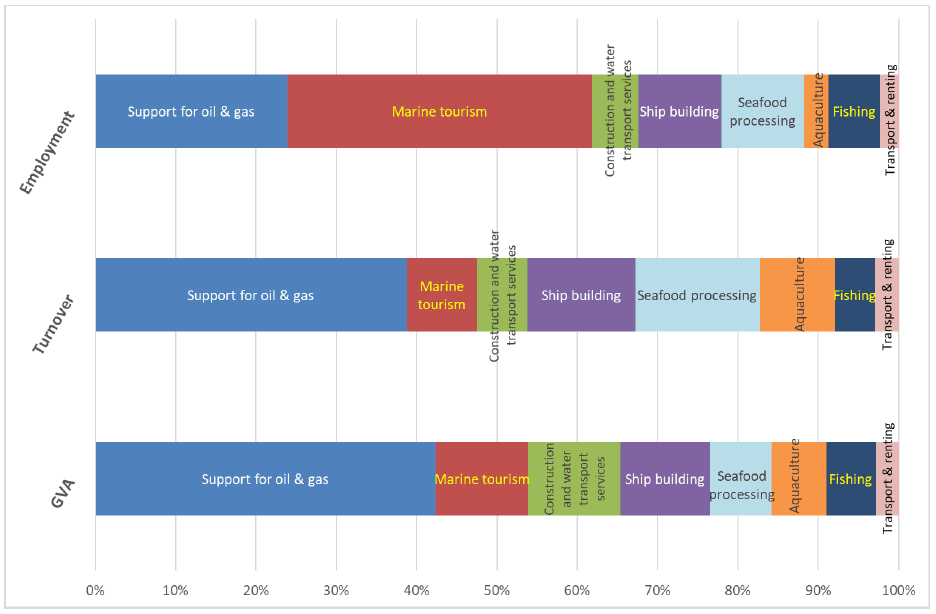
Sectors ranked in order of size (GVA)
Sea and coastal freight and passenger transport and Renting and leasing of water transport equipment have been combined to make the chart more readable.
2.2 Marine Economy Trends
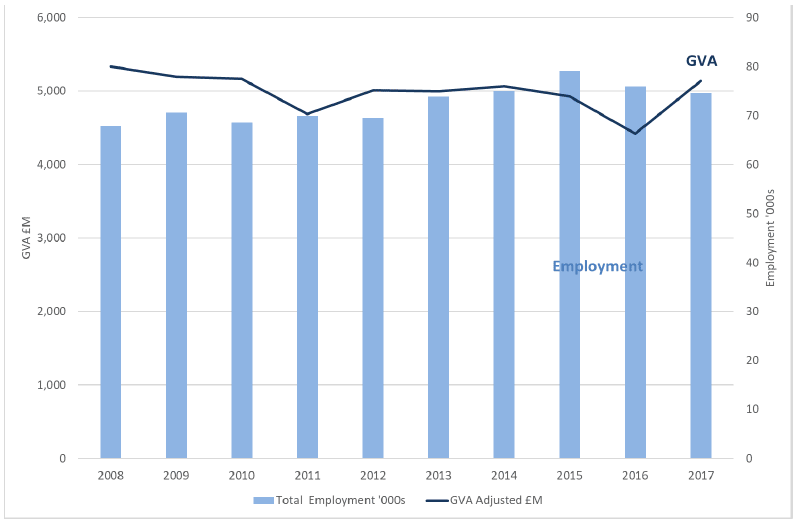
Between 2016 to 2017 the marine economy's GVA increased by 16% from £4.42 billion to £5.14 billion (2017 prices). Employment fell by 2%.
| Year | GVA £M |
Turnover £M |
Employment '000s |
|---|---|---|---|
| 2008* | 5,332 | 12,237 | 67.9 |
| 2009* | 5,192 | 13,613 | 70.6 |
| 2010* | 5,167 | 12,623 | 68.5 |
| 2011 | 4,693 | 12,574 | 69.9 |
| 2012 | 5,015 | 12,993 | 69.5 |
| 2013 | 5,001 | 13,523 | 73.9 |
| 2014 | 5,069 | 14,216 | 75.0 |
| 2015 | 4,928 | 13,800 | 79.1 |
| 2016 | 4,421 | 10,814 | 76.0 |
| 2017 | 5,140 | 11,587 | 74.5 |
1 Figures corrected on 15th April 2020, for more information see Annex B section 17.11.
* SABS categories for oil and gas services changed in 2011 see Annex B section 17.7.
The longer term trend shows that between 2008 and 2017 the marine economy GVA (adjusted to 2017 prices) fell by 4% while employment increased by 10%.
1 Figures corrected on 15th April 2020, for more information see Annex B section 17.11
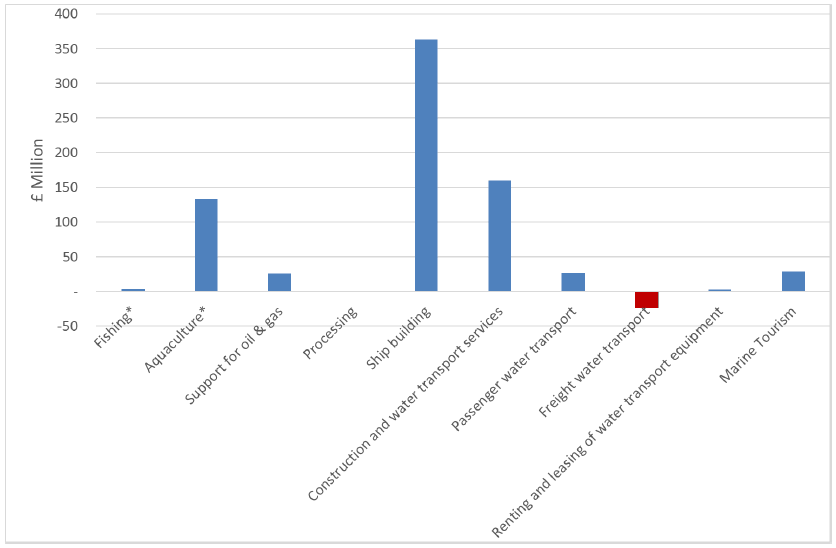
The change in GVA from 2016 to 2017 is shown in Figure 3. The figures for the marine economy by industry are shown in Table 19.
1 Figures corrected on 15th April 2020, for more information see Annex B section 17.11
2.3 Marine Economy by geography
The values presented at local authority level are mostly based on SABS data. Most values can be provided by local authority, though some become disclosive at this level and are aggregated into the 'unallocated' category. The methodology for combining values from the different sources is detailed in Annex B: Methodology and source data.
| Local authority | GVA £M |
Turnover £M |
Employment 000's |
% of Scotland | ||
|---|---|---|---|---|---|---|
| GVA | Turnover | Employment | ||||
| Aberdeen City | 2,039 | 3,867 | 16.9 | 39% | 34% | 24% |
| Aberdeenshire | 951 | 2,152 | 9.8 | 18% | 19% | 14% |
| Angus | 73 | 86 | 1.1 | 1% | 1% | 1% |
| Argyll & Bute | 135 | 332 | 5.2 | 3% | 3% | 7% |
| City Of Edinburgh | 35 | 102 | 1.4 | 1% | 1% | 2% |
| Clackmannanshire | 1 | 2 | 0.0 | 0% | 0% | 0% |
| Dumfries & Galloway | 104 | 258 | 2.8 | 2% | 2% | 4% |
| Dundee City | 16 | 23 | 0.4 | 0% | 0% | 1% |
| East Ayrshire | * | * | * | |||
| East Dunbartonshire | * | * | * | |||
| East Lothian | 34 | 65 | 1.3 | 1% | 1% | 2% |
| East Renfrewshire | * | * | * | |||
| Falkirk | * | * | 0.7 | 1% | ||
| Fife | 141 | 531 | 4.7 | 3% | 5% | 7% |
| Glasgow City | 268 | * | 4.4 | 5% | 6% | |
| Highland | 257 | 625 | 8.9 | 5% | 5% | 12% |
| Inverclyde | 124 | 164 | 1.2 | 2% | 1% | 2% |
| Midlothian | * | * | * | |||
| Moray | 25 | 49 | 0.9 | 0% | 0% | 1% |
| Na H-Eileanan Siar | 44 | 125 | 1.4 | 1% | 1% | 2% |
| North Ayrshire | 61 | 104 | 1.5 | 1% | 1% | 2% |
| North Lanarkshire | 13 | * | 0.2 | 0% | 0% | |
| Orkney Islands | 35 | 68 | 1.3 | 1% | 1% | 2% |
| Perth & Kinross | 3 | 22 | 0.3 | 0% | 0% | 0% |
| Renfrewshire | 31 | 58 | 1.6 | 1% | 1% | 2% |
| Scottish Borders | 27 | 6 | 1.2 | 1% | 0% | 2% |
| Shetland Islands | 167 | 314 | 2.1 | 3% | 3% | 3% |
| South Ayrshire | 42 | 72 | 1.2 | 1% | 1% | 2% |
| South Lanarkshire | 12 | * | * | 0% | ||
| Stirling | 15 | 24 | 0.7 | 0% | 0% | 1% |
| West Dunbartonshire | 8 | 17 | 0.3 | 0% | 0% | 0% |
| West Lothian | 3 | 7 | 0.1 | 0% | 0% | 0% |
| Unallocated | 477 | 2,514 | 3.1 | 9% | 22% | 4% |
| Scotland | 5,140 | 11,587 | 74.5 | 100% | 100% | 100% |
* = disclosive data
1 Figures corrected on 15th April 2020, for more information see Annex B section 17.11
Scottish Government (Marine Scotland) 2019
Contains National Statistics data ©
Crown copyright and database right
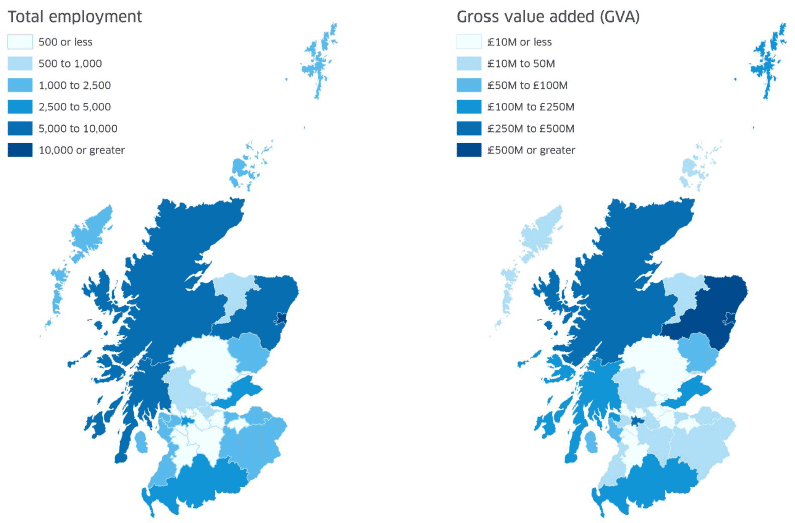
Aberdeen City accounted for over £2 billion (40%) of the marine economy's GVA for 2017, with Aberdeenshire the next highest with £951 million (19%). Glasgow City and Highland both contributed 5% of the marine GVA in 2017, while Highland contributed 12% of the employment and Glasgow City contributed 6%.
The biggest change in GVA from 2016 to 2017 was in the City of Glasgow which reported a negative GVA for 2016, but increased to £268 million in 2017. This is likely to be due to the spasmodic nature of ship building and maintenance, and reflects the dominance of the industry in Glasgow's marine economy. This is discussed in more detail in the Shipbuilding chapter.
Contact
Email: Venetia.Haynes@gov.scot