Scotland's Fiscal Outlook: The Scottish Government's Medium-Term Financial Strategy
This is the fifth Medium-Term Financial Strategy (MTFS) published by the Scottish Government and provides the context for the Scottish Budget and the Scottish Parliament. This context will also frame the Resource Spending Review.
Annex A: Regional and Sectoral trends across the Scottish and rUK Income Tax bases
Income Tax devolution in Scotland has only been in operation since 2017-18. During that time, several policy changes have been made, most notably in 2018-19 with the introduction of a five-band system and changes to the rates and thresholds that Income Tax is paid at.
The Scottish Income Tax Policy Evaluation published in December 2021 showed clear evidence that these policy changes have boosted overall Scottish Income Tax revenues.
However, the overall impact on Scotland's Budget is determined by the growth rate of non-savings non dividend (NSND) Income Tax revenue per person relative to the rest of the UK since 2016-17. If tax revenue per person grows faster in Scotland than in the rUK then the Scottish Budget position improves. Conversely, if revenue per person grows faster in the rUK than in Scotland, the Scottish Budget position worsens.
The latest outturn data, which covers 2019-20, shows that Income Tax devolution has benefited the Scottish Budget to date, in large part because of revenue raising policy reforms introduced since 2017-18. However, based on the latest forecasts from the SFC and OBR, future Income Tax revenue per capita is expected to grow faster in the rUK than in Scotland, to the detriment of the Scottish Budget. This annex explores the reasons behind this slower tax revenue growth in Scotland, building on analysis in previous MTFS documents.[28]
Though many factors will influence the relative growth in tax revenue, the evidence available suggests that recent faster growth of tax revenues and earnings in rUK relative to Scotland appears to be at least partially driven by strong earnings growth in London and the South East of England, particularly amongst high earning taxpayers in the Financial and Insurance services sector. There is also evidence that the relative position is also impacted by slower tax and earnings growth in the North East of Scotland – historically one of Scotland's most tax-rich regions – since 2015-16, linked to changes in oil and gas price.
Trends in tax revenue per taxpayer across UK nations & regions
As shown in figure A1 below, the average level of Income Tax revenue raised per taxpayer (including on savings and dividends)[29] has been consistently higher in England than in Scotland, Wales and Northern Ireland.
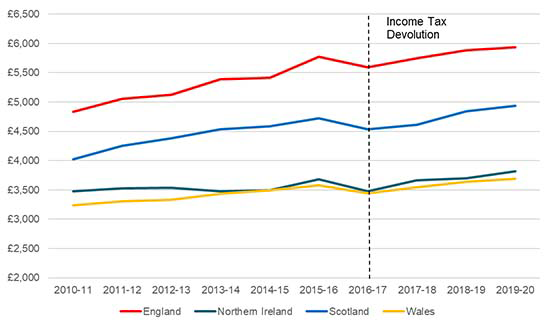
Source: SG analysis of Survey of Personal Income Statistics
However, this aggregated picture masks significant regional variation within England. In particular, London and the surrounding areas of the South East and East of England (which cumulatively account for around a third of the UK population) have significantly higher average levels of Income Tax revenue per taxpayer relative to elsewhere in the UK. When London and surrounding regions are excluded, Scotland has consistently raised more income tax revenue per taxpayer than other regions of the UK.
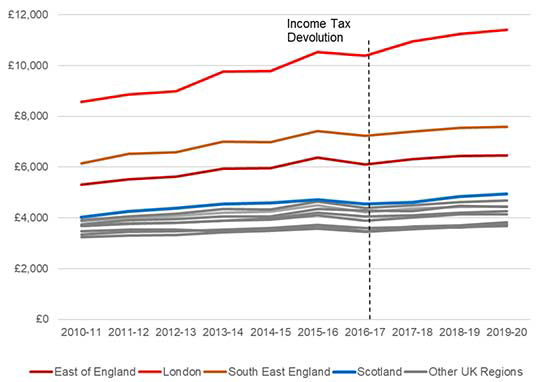
Source: SG analysis of Survey of Personal Income Statistics
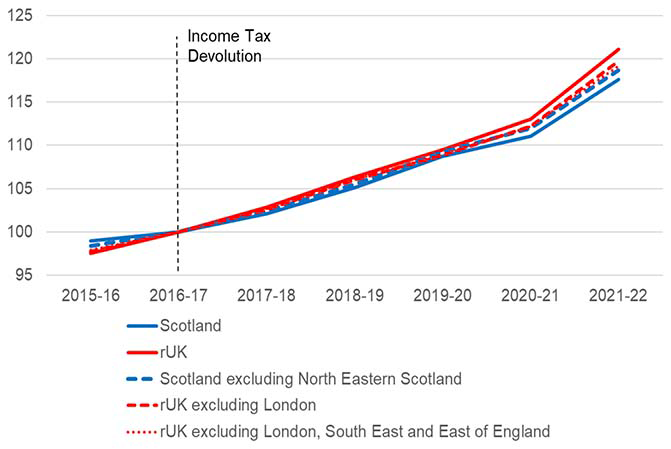
As noted previously, it is the relative growth, rather than the relative level of tax raised that determines the Scottish Budget position. The Scottish Budget is affected by the relative growth in per person revenue since income tax powers were devolved in 2016-17. Figure A3 below shows that Scotland initially grew its tax revenues per taxpayer faster than the rUK, before experiencing weaker growth in 2015-16 to 2017-18. Scotland then had a relatively strong year in 2018-19 (when significant revenue raising policies were introduced).
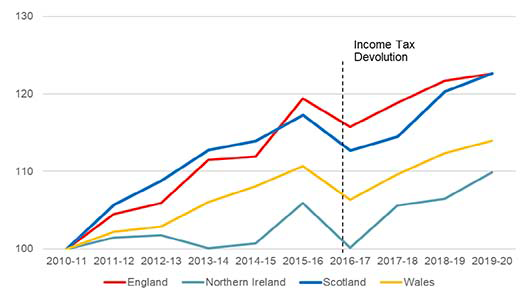
Source: SG analysis of Survey of Personal Income Statistics
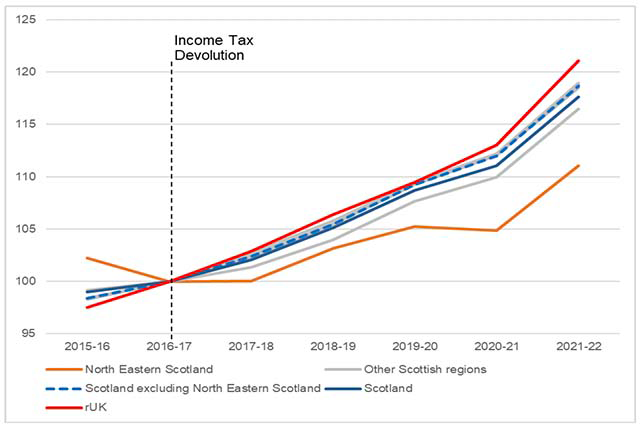
Looking at a further regional breakdown of the data in Scotland can help identify whether any particular trends over time are relatively widespread across the Scottish economy, or instead if there is evidence that one specific region has had a disproportionate impact on the national performance. As can be seen in Figure A4 below, there is evidence that most of the Scottish regions followed a broadly similar trend over time, with the exception of the North East which was a clear outlier in the early half of the decade.
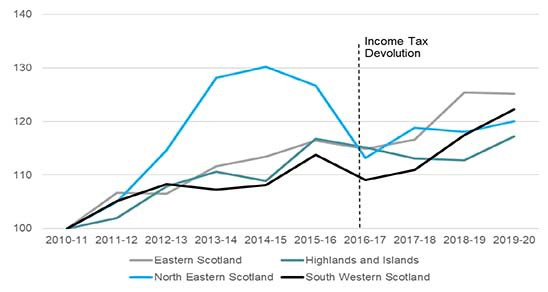
Source: SG analysis of Survey of Personal Income Statistics
The economic performance of the North East is heavily linked to the oil and gas sector in terms of firms working directly in the North Sea, but also via the significant onshore manufacturing and production supply chains and the wider economic spillovers into the regional economy. It is likely that the North East's strong performance before 2015-16 and then weaker performance after this is linked to oil and gas price fluctuations across the last decade, as can be seen in Figure A5.
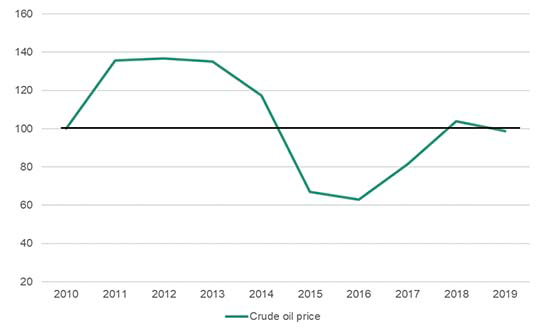
Source: Oil and Petroleum Products Monthly Statistics, UK Gov [30]
Despite accounting for a relatively small proportion of overall taxpayers, there is evidence that the exceptional tax revenue growth witnessed in the region during the periods of high oil price, had a disproportionate effect on the Scottish tax base. In total, from 2010-11 to 2014-15, the North East of Scotland boosted the cumulative tax revenue per taxpayer growth in Scotland by around 3%.
Although relative changes in tax growth prior to 2016-17 do not impact the Scottish Budget position today, they demonstrate how fluctuations in a tax rich region such as the North East can disproportionately affect Income Tax receipt growth for Scotland as a whole.
The Survey of Personal Incomes (SPI) data referred to above provides evidence of the drivers of Scotland's Income Tax performance relative to the rUK, but a limitation is that it only covers up to 2019-20. It therefore excludes more recent performance, including the impact of the COVID-19 pandemic.
More recent evidence can be seen in the Real Time Information (RTI) Earnings and Employment data jointly published by HMRC and the ONS, based on earnings for employees who pay tax via the pay-as-you-earn (PAYE) system across the UK.[31] Although this data covers earnings, rather than Income Tax revenues or liabilities, it is much more timely, being released monthly, with the latest release at the time of writing covering March 2022.
This data also heavily informs the SFC's Income Tax forecasts. Although average earnings growth isn't a perfect predictor of Income Tax receipt growth (due to the progressive nature of the tax system, and the disproportionate impact a relative small number of taxpayers at the very top of the income distribution can have) it is generally still an important factor in how the overall tax base is performing.
As can be seen in Figure A6 below, the RTI data shows that the level of average earnings has grown slower in Scotland relative to rUK since Income Tax devolution in 2016-17. However, the data also suggests that the continued impact of slower earnings growth in the North East accounts for a significant part of this.
For example, since July 2014, the North East of Scotland alone – which accounts for 9.4% of employees in the whole of Scotland–was responsible for around a third of the average earnings gap between Scotland and the rUK.
However, since December 2019, the North East has only explained 20% of the cumulative gap in average earnings growth between Scotland and rUK.
Source: SG analysis of earnings and employment from PAYE RTI
The performance of the North East is therefore important, but only offers a partial explanation of the gap in relative average earnings performance between Scottish and rUK earnings over time. Figure A.7 below shows that amongst the English regions, Income Tax revenue per taxpayer growth in London (and the key London commuter belt in the East and South East) has been significantly higher across the past decade, particularly since 2016-17 when Income Tax devolution occurred.
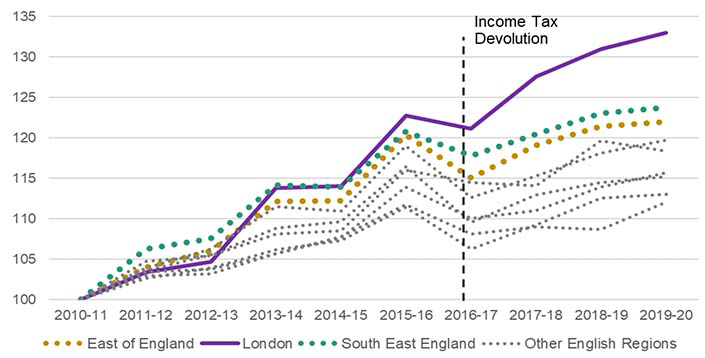
Source: SG analysis Survey of Personal Income Statistics 2019-20
When comparing to the rUK, there is evidence that Scotland's average level of tax per taxpayer across the decade has cumulatively grown faster than that of the rUK by 2019-20 (albeit only by 0.3%, and likely significantly aided in the policy decisions made by the Scottish Government in 2018-19). However, the cumulative gap in tax raised per taxpayer relative to the rUK would have been higher at 3.5% excluding London; and 6.8% excluding London and the East and South East of England.
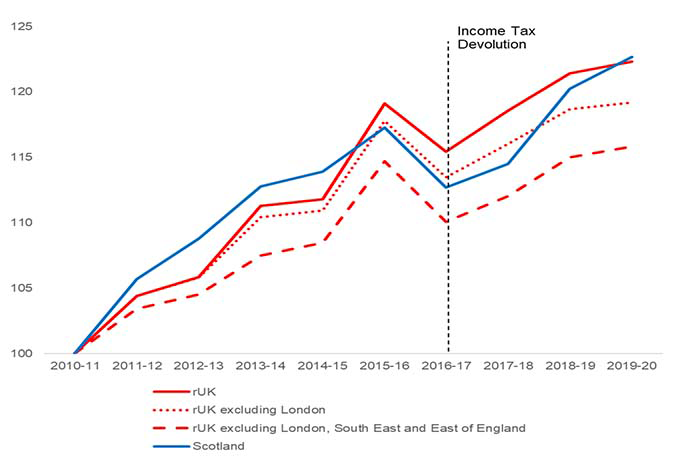
Source: SG analysis Survey of Personal Income Statistics 2019-20
This evidence suggests that London and the surrounding regions are having a major impact on rUK revenue growth, comparable to the disproportionate influence the North East has had on Scottish revenue growth.
There is also further evidence using the RTI earnings data. When London and the surrounding regions are excluded from the rUK, and the North east is excluded from Scotland, this eliminates most of the gap in average earnings growth between Scotland and rUK since 2016-17. This suggests that post-income tax devolution earnings growth has been similar across most of Scotland and rUK, with the North East of Scotland and London explaining the majority of the earnings divergence seen in the data.
Source: SG analysis of ONS earnings and employment from PAYE RTI
Understanding the link between inequality and tax revenue performance
Due to the progressive nature of the tax system, a relatively small number of taxpayers at the very top of the income distribution can have a disproportionate impact on both the amount of tax revenue raised in any one year and how overall tax revenue can grow from year to year.
The Institute for Fiscal Studies (IFS) has published various pieces of research exploring this dynamic. A recent study noted that 34% of total Income tax revenue across the UK in 2018-19 was paid for by the top earning 1% of taxpayers, with a further 34% paid for by those in the top 10% to 2% earning percentiles.[33]
It also found that the top 1% of wage earners disproportionately work in the financial sector and are heavily geographically concentrated in London (which has around 40% of the UK's top 1% taxpayers), with a separate paper[34] by the IFS also noting that this geographical clustering in London has increased in intensity since 2000-01. They also found that in Scotland, only Aberdeen had the same density of top 1% taxpayers as some of the areas of London and the South East.
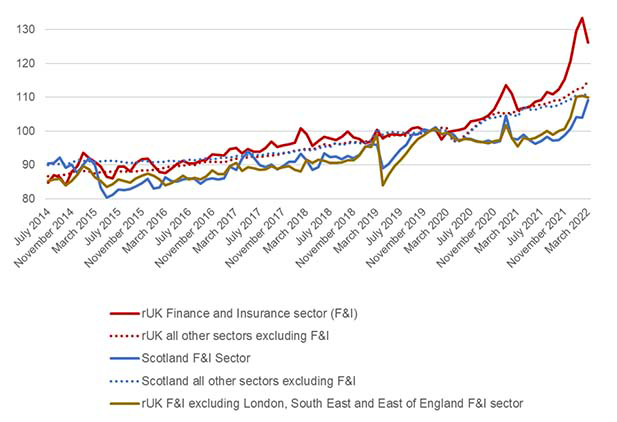
The RTI earnings data we have available also allows us to explore London's strong earnings performance. Analysing the sectoral trends in the London data suggests that the Finance and Insurance sector has had significantly higher earnings growth than other sectors in both Scotland and the rUK. This is particularly the case in the 2021 calendar year, where – as observed recently by the IFS[35] – Financial and Insurance sector pay growth has substantially outstripped the average of all other sectors, with much of that growth disproportionately concentrated in London.
For example, by the end of 2021, average earnings had grown by 14.8 percentage points more in the rUK Finance and Insurance sector than in the Scottish Finance and Insurance sector since December 2019. However, this is again almost entirely driven by London, the East and South East of England. As can be seen in Figure A.10 below, when they are excluded, the difference between average earnings growth in the Scottish and rUK Financial and Insurance sectors largely disappears.
Source: SG analysis of earnings and employment from PAYE RTI
There is also evidence that the London Finance and Insurance sector has a disproportionate impact on the average earnings growth across the entire rUK economy. For example, since the beginning of Income Tax devolution in April 2016, the Finance and Insurance sector in London, the South East and East of England alone – which accounts for only 2.1% of employees in the whole of the rUK – was responsible for 10% of the average earnings gap between Scotland and the rUK. The effect of this sector has been even stronger in past two years, explaining 29% of the average earnings gap between Scotland and rUK since December 2019.
As shown in figure A.9 previously, taken together the average earnings growth in the North East of Scotland and London and its surrounding regions appears to explain most of the recent gap in Scottish and rUK average earnings growth. Since income tax devolution in April 2016, the growth in these regions explains around two thirds of the gap that has emerged in average earnings growth. In more recent data, the impact is even greater, at just over two-fifths of the gap since December 2019. As noted above, there is evidence that a significant amount of this has been driven by the Finance and Insurance sector alone.
When tax data becomes available, we could see the strong growth in the Financial and Insurance sector earnings having a disproportionate impact on rUK tax revenues. Due to the progressive nature of the income tax system, higher paid individuals pay a greater share of their total income in tax. Given the evidence examined in this annex, there is a risk that strong earnings growth in highly paid professions in London and the South East and East of England could disproportionately drive strong growth in per capita rUK tax revenue, which would in turn hurt Scotland's budget position via the current fiscal framework.
Conclusion
This annex has used publicly available tax and earnings data over the last decade to examine regional and sectoral trends in Scotland and the rUK.
Although there are various factors that influence the relative growth in income tax revenue between Scotland and rUK, there is evidence that the influence of individual sectors and regions of the Scottish and rUK economies have had, and could continue to have, a disproportionate impact on the performance of the relative tax bases over time.
There is also increasing evidence that, due to the progressive nature of the tax system and the disproportionate influence a relatively small number of taxpayers in Scotland and the rUK can have, understanding and monitoring particularly high earning sectors such as the Oil and Gas industry, or Finance, is important in explaining the relative performance of the Scottish and rUK tax bases.
There is evidence that post-Income Tax devolution differences in the growth rates of income tax paid per taxpayer (up to 2019-20) and average PAYE earnings growth (up to 2022) between Scotland and rUK can be attributed to a relative weakness in the North East of Scotland, contrasted with a strong earnings performance in London and the East and South East of England. This evidence is corroborated by the Scottish Fiscal Commission analysis in Box 3.2 of the May 2022 Forecast Evaluation Report, which will be published alongside this MTFS.
Contact
Email: sophie.osborn@gov.scot