Rural Scotland Business Panel survey: report
This report presents findings from the first Rural Scotland Business Panel survey carried out in October/November 2021.
1. Introduction
The Rural Business Panel Survey
The Rural Scotland Business Panel was established to measure and monitor the economic health of rural Scotland through capturing the experiences and opinions of rural businesses and social enterprises. It was commissioned through a partnership of the Scottish Government, Highlands and Islands Enterprise (HIE) and South of Scotland Enterprise (SOSE).
This report presents the findings from the first wave of the Rural Scotland Business Panel survey. The Rural Scotland Business Panel builds on two existing business surveys: the HIE Business Panel survey, running since 2014, and the SOSE Business Panel survey, running since June 2021. It also builds on the Scottish Government's previous research with rural businesses via the annual rural business survey (conducted by Scotland's Rural College (SRUC) among businesses in Aberdeenshire, Dumfries and Galloway, the Scottish Borders and Tayside) which ran from 2017/18 to 2019/20[1].
Given the collective aspirations to build a stronger evidence base for the rural economy in Scotland, the Scottish Government, HIE and SOSE commissioned this joint survey of businesses across rural Scotland. The survey acted as a continuation of the HIE and SOSE Business Panel surveys already established, covering the Highlands and Islands and South of Scotland regions respectively, expanded to include a larger sample covering the rest of rural Scotland. The HIE and SOSE Business Panel surveys were distinct components of the overall survey, with findings reported on separately as well as within this report[2].
The aim of the survey is to ensure that the voices of rural businesses are represented at regional and national level. Survey findings will help address existing data gaps by providing consistent and comparable data on businesses in each region and across rural Scotland overall, allowing the Scottish Government, HIE and SOSE to explore emerging opportunities and challenges and to track change over time. Findings will help inform resource prioritisation and policy development within and across the public sector.
The survey covered a range of topics including: economic optimism, current priorities and concerns, financial support, response to cost increases, labour shortages, and supply chain issues. It also covered import and export markets, business response to net zero and Fair Work.
Context
The survey was carried out against the backdrop of challenging economic circumstance for businesses in rural Scotland, and across the UK.
Though widespread Coronavirus (COVID-19) lockdown restrictions had eased, some businesses were still operating in a different way than they had been pre-pandemic, with the tourism sector in particular still subject to limitations on its usual operation.
September and October 2021 saw reports of increased inflation, record fuel prices, widespread fuel shortages and disruption to the wider supply chain. The survey therefore explored the extent to which these issues had impacted on rural businesses.
November 2021 saw the UN Climate Change Conference (COP26) take place in Glasgow, with the attention of global media turned to Scotland and its response to the climate emergency. The survey therefore captured business views on net zero and moving to low carbon ways of working.
Methodology
Fieldwork
The survey was conducted with businesses and social enterprises across rural Scotland between 4 October and 1 December 2021, using telephone interviewing. In total 2,726 eligible interviews were achieved.
Geographic coverage
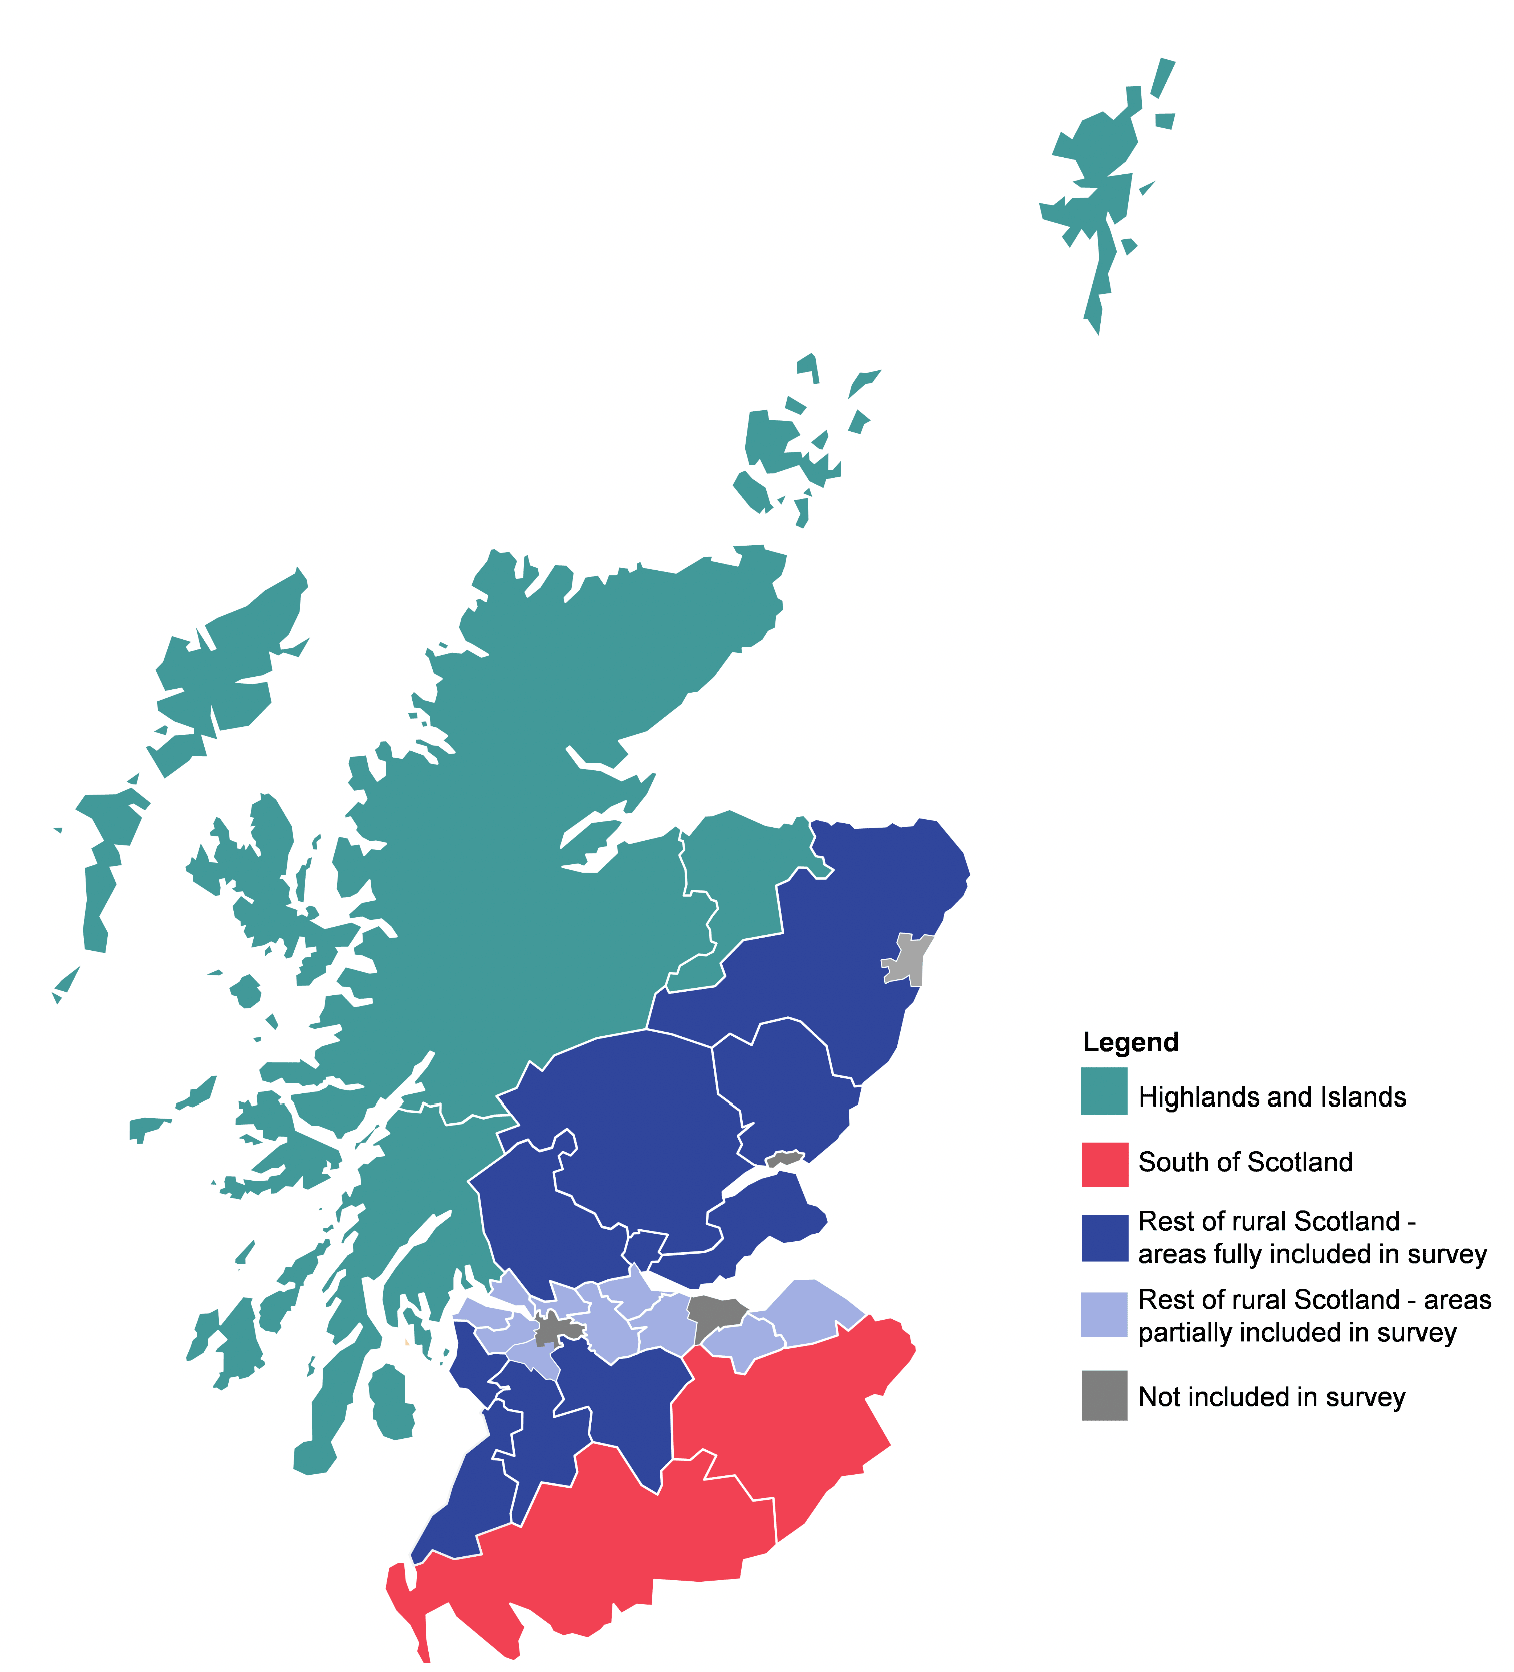
The survey covered three geographic areas:
- Highlands and Islands (the area covered by HIE), including: Argyll and the Islands, Caithness and Sutherland, the Inner Moray Firth, the Outer Hebrides, Lochaber, Skye and Wester Ross, Moray, Orkney and Shetland.
- South of Scotland (the area covered by SOSE), consisting of Dumfries and Galloway and the Scottish Borders.
- The rest of rural Scotland. This area included all other parts of rural Scotland not already covered by the HIE and SOSE samples. For the purposes of this survey, 'rural' was defined as categories 2 to 6 of the Scottish Government's six-fold Urban Rural Classification[3] (see Table 1.2), excluding any parts of category 2 that were within travel to work areas[4] centred on Large Urban area (e.g. excluding category 2 areas that are within commuting distances from Glasgow, Edinburgh, Aberdeen or Dundee, and therefore share some of the infrastructure and operating environments of those large urban centres).
The map in Figure 1.1 shows the broad areas covered by the survey.
The number of achieved interviews in the three areas is shown in Table 1.1.
| Area | Number of interviews |
|---|---|
| Highlands and Islands | 1,003 |
| South of Scotland | 602 |
| Rest of rural Scotland | 1,121 |
| Total | 2,726 |
The profile of the businesses that took part in the survey covered a range of categories in the six-fold Urban Rural Classification (Table 1.2), with more than half (57%) being in either a remote or accessible rural area. Further details of the profile of the survey sample are shown in Appendix B and a map of the six-fold Urban Rural Classification is provided at Appendix C.
| Category | % of participating businesses |
|---|---|
| 1 (Large urban) | - |
| 2 (Other urban areas) | 22 |
| 3 (Accessible small towns) | 13 |
| 4 (Remote small towns) | 9 |
| 5 (Accessible rural areas) | 31 |
| 6 (Remote rural areas) | 26 |
| Total | 2,726 |
In this report, survey findings have been condensed into three categories: remote rural (category 6), accessible rural (5) and the small towns and peripheral urban areas (2 to 4). This grouping of categories 2, 3 and 4 together allows more statistically significant variations between groups to emerge because of the larger sample size involved.
Sampling
The survey sample was sourced from two sources. For the HIE and SOSE areas, the sample was mainly sourced from businesses that were members of their existing business panels, that had indicated they were willing to be re-contacted. The remaining sample was sourced from the Dun and Bradstreet business database and was stratified by sector and size to reflect the population of businesses in rural Scotland.
Quotas were set for recruitment and interviewing so that the achieved sample reflected the population of eligible organisations as defined by the Inter-Departmental Business Register (IDBR)[5]. Eligible organisations were defined by SIC (Standard Industrial Classification) code, with the following SIC 2007 Sections excluded from the sampling:
- public administration and defence; compulsory social security;
- education and health and social work;
- activities of households as employers; undifferentiated goods- and services-producing activities of households for own use; and
- activities of extraterritorial organisations and bodies.
SIC codes were used to identify areas of economic activity considered to be growth sectors[6] (as set out in the Government Economic Strategy) so that quotas could be set to ensure these were represented in the survey sample. These growth sectors are derived from the longer list of SIC code categories (as outlined in Table 1.3) and are used for analysis throughout the report. Where businesses do not fall within one of these categories, they are classed as "non growth sector", a collective term that covers a range of individual SIC categories (see breakdown of the sample in Appendix B).
| Growth sector | Includes parts of the following SIC 2007 categories |
|---|---|
| Food and drink | A – Agriculture C – Manufacturing (e.g. of food and beverages) |
| Creative industries (including digital | C – Manufacturing (e.g. of furniture, ceramics, textiles, etc.) G – Wholesale and retail J – Information and communication M – Professional, scientific and technical activities (e.g. architecture, advertising, design etc.) N – Administrative and support services R – Arts, entertainment and recreation |
| Tourism | I – Accommodation and food service activities N – Administrative and support services R – Arts, entertainment and recreation |
| Energy (including renewables) | B – Mining C – Manufacturing (e.g. of chemicals, petroleum) D – Electricity and gas E – Water M - Professional, scientific and technical activities |
| Financial and business services | K – Financial and insurance activities M – Professional, scientific and technical activities N – Administrative and support services |
| Life sciences | C – Manufacturing (e.g. of medical supplies) M – Professional, scientific and technical activities |
Within each participating organisation, the survey respondent was the owner or a senior manager able to comment on the performance and future prospects of the organisation.
The achieved sample was broadly representative of the population, notwithstanding some differential non-response due to differences in availability and willingness to participate. Weighting was applied to the data so that it matched the business population by broad geographic area (Highlands and Islands, South of Scotland and rest of rural Scotland), sector and size of business.
Presentation and interpretation of the data
The survey findings represent the views of a sample of businesses, and not the entire business population of rural Scotland, therefore they are subject to sampling tolerances, meaning that not all differences will be statistically significant.
Throughout the report, differences between sub-groups are commented upon only where we are sure these are statistically significant, i.e. where we can be 95% certain that they have not occurred by chance. The typical sub-groups reported on are:
- Size of business (grouped by sole trader[7], 1-4, 5-10, 11-24 and 25+ staff)
- Sector (using the growth sector categories in Table 1.3)
- Location (one of the three broad areas shown in Table 1.1)
- Rurality (grouped into three categories of remote rural, accessible rural, and small towns and peripheral urban areas)
- Other characteristics based on responses to the survey (e.g. the markets they trade with, their growth aspiration etc.)
Where percentages do not sum to 100%, this may be due to rounding, the exclusion of 'don't know' categories, or multiple answers. Aggregate percentages (e.g. "optimistic/not optimistic" or "important/not important") are calculated from the absolute values. Therefore, aggregate percentages may differ from the sum of the individual scores due to rounding of percentage totals.
Throughout the report, an asterisk (*) denotes any value of less than half a percent and a dash (-) denotes zero. For questions where the number of businesses is less than 30, the number of times a response has been selected (N) rather than the percentage is given.
Contact
Email: socialresearch@gov.scot