Hill, Upland and Crofting Farmer-led Group: climate change evidence
A summary of existing evidence around Hill, Upland and Crofting (HUC) farming, including greenhouse gas emissions produced by the Rural and Environment Science and Analytical Services (RESAS) division.
1 Context and Structure
1.1 Composition of the LFA Cattle and Sheep Sector
1.1.1 Definition
Data on the hill and upland cattle and sheep sectors are not readily available. However, the elevated areas of the hills and uplands in Scotland will typically be on land designated as Less Favoured Area (LFA). For the purposes of this report, farms categorised as specialist LFA are used as the best proxy for hill and upland livestock farming. Specialist dairy farms have not been included. A glossary and definitions of these categories and other terms can be found in Annex A.
Unless otherwise stated, data in this chapter are drawn from the June Agricultural Census, Total Income from Farming (TIFF), and the Farm Business Survey (FBS), with further detail available in Annex B.
A farm is considered to be a specialist LFA farm where two-thirds or more of output from farming comes from LFA land, typically in the form of cattle, sheep or (more likely) a combination of the two. Limitations of this approach include that: livestock may not be held on a farm's LFA land; not all LFA land will be hills and uplands; and, not all hills and uplands will exclusively be LFA land. However, we consider this to be the best proxy available within the timelines available for preparing this report.
1.1.2 Outputs and Value
Standard Outputs provide an estimated farm-gate value of crop and animals. This provides an estimate of the value of a farm's total output that can be used to compare farms. Costs incurred in production are not taken in to consideration.
In 2019, the standard output produced by all LFA cattle and sheep farms in Scotland was around £718 million. This was around £10 million less than in the previous year. LFA cattle and sheep farms accounted for around 27% of total standard output in Scotland.
LFA cattle and sheep farms accounted for over half of all of Scotland 5.7 million hectares of agricultural land and roughly 30% of all Scottish holdings. The average standard output per holding was around £48,000, less than the average of £52,000 across all farm types.
Non-LFA cattle and sheep farms had an estimated £140 million standard output in 2019, a decrease of around £4 million from the previous year. This is around 5% of total output. Non-LFA cattle and sheep farms accounted for just 2% of agricultural land and 6% of all Scottish holdings. Average standard output per holding was £49,000.
1.1.3 Scottish Cattle and Sheep Farms
5,901,000 : Number of sheep on farms with LFA land
1,007,000 : Number of cattle on farms with LFA land
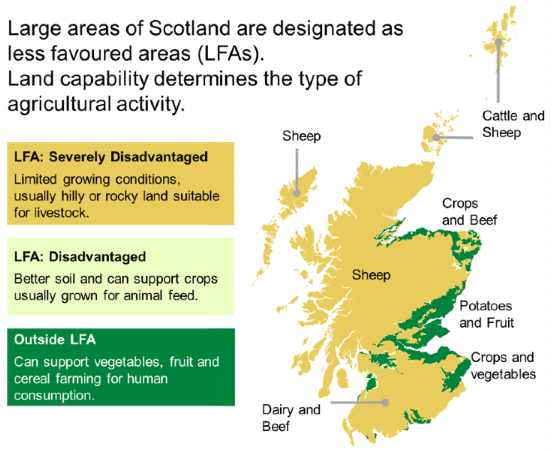
86% : Percentage of land which is LFA[3]
Around 86% of Scotland's agricultural land is classified as Less Favoured Area (or LFA). Of Scotland's 51,000 holdings, 29% were classified as specialist LFA cattle and sheep farms – these farms accounted for the majority of the cattle herd and sheep flock (77%).
In 2019, specialist LFA farms, on which output figures above are based, held around 5.6 million sheep (84%) and around 873,000 beef cattle (62%). This rises to 88% of all sheep and 72% of all beef cattle for all holdings with LFA land (figures above). The majority was located in Southern Scotland and the Highlands and Islands, as shown in Table 1.
| NUTS2 Region | Specialist LFA holdings | All holdings with LFA Land | ||||
|---|---|---|---|---|---|---|
| Animals (000's) | Holdings | Animals (000's) | Holdings | |||
| Cattle | Sheep | Cattle | Sheep | |||
| North East Scotland | 89 | 227 | 800 | 116 | 259 | 1,200 |
| Eastern Scotland | 88 | 879 | 1,000 | 107 | 946 | 1,300 |
| Southern Scotland | 404 | 2,494 | 3,200 | 470 | 2,643 | 4,100 |
| Highlands & Islands | 260 | 1,841 | 8,500 | 278 | 1,894 | 9,300 |
| West Central Scotland | 33 | 157 | 400 | 36 | 159 | 400 |
| Total | 873 | 5,598 | 13,900 | 1,007 | 5,901 | 16,400 |
Source: June Agricultural Census 2019, via RESAS Agricultural Analysis Unit
Additionally, nearly 580,000 sheep are held on non-LFA holdings, with less than half of these on specialist sheep holdings.
| Non-LFA | Specialist Sheep Holdings | Holdings with sheep |
|---|---|---|
| Average Flock Size | 160 | 150 |
| Total Sheep | 151,000 | 427,000 |
| Number of Farms | 934 | 2,855 |
Specialist lowland farms held around 430,000 sheep (6% of all sheep) and around 180,000 cattle (13% of all cattle). The majority of this livestock was located in the North East, Southern and Eastern regions of Scotland (as shown in Table B1 in the annex).
1.1.4 Farm Size
While small herd sizes (1-149) in both cattle and sheep were most common amongst specialist LFA farms (7,900 holdings or 57%), larger herd sizes were common as well: 14% of specialist LFA farms had 1,000 animals or more, accounting for 46% and 71% of all cattle and sheep on specialist LFA farms, respectively. Specialist lowland farms follow a similar pattern. Smaller herd sizes (1-149) make up 68% of farms, having 12% of the cattle and 6% of the sheep. 8% if specialist lowland farms had more than 1000 animals. Full details are shown in Table B2 in the annex).
| Herd Size | Specialist LFA holdings | All holdings with LFA Land | ||||
|---|---|---|---|---|---|---|
| Animals (000's) | Holdings | Animals (000's) | Holdings | |||
| Cattle | Sheep | Cattle | Sheep | |||
| 1-149 | 95 | 276 | 7,900 | 132 | 298 | 9,800 |
| 150-299 | 107 | 256 | 1,700 | 140 | 265 | 1,900 |
| 300-499 | 105 | 304 | 1,000 | 125 | 324 | 1,200 |
| 500-999 | 164 | 763 | 1,300 | 184 | 814 | 1,400 |
| 1000 & over | 402 | 3,998 | 2,000 | 426 | 4,200 | 2,100 |
| Total | 873 | 5,598 | 13,900 | 1,007 | 5,901 | 16,400 |
Source: June Agricultural Census 2019, via RESAS Agricultural Analysis Unit
1.1.5 Workforce
Specialist LFA farms commonly do not have any employees, and more often rely on occupiers and spouses only – occupiers and spouses working either full-time or part-time accounted for 65% of the total workforce (including part-time and seasonal workers). Less than a fifth of specialist LFA farms had full-time employees. The picture was similar for specialist lowland sheep farms (as shown in Table B3 in the annex).
| Category | Specialist LFA holdings | All Holdings with LFA Land | ||
|---|---|---|---|---|
| Holdings | Workforce | Holdings | Workforce | |
| Occupiers and spouses working more than half time | 7,200 | 8,900 | 8,100 | 10,100 |
| Occupiers and spouses working less than half time | 6,800 | 8,800 | 7,300 | 9,400 |
| Full-time employees | 2,400 | 4,100 | 3,000 | 5,500 |
| Part-time employees | 2,200 | 3,300 | 2,600 | 3,900 |
| Casual and seasonal workers | 1,200 | 2,000 | 1,400 | 2,200 |
| Total workforce | 12,300 | 27,100 | 13,500 | 31,000 |
Source: June Agricultural Census 2019, via RESAS Agricultural Analysis Unit
1.1.6 Red Meat Processing
Quality Meat Scotland's 2020 edition of the Scottish Red Meat Industry Profile shows that twenty-one red meat abattoirs operated in Scotland in 2019 – two fewer than 2018. Slaughter output of cattle decreased in quantity, volume, and value on 2018, while sheep slaughter numbers and value increased.
| Category | Number of animals(thousands) | Volume (thousand tonnes) | Estimated Value (£m) | |||
|---|---|---|---|---|---|---|
| 2018 | 2019 | 2018 | 2019 | 2018 | 2019 | |
| Cattle | 459 | 449 | 167 | 165 | 643 | 599 |
| Sheep | 1,119 | 1,265 | 23 | 26 | 102 | 111 |
| Total cattle and sheep | 1,579 | 1,715 | 190 | 192 | 745 | 710 |
Source: QMS 2020 edition of the Scottish Red Meat Industry Profile, p.27, RESAS calculations
The same report estimates that Scottish abattoirs sold 27% of their beef and 17.5% of their sheepmeat to Scottish businesses or consumers in 2019. The majority was sold to the rest of the UK (65% of beef and 53% of sheepmeat), while overseas exports accounted for 8% of beef sales and 29.5% of sheepmeat sales.
1.1.6.1 Overseas Exports and Imports
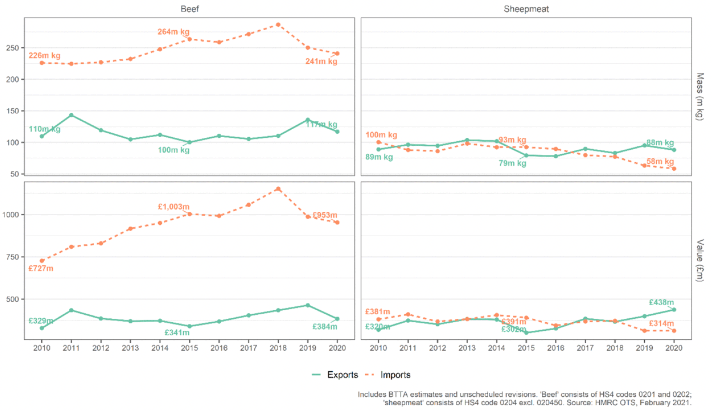
Trade data from HMRC[4] suggests that the UK as a whole imported more beef (fresh and frozen carcass meat) than it exported: in 2020, the UK exported 117 million kg and imported 241 million kg (or by value, £384m and £953m, respectively). Between 2010-2017, beef imports also increased in value and volume, although recent years have seen a reversal in trend. Lamb and mutton are exported from and imported to the UK at roughly the same volume and value.
Beef and sheepmeat trade, 2010-2020
1.2 Profitability and Turnover
1.2.1 Estimated Farm Business Incomes and Profit
Farm Business Income statistics are estimated from a sample of nearly 500 farms with a standard output (the average monetary value of the agricultural output at farm-gate price) over €25,000. The FBS does not collect information on non-supported sectors, which include farms predominantly engaged in horticulture, pigs, poultry and some fruit production. A large number of part-time and small Scottish farms with low output are also not included[5] . As such, these figures exclude the vast majority of crofts.
Specialist LFA farms are broadly categorised in statistical reports as Specialist Sheep LFA, Specialist Cattle LFA, and Specialist Cattle & Sheep LFA. The remaining category including sheep, Lowland Cattle & Sheep, is also included in Table 6 below. A glossary and definitions of these categories and other terms can be found in Annex A.
Table 6 shows the estimated Farm Business Income (FBI) by upper and lower performance band, based on income with and without support payments. FBI is used here as an indication of how much profit a farm makes, and includes income from diversification. FBI figures are therefore not just measuring profitability from agricultural activity, but include income from non-agricultural activities that use farm resources. These non-agricultural activities can include, for example, tourism, renewables or processing and sale of farm products. There are wide variations in performance across farm types.
In 2018-19, the average FBI in Scotland was around £38,700. Excluding support payments, this falls to around -£4,700, suggesting that for many Scottish farms CAP support plays an important role.
On average, Lowland Cattle and Sheep farms and Specialist Sheep (LFA) farms had the lowest FBI (both around £12,000). Excluding support payments all farm types saw a reduction in FBI, with Specialist Sheep (LFA) farms seeing the greatest fall, at around -£34,900, compared to -£21,800 for the average Lowland Cattle and Sheep farm.
| Farm Type | Performance Band by Income | |||||
|---|---|---|---|---|---|---|
| Lower 25% | Average | Upper 25% | ||||
| Including Support | Excluding Support | Including Support | Excluding Support | Including Support | Excluding Support | |
| Specialist Sheep (LFA) | -£17,500 | -£68,700 | £11,800 | -£34,900 | £62,000 | -£22,100 |
| Specialist Cattle (LFA) | -£16,400 | -£52,600 | £12,700 | -£29,300 | £52,800 | -£7,000 |
| Specialist Cattle & Sheep (LFA) | -£7,700 | -£46,400 | £24,800 | -£44,900 | £66,600 | -£50,000 |
| Lowland Cattle & Sheep | -£46,000 | -£98,900 | £11,500 | -£21,800 | £72,100 | £21,600 |
| All Farms | -£15,500 | -£53,800 | £38,700 | -£4,700 | £159,800 | £100,800 |
Source: Farm Business Survey 2018/19
The figure below shows profitability by farm type, represented by the proportion of farms with income from farming greater than zero (i.e. agricultural output is greater than input). Around 60% or more of LFA farms are profitable with support payments. In comparison to other farming sectors, this drops by a large proportion when support payments are removed. Without support payments less than 10% of LFA farms were profitable. Fewer Lowland Cattle & Sheep farms were profitable with support payments, but the proportion of farms making a profit when these are excluded was larger, at over 20%.
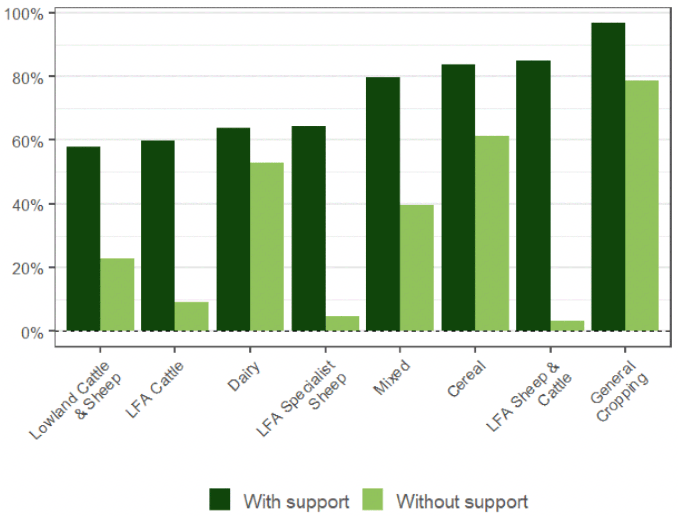
Table 7 shows the average total input, amount received from support payments and grants, and output for LFA farm types. On average, specialist LFA farms have an output of around £91,600, make £2,800 from diversified activities and receive around £48,400 from subsidies and payments. Inputs are around £128,000 a year, with the largest part associated with livestock expenses.
Economic efficiency is calculated as a ratio of outputs to inputs. Therefore, the average specialist LFA farm has an economic efficiency of around 122%.
| Farm Type | Output | Input | Support payments and grants | Diversification Margin | Economic efficiency* |
|---|---|---|---|---|---|
| Specialist Sheep (LFA) | £39,600 | £76,200 | £46,700 | £1,600 | 150% |
| Specialist Cattle (LFA) | £108,700 | £140,900 | £41,900 | £2,900 | 110% |
| Specialist Cattle & Sheep (LFA) | £114,600 | £163,500 | £69,700 | £4,000 | 115% |
| All Specialist LFA farms | £91,600 | £128,000 | £48,400 | £2,800 | 122% |
| Lowland Cattle & Sheep | £128,900 | £153,200 | £33,300 | £2,500 | 110% |
| All Farms | £190,000 | £199,300 | £43,400 | £4,600 | 124% |
*Includes support payments and diversification. Source: Farm Business Survey, 2018-19
As shown in Table 7, many LFA and sheep farms receive a significant proportion of their output from support payments and grants. For many LFA farms, the Less Favoured Area Support Scheme (LFASS) is an important part of this. Table 8 shows the number of farm businesses receiving LFASS in the bracketed amounts (figures are rounded).
| LFASS | Number of farm businesses |
|---|---|
| £0 to £385 | 1,790 |
| £385 to £1,000 | 1,880 |
| £1,000 to £2,500 | 2,170 |
| £2,500 to £5,000 | 1,820 |
| £5,000 to £10,000 | 1,600 |
| £10,000 to £25,000 | 1,390 |
| £25,000 to £50,000 | 390 |
| £50,000 to £75,000 | 50 |
| Over £75,000 | 30 |
| Total | 11,100 |
Source: RPID Administrative Data, 2018/2019
1.2.2 Diversification
Data on diversification and investment in renewable energies on hill and upland farms in Scotland is scarce. The Farm Structure Survey 2016 found that across all farming around 9% of farms made more than 50% of their turnover from diversified activities and 16% made more than 10%. 7% of all LFA cattle and sheep farm types and 8% of all non-LFA cattle and sheep farm types made more than 50% of their turnover from diversified activities. This was slightly lower than the 9% average across all farm types. A further 7% of LFA and 8% of non-LFA cattle and sheep farms made 10-50% of their turnover from diversified activities. The majority of LFA (86%) and non-LFA (84%) cattle and sheep farms made less than 10% of their turnover from diversified activities.
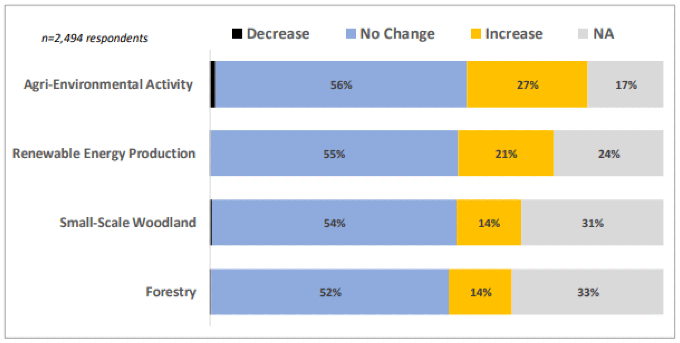
The Farmers' Intention Survey 2018, summarised by SRUC in their October 2019 briefing, revealed that over 50% of (Scottish) farmers (from all sectors) plan no changes to the levels of agri-environmental provision on their holding in the succeeding five years. Between approximately 14% and 27% of farmers plan to increase provision of "public goods" through increased agri-environmental, forestry, small-scale woodland and renewable energy production.
Of those who did signal intentions to increase these activities, identification of a successor, status as a new entrant, tenure, gender and land type were the most significant characteristics of those intending to increase public good activities. Lower productivity of land appears to be a factor which positively influences the decision of farmers to increase the level of forestry and small-scale woodland on their farm or holding.
The figure below shows the overall intentions of the farmers, crofters and smallholders surveyed to change the level of activities on their farm or holding that may enhance 'public good' provision in the next five years (2018-2023). Over 50% of respondents planned no changes to the level of each of the activities and for many the question was not applicable as they currently don't engage in that activity. The type of public good provision that most respondents planned to increase is agri-environmental activity, at 27%.
1.2.3 Crofting
Within Scotland, crofting continues to form an integral part of its rural area. Numbering over 20,000 crofts and the home of over 33,000 people traditionally situated in the former crofting counties in the Highland and Islands of Scotland. Crofts are around five hectares on average. The agricultural census also reports around 0.6m ha of land classified as common grazing. Common grazings are not exclusively used by crofts but crofts use them.
The economic position for crofting remains mixed. As reported in the Economic condition of crofting 2015 to 2018, the median revenue reported was £2,000, although there was significant variation across the group, with a quarter reporting to have received no revenue from crofting. At the same time, reported average running costs were £2,000.
The rearing of livestock and growing of crops remain the main crofting activities (undertaken by 80% and 42% of crofters respectively). Census data shows that crofts account for approximately 1% of Scotland's cropland, 11% of its sheep and 4% of its cattle. However, like other parts of Scottish agriculture, crofters have been diversifying their activities over recent years with growth in leisure activities and holiday accommodation.
As a result, income from non-crofting activities has increased over recent years, as has the median level of investment, although the proportion of crofters who state an intention to invest in coming years has fallen.
The report found that among crofters, there is ongoing uncertainty about the future of crofting, with the majority of crofters stating that they do not have a succession plan in place, and widespread agreement that crofting is not viable without income from non-crofting activities.
1.3 Future Trends
1.3.1 Impacts of Brexit
The Anderson Centre produced a report for Scottish Government in late 2020, assessing the impacts on Scottish agriculture of a UK-EU Free-Trade Agreement (FTA), and a No-Deal Brexit.
Overall, the modelled impacts of an FTA were projected to result in relatively small changes in Scottish agricultural output over the longer term. This is because agricultural trade, with the exception of seed potatoes, can continue effectively tariff-free and quota-free. Indeed, the modelling suggests that increased demand from the rest of the UK could actually increase Scottish agricultural output in some cases.
Specifically for sheepmeat and beef, output by value was projected to increase by around 1.0% and 1.1% respectively, by 2021. It should be noted that this modelling is not suitable for capturing the initial disruption being experienced by individual businesses in the early stages of the deal.
Trade between the UK and EU, however, is no longer frictionless with new non-tariff measures (NTM) – additional certifications, enhanced border checks, etc. – now in place. As a result, the costs of such trade are set to increase. For sheepmeat carcass products, the NTM costs are estimated between 0.9% and 2.0% of their price (also referred to as ad-valorem equivalent (AVE)). For beef, these costs are estimated to be larger, averaging between 1.2% and 2.9%.
1.3.2 Changing Dietary Demands
DEFRA's Family Food datasets, based partly on ONS' Living Costs and Food Survey, provide an overview of UK and Scottish household purchases and expenditure of food and drink. The latest release, with data up to 2018/2019, shows that the volume of beef and sheepmeat purchased by both UK and Scottish consumers for at-home consumption has declined. Since 2001, the volume of beef and veal purchased by Scottish consumers has decreased by 10%, while the volume of lamb and mutton purchased has halved.
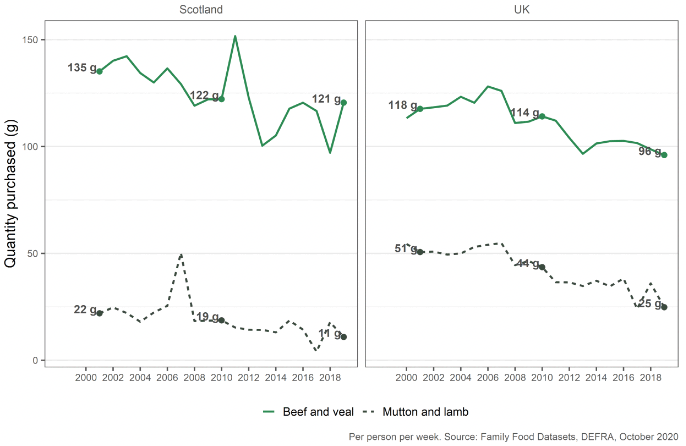
In addition, the latest data suggests Scottish consumers purchase less than half the quantity of lamb and mutton per week on average (11g) than UK households (25g). Beef is consumed in greater quantities in Scotland, however: 121g vs. 96g per person per week.
| Region | Category | Purchase | Expenditure |
|---|---|---|---|
| UK | Beef and veal | 96g | £0.82 |
| Mutton and lamb | 25g | £0.22 | |
| Food and Non-Alcoholic Drinks | .. | £28.32 | |
| Scotland | Beef and veal | 121g | £1.00 |
| Mutton and lamb | 11g | £0.11 | |
| Food and Non-Alcoholic Drinks | .. | £28.85 |
Source: Family Food, DEFRA, October 2020
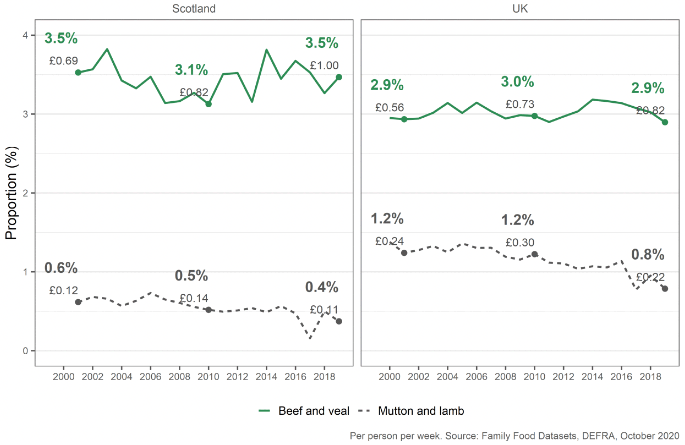
The proportion of total food and drink expenditure spent on beef and veal has remained largely stable. In 2018/2019, 2.9% of total UK food and drink expenditure was spent on beef and veal, a similar level to that seen in since 2001 (3.5% for Scottish households). Mutton and lamb expenditure as a proportion of total food and drink expenditure, however, decreased for both UK and Scottish households.
A number of key reports have discussed changes to red meat consumption. The UK Climate Assembly[6] – a citizens' assembly on climate change – discussed their preferred future for food, farming and land use on the path to net zero in the UK. This included 20-40% voluntary and education driven reductions in red meat and dairy consumption.
The Climate Change Committee[7] have also formally modelled these reductions in their 6th Carbon Budget report in order to determine their pathways for the UK, including Scotland, to reach net-zero by 2050.
Their advice also highlights three key changes required to reduce agricultural emissions:
i. diet change with their main pathway to net-zero assuming a 20% reduction in UK consumption of red meat by 2030, rising to 35% by 2050;
ii. low-carbon farming practices;
iii. productivity measures to improve crop yields and reduce stocking rates.
The sectoral pathway for Scottish agriculture in the CCC report requires an emissions reduction of 23% by 2030 and the CCC state changes in farming practices, woodland planting and reductions in livestock numbers are all required to achieve net zero.