Hill, Upland and Crofting Farmer-led Group: climate change evidence
A summary of existing evidence around Hill, Upland and Crofting (HUC) farming, including greenhouse gas emissions produced by the Rural and Environment Science and Analytical Services (RESAS) division.
2 Greenhouse Gas Emissions and Biodiversity
2.1 Sector Emissions
The Scottish Government has committed to reaching net zero emissions by 2045, including a reduction of 75%, from 1990 levels, by 2030. Whilst a number of countries have adopted net zero targets by on or around 2045, Scotland's 2030 target is particularly ambitious and requires quick action.
Scotland has a legal requirement to meet these goals, and every industry must adjust to contribute to reducing emissions. The Greenhouse Gas (GHG) inventory measures the domestic emissions, i.e. those produced in Scotland. It is the key data source against which Scottish Government measures its progress against its net zero targets. Emissions arising from goods produced in Scotland and exported overseas for consumption are counted in the Scottish GHG inventory. Emissions arising from goods produced overseas and imported into Scotland for consumption are not counted in the Scottish GHG inventory.
In 2018 total Scottish emissions were 41.6 million tonnes of carbon dioxide equivalent (MtCO2e). The 2019 figures are scheduled to be published in summer 2021.
In 2018 emissions from agriculture were 7.5 MtCO2e, or 18% of Scottish emissions. The sectoral envelope as set out in the Climate Change Plan update requires agricultural emissions to reduce from current levels by 2.4 MtCO2e to 5.3 MtCO2e[8] by 2032, the equivalent of a 31% reduction from 2018 levels. As shown below this requires agriculture to reduce emissions at a pace nearly four times faster than historic reductions. Progress towards delivering the plan will be part of statutory annual reporting at a sector-by-sector level to the Scottish Parliament from May 2021 onwards.
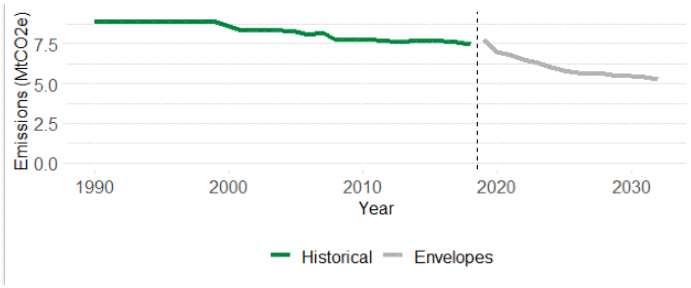
Source: Scottish Greenhouse Gas Emissions 2018 - gov.scot (www.gov.scot), Securing a green recovery on a path to net zero: climate change plan 2018–2032 - update - gov.scot (www.gov.scot)
Note: there is a small break in the series due to a slight mismatch in the historic data and the forecast envelopes
2.1.1 Emissions from Hill and Upland Farms
The Greenhouse Gas Inventory does not publish break downs of emissions specific to hill and upland farming. We have therefore estimated emissions based on the percentage of sheep (88%) and cattle (72%) on all farms with LFA land.[9]
This method implies that the 6 million sheep in LFA areas contribute around 0.92 MtCO2e and 1 million beef cattle around 2.47 MtCO2e, suggesting around 3.38 MtCO2e in total from livestock on LFA land, or 45% of all agricultural emissions. Further detail on the breakdown of agricultural emissions is in Annex C. Some farms with LFA land may have emissions arising from other agricultural activities but relatively these are likely to be quite small. This estimate includes a small amount of emissions from cattle described as 'other dairy' in census data and so slightly overstates the emissions. Emissions reductions, shown below for all sheep and beef cattle, since 1990 are driven by falling sheep and cattle numbers.
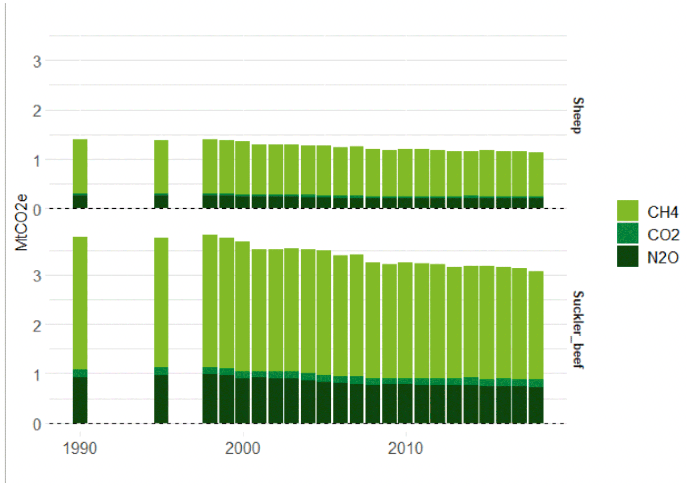
Source: Scottish Greenhouse Gas Emissions 2018 - gov.scot (www.gov.scot)
2.1.2 Sources
The chart below shows how the 2018 emissions from LFA farms break down by source and pollutant. Enteric fermentation is the largest source contributing 68% of emissions from LFA farms. The next largest source contributing a further 15% is manure management.
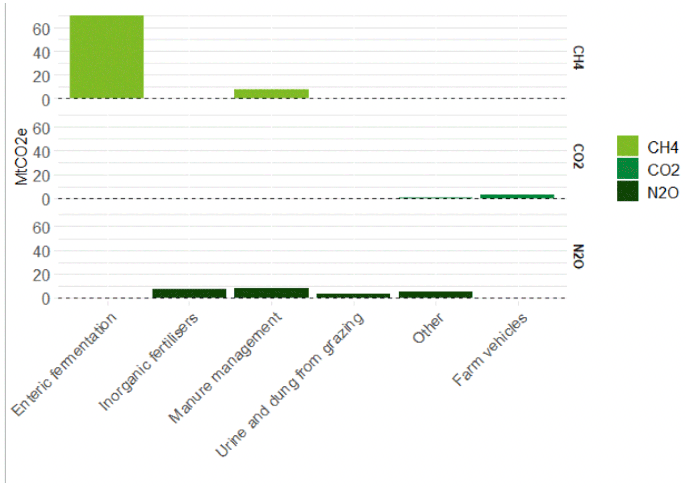
Source: Scottish Greenhouse Gas Emissions 2018 - gov.scot (www.gov.scot), RESAS classification based on ADAS data
Over time, the largest reductions by source have come from reductions in emissions from enteric fermentation, related to reductions in livestock numbers.
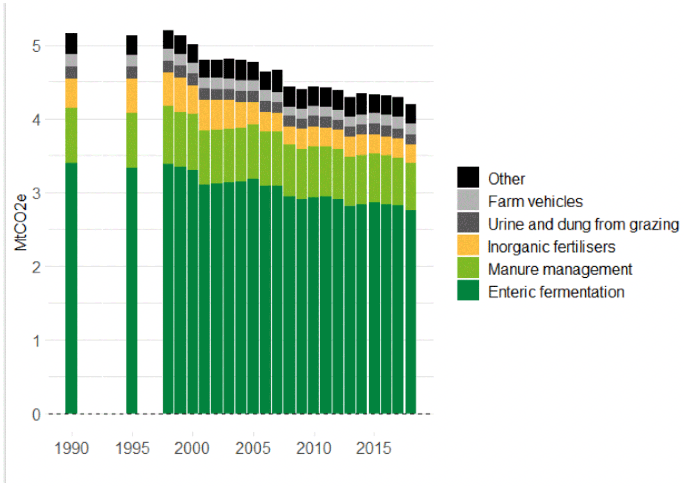
Source: Scottish Greenhouse Gas Emissions 2018 - gov.scot (www.gov.scot), RESAS classification based on ADAS data
2.2 Options for Reducing Emissions
2.2.1 Potential Savings
Research undertaken by CXC and SRUC on behalf of Scottish Government assessed the potential savings from a range of mitigation measures that could be applied in Scotland and the likely maximum uptake that could be achieved. The report did not assess timescales for uptake of these measures, which will be influenced heavily by factors such as behaviour change and policies. Table 10 summarises the measures that could be applied to sheep and beef cattle. Estimates of the aggregate emissions savings have been added based on most recent data on levels of livestock in LFA areas. There may be some overlap with potential reductions in beef emissions with the SBCS.
| LFA Livestock 2020 | Mitigation measure | Maximum Uptake 2050 | Per unit mitigation (kg CO2e) | Aggregate Mitigation (MtCO2e) |
|---|---|---|---|---|
| 1,007,000 Cattle 5,901,000 Sheep |
3NOP feed additive | 52% | 420 | 0.22 |
| Breeding low methane cattle | 19% | 120 | 0.02 | |
| Slurry cover - impermanent | 25% | 230 | 0.06 | |
| Improved health | 78% | 30 | 0.02 | |
| Improved health (Sheep) | 72% | 10 | 0.06 | |
| Additive Total | .. | 810 | 0.38 |
Source: Marginal abatement cost curve for Scottish agriculture (climatexchange.org.uk)
Strictly speaking the 'additive totals' overstate the savings as some measures may interact and reduce the impact of other measures. However these interactions were assessed to be relatively low and these interactions could mainly happen between 3NOP feed additive and breeding for low methane emissions.
If each of these measures were applied to their maximum potential as identified in the report, estimated reductions from emissions based on current levels of all livestock on LFA land would be in the region of 0.38 MtCO2e.
This would be a 11% reduction in terms of 2018 emissions from the LFA sector or 16% of the 2.4 MtCO2e reductions required by agriculture by 2032 with the remaining 84% needed to come from elsewhere in the sector. A reduction of 2.4 MtCO2e is equivalent to a 31% reduction from 2018 levels. Therefore, even if all agricultural sectors were to achieve an equivalent 11% reduction in their emissions this would not be sufficient, by over two-thirds, for the agriculture sector to meet its envelope by 2032.
The Climate Change Committee states changes in farming practices, woodland planting and reductions in livestock numbers are all required to achieve net zero. Their advice also highlights three key changes required to reduce agricultural emissions:
1 – Diet change with their main pathway to net-zero assuming a 20% reduction in UK consumption of red meat by 2030, rising to 35% by 2050
2 – Low-carbon farming practices, similar to those outlined above
3 – Productivity measures to improve crop yields and reduce stocking rates
It is important to note that the figures above are average estimates that were provided for Scotland as a whole and may not reflect issues specific to LFA livestock. Further, on an individual farm basis, both the mitigation and the net costs (below) can be very different and some measures above cover a wide range of possible actions which would be demanding to assess individually. Therefore the GHG benefits achieved and costs could vary widely.
Further details on each of these measures, such as costs, underpinning assumptions, constraints and potential uptake can be found on pages 12-13 of the CXC report and in the Annexes on pages 43-53. They have also been collated into Annex D for ease.
As set out within the CXC report, there is scope for all sectors in agriculture to mitigate their operational GHG emissions through other practises and alternative land use such as those to encourage carbon sequestration.
2.2.2 Costs
Some of these measures would involve the purchase of capital equipment with upfront costs. The table below shows the net costs to farmers including capital costs on an average annual basis. These do not include any wider costs such as those to Government or Research and Development from developing measures. Negative figures below show a net saving to the farmer, i.e. if implemented they would provide a financial saving to the farmer as well as a reduction in emissions. Based on current livestock levels the average potential cost to the sector is around £27.6m which – to put this in context - is just under 4% of the value of standard output from LFA farms.
| Dairy Cattle 2020 | Mitigation measure | Maximum Uptake 2050 | Per Unit Annualised Cost (£) | Aggregate Cost (£m) |
|---|---|---|---|---|
| 1,007,000 Cattle 5,901,000 Sheep |
3NOP feed additive | 52% | 31.38 | 16.4 |
| Breeding low methane cattle | 19% | -15.96 | -3.1 | |
| Slurry cover - impermanent | 25% | -0.25 | -0.1 | |
| Improved health | 78% | 20.26 | 15.9 | |
| Improved health (Sheep) | 72% | -0.36 | -1.5 | |
| Additive Total | .. | 27.6 |
Source: Marginal abatement cost curve for Scottish agriculture (climatexchange.org.uk)
2.2.3 Current Uptake & Implementation Constraints
This section contains a brief summary of some of the key issues relating to each of the measures outlined in Tables 10 and 11 above, drawing heavily on the CXC report.
2.2.3.1 3NOP feed additive for cattle
Feed additives are not yet available on the market for the purposes of reducing methane. However some products have already sought regulatory approval and are expected to be approved this year for dairy, with other sectors likely to follow.
Current uptake is effectively zero. Practically feed additives will be easier to provide to housed cattle where potential uptake at least is 100%. National inventories and monitoring programs will need to be adjusted to track, record and measure the reductions from such additives.
2.2.3.2 Cattle breeding for low-methane emissions
The measure requires enteric methane emissions to be included in breeding goals with low emission animals selected for breeding. It requires farmers buying (semen from) breeding animals, which have a high score of this breeding index (i.e. lower methane emissions). If genomic tools are used in the selection then the genetic improvement can be sped up, meaning that the methane emissions reduce at a faster rate.
The CXC study estimated improvements could be applied to around 45% of the dairy herd.
There would be upfront research costs estimated in the region of £2.5m across the UK and ongoing research costs as well. The farmers are not likely to experience costs beyond the costs of their current breeding practices (like artificial insemination). Moreover, they can expect improvements in productivity and therefore achieving a better gross margin.
In terms of current uptake the option of low-methane breeding does not exist in Scotland or the UK, as a low emission breeding index is not in use yet.
2.2.3.3 Covering slurry stores with impermeable cover
A review of experimental results showed that impermeable plastic covers have the potential to reduce ammonia and GHG emissions in parallel. However, there can be feasibility problems with floating covers if applied on slurry tanks or larger lagoons and their durability is not yet well tested. Furthermore, the presence of a slurry cover increases the ammonia concentration of the slurry and hence its nitrogen content and fertiliser value, but also the potential subsequent ammonia and nitrous oxide losses when the slurry is applied to the soil, unless low ammonia emission spreading techniques are implemented.
Impermeable covers do not inhibit methane formation, so the gas built up under the cover needs to be managed to avoid an explosion risk. The report states that all slurry tanks could be covered. The Survey of Agricultural Production Methods[10] (2016) shows that nine per cent of all holdings had storage facilities for slurry, with 62 per cent of these having covered storage.
2.2.3.4 Improved health of cattle & sheep
Animal health is a complex topic, influenced by numerous diseases. The emissions intensity of ruminant meat and milk production is sensitive to changes in key production aspects, such as maternal fertility rates, mortality rates, milk yield, growth rates and feed conversion ratios - all of which are influenced by the health status of the animal. In particular the report discusses worms in sheep and cattle and liver fluke in cattle. The CXC study estimated 80% of the herd could have improved health and estimated the cost-effectiveness to the farmer from productive gains.
A simplistic approach was taken; rather than estimating the GHG effects of the prevention and control of individual diseases, a general improvement in the health status was assumed, without reference to specific management options.
2.2.4 Evidence from the Climate Change Committee
Agriculture, and land-use, feature prominently in the Climate Change Committee's sixth Carbon Report, which expresses the need to reduce red meat and dairy intake, via behavioural change, and transform farmland.
The sectoral pathway for Scottish agriculture in the CCC report requires an emissions reduction of 23% by 2030. The CCC state changes in farming practices, woodland planting and reductions in livestock numbers are all required to achieve net zero. Their advice also highlights three key changes required to reduce agricultural emissions: 1 - diet change with their main pathway to net-zero assuming a 20% reduction in UK consumption of red meat by 2030, rising to 35% by 2050. 2 – low-carbon farming practices, similar to those outlined above. 3 – productivity measures to improve crop yields and reduce stocking rates.
The CCC and its key speakers have stressed that not only are the changes outlined critical for agriculture to reduce its emissions but also critical to free up the land required for other sectors to achieve what they need.
The CCC recommend the following policies are implemented in fair way to farmers; a strengthened regulatory baseline, incentive schemes such as auctioned contracts and measures to address skills issues, supply chains and barriers for tenant farmers. The CCC state that policies are also needed to cut food waste and encourage a reduction in consumption of meat and dairy.
A number of farm-level challenges were highlighted including uptake of measures, particularly cost-incurring measures, lack of knowledge, skills and experience to transition to low carbon farming, contractual issues and incentives around tenancies and common-land. Wider barriers on dietary change were around lack of awareness, metrics, labelling issues and lack of public sector leadership.
2.3 Biodiversity
2.3.1.1 What do we know about biodiversity?
The Convention on Biological Diversity defines biodiversity as the variability among living organisms from all sources including within and between species and of ecosystems. It is vital to supporting humans by contributing to food production, manufacturing supplies, recreation, soil quality, and climate stabilisation. In December 2020 the Scottish Government published a Biodiversity Statement of Intent which includes proposals in relation to land use.
The Dasgupta Review of the Economics of Biodiversity commissioned by HM Treasury highlights that we are demanding more goods and services than nature can sustainably supply. This means global stocks of natural assets have been depleted. The review makes clear that increased biodiversity helps mitigate risks to economic prosperity and climate change. Acting immediately on biodiversity loss is significantly more cost effective than delaying action. We can respond by reducing our use of natural resources, increasing the efficiency with which we use them or increasing them through conservation and rebuilding.
2.3.1.2 What is the relationship between farming and biodiversity?
The UKG review states the relationship between farming and biodiversity is complex. Agriculture is the dominant land use in Scotland and includes some of the country's most important wildlife habitats. Farmland management is recognised as one of the most significant pressures on biodiversity[11] . Some of the habitats and species associated with Scottish upland areas are important at European level (for example the level of peatland and heath area) and fragile. The Scottish uplands contain a large proportion of Europe's heathland. Caithness and Sutherland host the largest and most intact area of blanket bog in Europe, around 4% of the world's blanket bogs. Agriculture has a significant influence through grazing, drainage and application of nutrients.
Species-rich grasslands, habitat mosaics (including grassland/heath and wetlands), coastal heaths and machair habitats are particularly relevant in crofting areas. A significant number of priority species, which are rare, or in decline, are found here. The great yellow bumblebee is restricted to machair areas and other flower-rich areas in Orkney, Scottish islands, and Caithness and Sutherland. Marsh fritillary is restricted to the west coast in Scotland. The Corncrake, now restricted to the Western Isles and Orkney is one vulnerable species that has made a recovery with the support of Agri-Environment schemes.[12]
Biodiversity can benefit farmers by improving productivity including soil health, and farming approaches can be tailored to benefit wildlife and biodiversity.[13] However, this is not always true: for example, an area of farmland may have high biomass, but low biodiversity.
A change of land use can result in various impacts on biodiversity: for example, conversion from semi-natural grazing to forestry may be detrimental, as the diversity and richness of wildlife associated with the former can be considerable, whereas conversion from improved grassland (which can be poor for wildlife) to forestry is likely to make little difference.[14]
Farmland is particularly able to deliver services such as energy sources, food production and recreation. The Natural Capital Asset Index shows that the natural capital[15] asset value of agricultural and cultivated land has been reducing over recent years, while the value of heathland has been improving. The Index is made up of quality (38) x quantity indicators (i.e. area).[16]
Biodiversity varies across regions, land uses and species. A commonly used indicator for biodiversity is bird populations. Research by Nature.Scot shows that most wader species have seen significant declines while seed-eaters show stable or increasing long-term trends. Seventeen species contribute to the upland bird indicator, and of these, nine are in significant long-term decline. Five species (dotterel, curlew, black grouse, hooded crow and dipper) have declined by more than 45%. One of the biggest stories is the disappearance of many wader species from much of their former breeding ranges in Scotland and across the UK.[17] Concern about both upland and lowland breeding wader declines has resulted in a wide range of research and conservation initiatives (through AECS and Working for Waders).[18] Long-term changes have been driven by a number of factors including climate change, forest expansion, and changes in site based management practices such as grazing and predator control.
| Species | Long-term trend | Short-term trend |
|---|---|---|
| Common snipe | Increase | Increase |
| Curlew | Decrease | Decrease |
| Lapwing | Decrease | Decrease |
| Oystercatcher | Decrease | Decrease (slowing) |
| Redshank | Decrease | Decrease (slowing) |
| Linnet | Increase | Stable |
| Skylark | Stable | Decrease (accelerating) |
| Tree sparrow | Increase | Increase |
| Yellowhammer | Stable | Increase |
| Corn bunting | Decrease | Increase |
There is evidence on the impact of Scottish agri-environment schemes on biodiversity. An evaluation of the 2007-2013 SRDP, using limited data, found some agri-environmental measures appeared to have a positive impact on biodiversity, particularly grass margins and beetlebanks, cropped machair, hedgerow management, and management of semi-natural habitats. An evaluation of the current AECS scheme is underway but is not yet published.
Pollinators play an essential role in plant reproduction and ecosystem functions, and there are currently large worrying declines in their populations. The European Court of Auditors on Pollinators have found that EU measures did not ensure the protection of wild pollinators, and that key EU policies, including the Common Agricultural Policy, do not include specific requirements for the protection of wild pollinators.
2.3.1.3 What is the relationship between hill and upland farming and crofting and biodiversity?
It is difficult to ascribe biodiversity impacts to particular farming sectors, as biodiversity data are collected on the basis of habitat rather than sector. Some land types, particularly machair, rely on grazing to maintain species richness and hold very high populations of breeding waders. Equally, a substantial proportion of the High Nature Value farming in Scotland is associated with extensive grazing.[19] Options available to support management practices that are important for biodiversity in upland and crofting areas include moorland management, summer hill grazing of cattle and support for native cattle on small units.[20]
NatureScot highlights that moderate grazing by both sheep and cattle supports areas of short grass which benefit many kinds of insects, plants and ground nesting birds. In addition patches of short vegetation form good breeding sites for waders like lapwing, redshank and golden plover while areas of tall grasses are favoured by species like curlew. Dung is useful for insect populations and scavenging birds feed on carion. Management through stocking rates and shepherding is important to avoid problems of overgrazing such as soil erosion, or undergrazing – which can reduce diversity as the most competitive plants take over. Areas cultivated for hay or silage that aren’t mown or grazed during the breeding season can provide cover for nesting birds. Species such as skylark, partridge and corncrake nest on the ground and favour tall vegetation. On farms with no crop cultivation, reintroducing small arable areas – e.g. for whole crop silage – may increase availability of food and habitats for wildlife.
Research commissioned by RSPB to look at the impact of reductions that have been seen in livestock numbers,[21] suggests reduced grazing pressure on semi-natural areas has led to a recovery of habitats and has been broadly positive for biodiversity. "Upland habitats such as dry heath, wet heath and blanket bog have recovered (and continue to recover) as a result of reduced grazing by sheep in particular, contributing to the improving condition of many sites. However undergrazing and loss of vegetation structure is now occurring in some areas, with adverse impacts for some species such as golden plover and other waders." "Less grazing is contributing to both native woodland regeneration but also conifer regeneration. On the other hand, less livestock has allowed an increase in grazing by deer and other herbivores.".[22]
NatureScot has a project testing an outcome based approach to supporting biodiversity on farms and crofts in Scotland. Three of the pilots are in crofting areas (Skye, Argyll, and Strathspey).[23] The project is also working closely with two partner projects in Shetland (with the RSPB) and in the Outer Hebrides (with the European Forum for Nature Conservation and Pastoralism).
Other good examples can be seen at:
- Tomintoul: Farming and Nature case study
- Balnakeil farm: HNV farming in Scotland
- Pontbren Project in Wales - a farmer-led approach to sustainable Land management in the uplands – the project was led by local farmers who identified the need to move to a more sustainable system from higher production-cost systems to using hardier native stock with less costs by planting strategic areas of trees that have also helped with runoff and benefitted wildlife.
- The Burren (Ireland) was the first to test payments by results. Described as a pioneering agri-environmental programme which aims to conserve and support the heritage, environment and communities of the Burren. The Burren has focussed round the management of species rich grassland and key indicator species/habitats.
- The Yorkshire Dales National Park has also used a results-based payments approach for the management of hay meadows.