Reconviction Rates in Scotland: 2018-19 Offender Cohort
Analyses of trends in reconviction statistics up to the latest cohort of 2018-19.
Part of
4. Number and type of previous convictions: 2010-11 to 2019-20
This section presents information on previous convictions for those offenders who were convicted on at least one occasion in 2019-20 (Table 20) or in previous years (Table 21). These two tables are compiled on a different basis to the rest of this publication. They look at convictions before a reference conviction, whereas reconvictions look at convictions after a reference conviction. Specifically, these tables look at the number of offenders convicted at least once in a year and then count the numbers of convictions they had over the previous ten years. If an offender had more than one conviction in the year, then the most recent conviction was counted as the reference conviction, and the earlier convictions were counted as previous convictions. In contrast, the reconviction tables in this publication focus on those with an index conviction in a particular year and then count how many were reconvicted in a year follow up period after that conviction. The most recent cohort here (2019-20) is one year later than the latest reconvictions cohort (2018-19), because there is not a year follow up period here. Note that convictions counted in Table 20 and Table 21 are the same type of those that are counted for reconvictions, which are all crimes in groups 1 to 5 and some offences in group 6 (see Annex B1, Annex B3, and Annex Table A2 for more details), and non-court disposals are not included.
Of the 32,929 individuals convicted at least once in 2019-20 for a crime or relevant offence, 66% had at least one prior conviction in the previous ten years, whilst 14% had over ten previous convictions (Table 21).
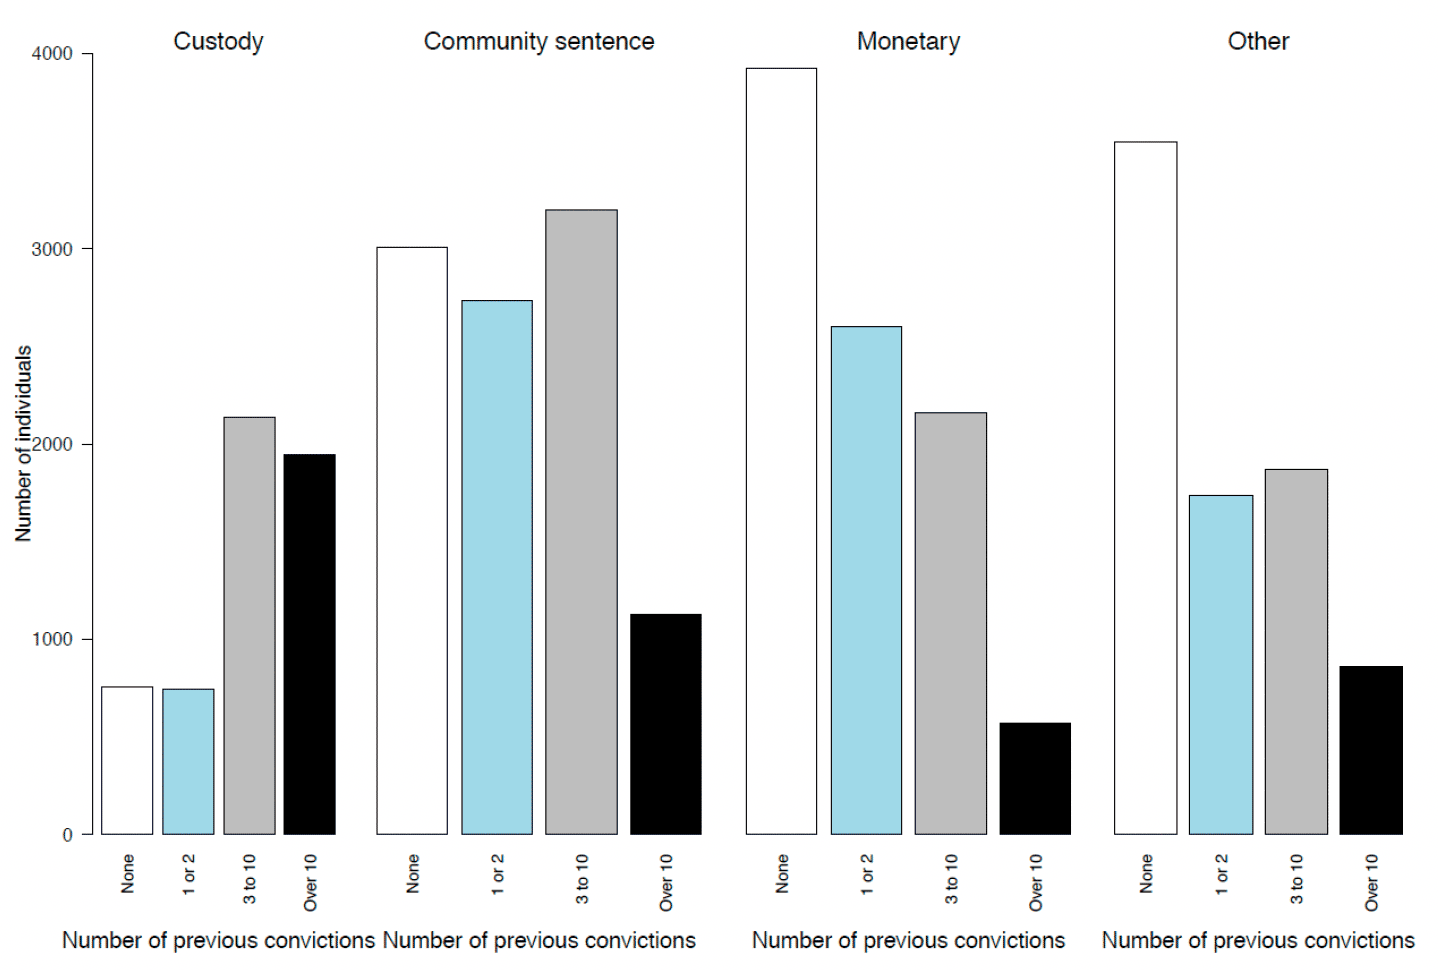
Consistent with the findings of previous Reconviction Rates in Scotland publications, sentencing is influenced by offending history as well as the circumstances of a particular case. Table 20 and Chart 13 show that:
- First time offenders tend to get monetary disposals (35% of first time offenders) or other disposal such as caution/admonition (32%). Community sentences account for 27% and custodial sentences for 7% of sentences for first time offenders.
- Sporadic offenders with one or two convictions in the past 10 years tend to get community sentences (35%), monetary disposals (33%), or other disposal (22%). Custodial sentences account for 9%.
- Those with a several convictions in the past 10 years (between 3 and 10 convictions) are somewhat more likely to get a custodial sentence (23%) than those with fewer previous convictions, although more get community sentences (34%) and a similar number get monetary disposals (23%).
- Those with more than 10 convictions in the past 10 years tend to get custodial sentences (43%).
The number of prior convictions for serious offences is strongly linked to the likelihood of getting a custodial sentence: 11% of those with no prior solemn convictions (i.e. in the high or sheriff solemn court) get a custodial sentence, rising to 38% for those with 1 or 2 solemn convictions and 66% for those with 3 to 10 solemn convictions.
Over the past 10 years there has been very little change in the proportion of prolific offenders (Table 21). Fourteen percent of offenders in 2010-11 had over 10 previous convictions in the previous ten years and the figure has fluctuated between 13% and 14% over the last decade, with 14% of offenders in 2019-20 having over ten previous convictions in the previous ten years.
Contact
Email: Justice_Analysts@gov.scot