Public attitudes to coronavirus: November update
This report presents findings from polling work, conducted between March and August 2021, on public attitudes to the coronavirus pandemic in Scotland.
6. Vaccines
The vaccination programme was underway throughout the period from March to August. At the beginning of March (2-3), 37% of respondents had received their first Covid vaccine and 2% had received both a first and second dose. At 1-2 June, over half of respondents had received both vaccines and by 24-25 August, 85% of respondents had received both doses,.
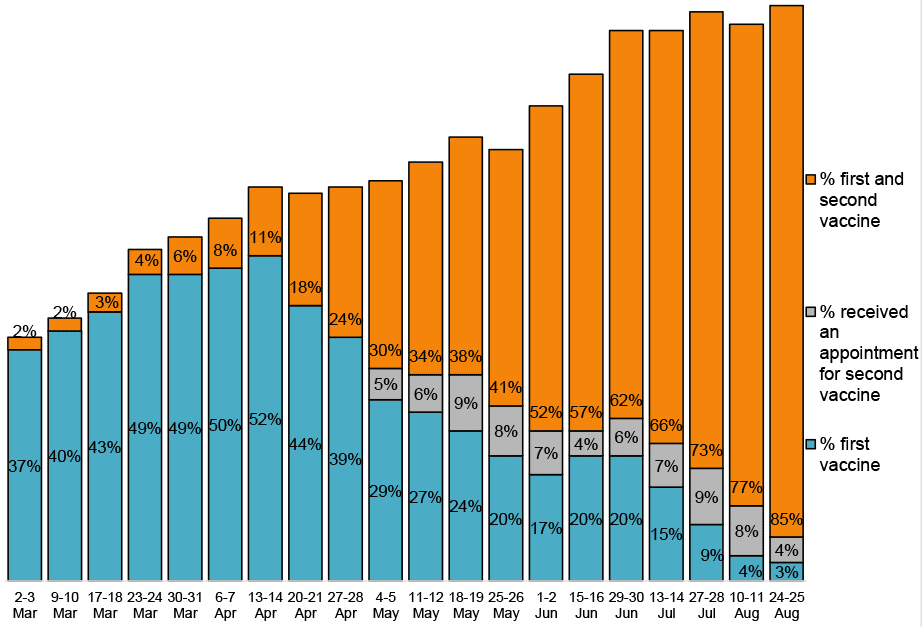
Source: YouGov Scotland survey. Base: Adults (n=807-1055)
**Note response “I have received an invitation for second vaccination, but have not yet been vaccinated” added from 4-5 May
Respondents who had not received either a first or second vaccine were asked, on a scale of 0-10, how likely or unlikely they were to be vaccinated for Coronavirus when a vaccine became available to them. If respondents had already received a first vaccination, they were asked how likely or unlikely they were to have their second. As shown in Figure 32, at the beginning of March 87% of respondents said they would be highly likely (score 8-10) to be vaccinated. 3% of respondents said they would be highly unlikely (score 0-2) to be vaccinated and 9% were undecided (scoring either 3-7 or ‘don’t know’). From March through to mid-June over 8 in 10 respondents continued to score 8-10 on their willingness to receive a vaccine. From mid-June onwards, the proportion of respondents who said they were highly unlikely to be vaccinated (score 0-2) increased. However, of note, the sample size reduced as there were increasingly fewer respondents who had yet to receive a first or second vaccine (from 383 respondents in mid-June to 80 respondents at the end of August).
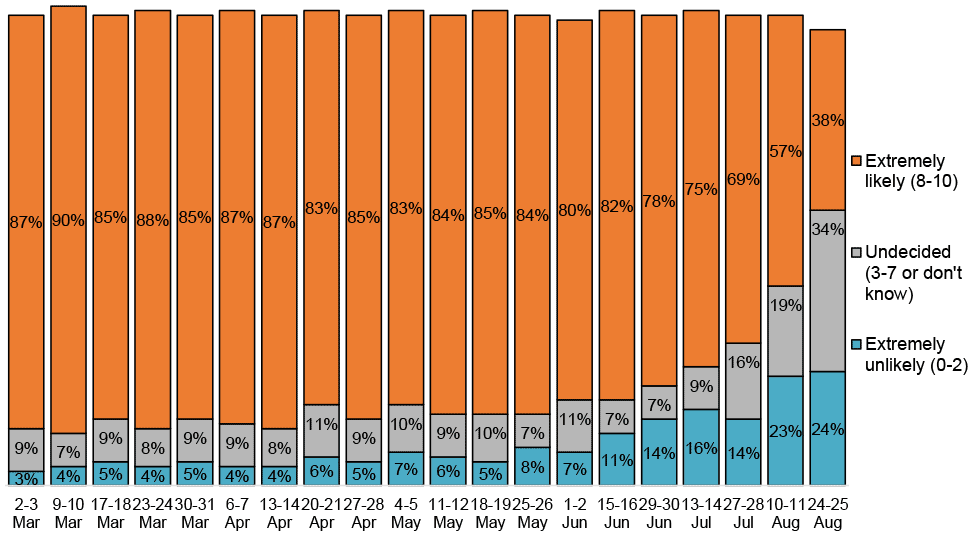
Source: YouGov Scotland survey. Base: Adults who are awaiting either their 1st or their 2nd vaccination (n=80-988)
On 21-22 April, respondents who had said they would be extremely unlikely, or undecided about getting a Covid vaccination (score 0-7) were asked why they were unlikely to get a vaccine. 47% of respondents were concerned about the safety of the vaccines, although of note, this was based on a low sample size (n=92).
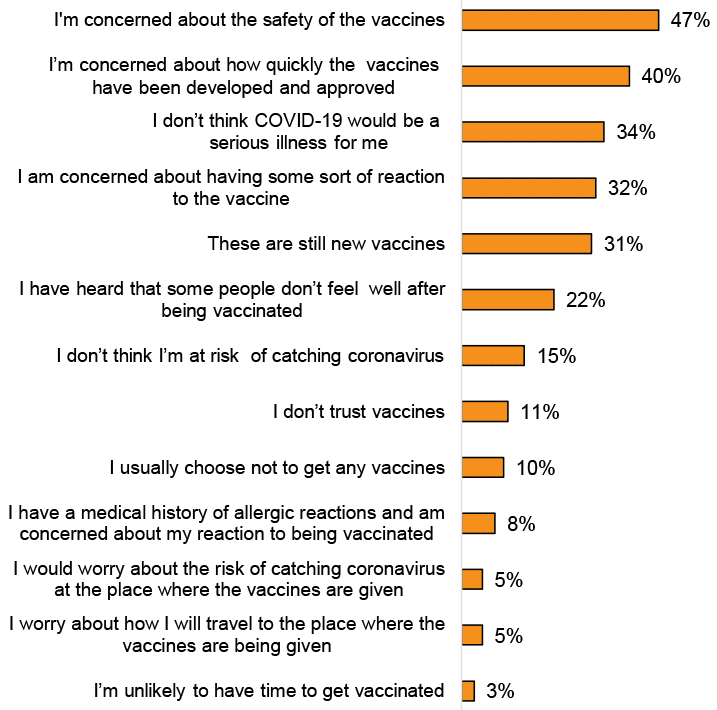
Source: YouGov Scotland survey. Base: Adults ranked 0-7 on likelihood to get a vaccine (n=92) 20-21 Apr
Certification
At 24-25 August, respondents were asked their views about a possible Covid certification scheme for access to venues such as stadiums, arenas and nightclubs.
74% of respondents (excluding those who selected not applicable) either ‘tend to’ or ‘strongly’ agree that they would be happy to use a certificate if it allowed them entry to such a venue. 62% agree a scheme would make them feel more comfortable attending a venue or event. However, 67% agreed they were worried that the system was not fool-proof, and 50% agreed that even if vaccinated they would prefer that everyone do a test beforehand, rather than sharing vaccination status.
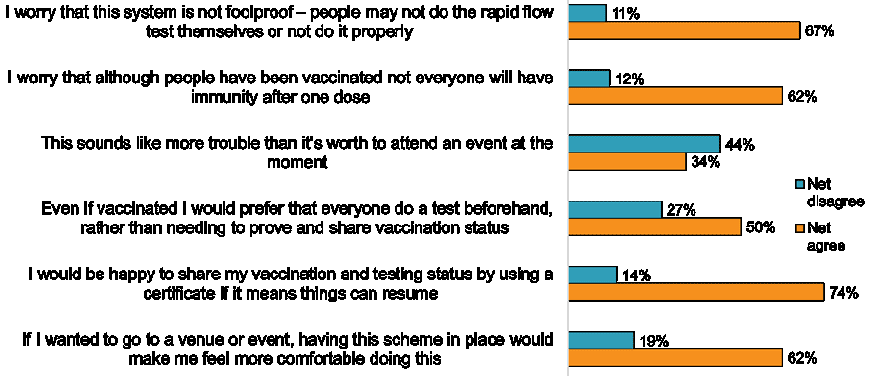
Source: YouGov Scotland survey. Base: Adults (excluding N/A)(n=799-846)
As shown in Figure 35, respondents were also asked how likely they would be to download and use an app which could offer digital proof of Covid vaccination and/or outcome of a recent PCR Test to enable entry to certain venues, allow participation in certain activities or allow international travel. 55% of respondents reported that they definitely/probably would, and 23% of respondents would definitely/probably not, download and use an app.
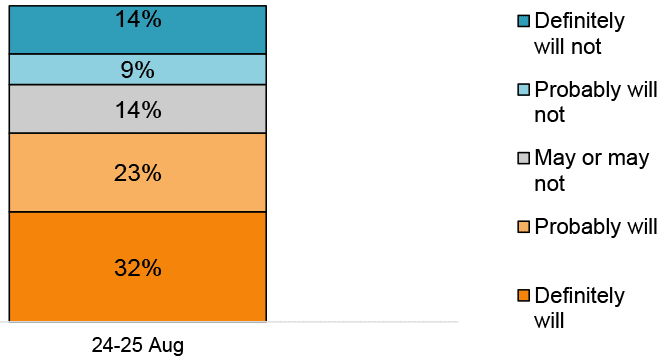
Source: YouGov Scotland survey. Base: Adults (n=1007)
Contact
Email: covid-19.behaviours@gov.scot