
Pesticide usage in Scotland: Grassland and Fodder Crops 2025
This publication presents information from a survey of pesticide use on Grassland and Fodder crops in Scotland in 2025.
Integrated Pest Management
The UK Pesticides National Action Plan published in 2025 [10] defines Integrated Pest Management (IPM) as a holistic approach which:
- carefully considers all available plant protection methods and uses appropriate measures to (a) discourage the development of populations of harmful organisms (which includes invertebrates, diseases and weeds), or (b) control an established population
- keeps the use of plant protection products and other forms of intervention to levels that are ecologically and economically justified
- minimises risks to human health and the environment
Encouraging the uptake of IPM is one of the main objectives of the UK Pesticides National Action Plan.
Information about uptake of IPM measures by Scottish growers was collected alongside the 2025 grassland and fodder crop pesticide usage survey. IPM data have previously been collected and published for all crop groups in our cycle of pesticide usage surveys, the most recent being (vegetable crops 2023, protected edible crops 2023, arable crops 2020, soft fruit crops 2024 and fodder crops 2021). Our intention is to monitor IPM uptake in each crop sector every four years. This 2025 IPM survey represents the third in the series of surveys of IPM measures on fodder crops, allowing the adoption of IPM techniques to be monitored. These datasets will be used as an indicator of the success of Scottish Government funded IPM research, knowledge transfer and promotion activities.
It should be noted that in the main pesticide usage survey two samples are drawn, one based on holdings cultivating fodder crops (from which data are collected by personal interview) and another of holdings cultivating grass (from which data are collected by postal form, see Sampling and data collection). These dual samples ensure that both fodder crops and Scotland’s large grass area are adequately represented in the sample. The IPM data presented here were collected only from the fodder proportion of the sample. This reflects that this data collection is more suited to personal interview than postal return and it ensures methodological consistency with previous IPM surveys. The fodder holdings surveyed also included grassland and the survey covers the IPM measures implemented on all grass and fodder production on those farms.
Unlike the other statistics in this report, the figures reported in this section are not raised to produce national estimates. The figures in this report represent only the responses of those surveyed. The IPM sample, whilst smaller than that sampled for the pesticide usage survey, provides a representation of Scottish regions and farm size groups.
Pearson chi-square tests were used to assess statistical evidence for changes for the main categories, with permutation tests used when expected values were five or less. When comparing between 2021 and 2025, and 2017 and 2025, any evidence of a statistical change in the proportion of growers reporting under a category is indicated by a p-value.
Terminology for translating p-values into degree of evidence: > 0.05 = none, < 0.05 = some, < 0.01 = strong, < 0.001 = very strong. Any other notable differences that might indicate a direction of travel are also recorded in the text. If no comparison is made, then the responses recorded are similar between 2021 and 2025 or 2017 and 2025.
Data were collected from 142 farmers representing 143 holdings during the 2025 survey collectively growing 49,782 ha of crops (2,405 ha of fodder, 23,805 ha of grass and 23,571 ha of rough grazing). This sample represents 14% of Scotland’s 2025 census fodder crop area, 1.8% of the grass area and 0.9% of the rough grazing area. There was a 10% reduction in response rate when compared to the previous survey and a 19% increase when compared to 2017.
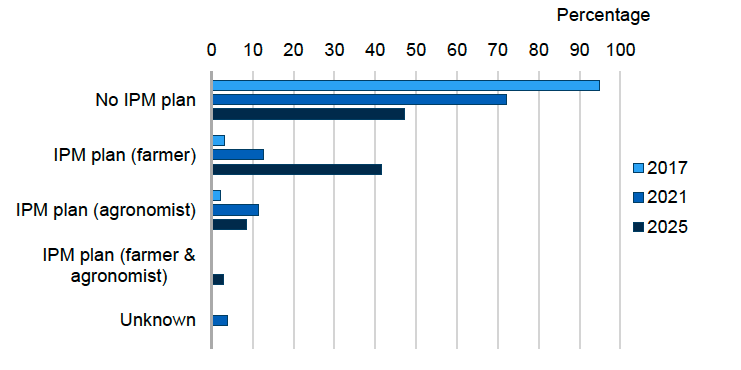
Of the growers who responded, 53% completed an IPM plan, either by themselves, by their agronomist or in collaboration with them (Figure 42). There was very strong statistical evidence of an increase in the proportion of growers reporting they completed an IPM plan from 2017 to 2025 (53% in 2025, 24% in 2021 and 5% in 2017) (2017 to 2025 chi-squared test: p-value <0.001, 2021 to 2025 chi-squared test: p-value <0.001). Using an IPM plan helps growers make the best possible, and most sustainable, use of all available methods for pest control. Completing an IPM plan is now a requirement of several farm assurance schemes in the UK.
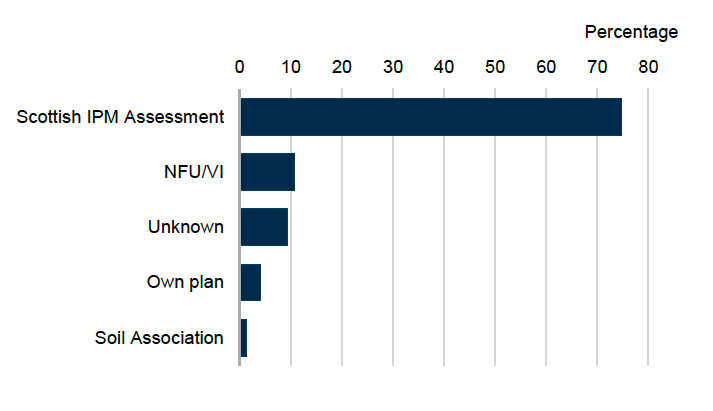
Of the growers who had an IPM plan in 2025, 75% used the Scottish IPM assessment plan, a questionnaire used to measure and encourage the adoption of IPM on Scottish farms.11% used the National Farmers’ Union/Voluntary Initiative plan, 9% were unsure of the plan type used, 4% used their own (in house) plan and 1% used the Soil Association plan (Figure 43). Since 2025, completion of IPM plans is one of the baseline activities that farmers can choose to complete as part of their Whole Farm Plan [12] (a Whole Farm Plan is a requirement to qualify for the basic farm payment). This may have contributed to the recent increase in some farmers completing plans.
Growers were asked about their IPM activities in relation to three categories: risk management, pest monitoring and pest control. Information was collected about all activities each grower conducted in relation to these categories and the responses are reported in the following sections. The term ‘pest’ is used throughout to denote diseases, weeds and invertebrate pests.
Risk management
The aim of an IPM program is to decrease or prevent pest damage reducing or negating the need for subsequent control. An overview of risk management activities implemented by the growers surveyed in 2025, 2021 and 2017 is shown in Table N.
There was strong evidence for statistical change in the proportion of growers using risk management techniques over the course of these surveys (chi-squared test: p-value <0.01). In 2025 and 2021, all growers sampled implemented at least one IPM risk management activity, increasing from 97% in 2017.
| Risk management activity | Percentage yes responses 2025 (n=142) | Percentage yes responses 2021 (n=158) | Percentage yes responses 2017 (n=119) | Percentage change 2021 to 2025 | Percentage change 2017 to 2025 |
|---|---|---|---|---|---|
| Crop rotation | 81 | 78 | 65 | 4 | 25 |
| Soil testing | 98 | 87 | 84 | 12 | 16 |
| Cultivation of seed bed to reduce pest risk | 91 | 89 | 82 | 3 | 11 |
| Cultivation at sowing to reduce pest risk | 44 | 42 | 48 | 5 | -9 |
| Varietal or seed choice to reduce pest risk | 53 | 69 | 51 | -23 | 3 |
| Catch or cover cropping | 39 | 27 | 9 | 48 | 327 |
| Protection or enhancement of beneficial organism populations | 85 | 73 | 57 | 16 | 48 |
| Hygiene measures | 40 | 61 | [x] | -34 | [z] |
| Any risk management activity | 100 | 100 | 97 | 0 | 3 |
Table N footnote: Some shorthand is used in this table: [x]= not available [z] = not applicable. For statistical evidence and p-values see Table 24 in the supporting document. There was evidence for statistical change across six of the above risk management categories from 2021 to 2025 or 2017 to 2025.
The use of crop rotation to manage pests showed a strong increase between 2025 and 2017 but no change when comparing 2025 to 2021 (2017 to 2025 chi-squared test: p-value <0.01, 2021 to 2025 chi-squared test: p-value >0.05).
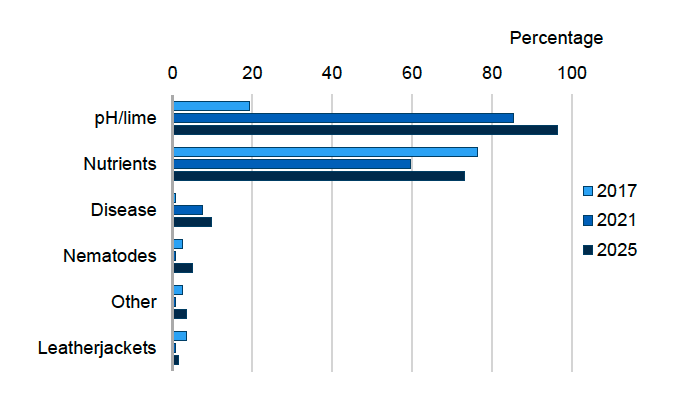
Figure 44 footnote: In 2017, growers were not directly asked about testing for pH or lime, therefore the 2017 data may be an underestimate. In 2025 other included testing for organic matter, satellite soil testing and carbon testing, in 2021 other included a carbon test and in 2017 other included testing for wheat bulb fly, worm testing and soil mapping.
Overall, there was strong evidence of an increase in the proportion of growers performing soil testing over the three surveys (98% in 2025, 87% in 2021 and 84% in 2017) (chi-squared test: p-value <0.01). Most soil testing encountered in 2025 was for pH or lime (96% in 2025, 85% in 2021 and 19% in 2017) (Figure 44). Growers testing for nutrients decreased between 2017 and 2021 but increased to similar levels in 2025 (73% in 2025, 59% in 2021 and 76% in 2017). Testing for disease increased over the survey period (10% in 2025, 8% in 2021 and 1% in 2017 respectively). Other soil tests are shown in Figure 44.
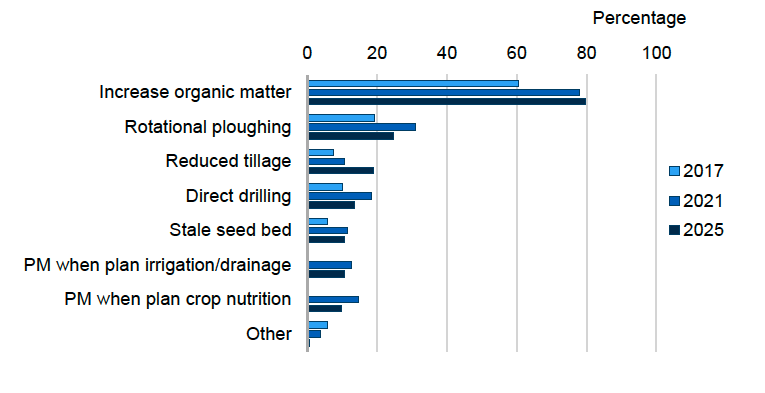
Figure 45 footnote: In 2025 other included using an Ovlac shallow plough that retains nutrients/soil organic matter at surface but buries weed seeds, in 2021, other included using mechanical methods (rolling) for leatherjacket control and in 2017, other included using mechanical methods for slug (harrowing and rolling) and leatherjacket (rolling) control and liming soil. In 2017, consider pest management (PM) when planning crop nutrition was not asked.
The majority of growers reported using seed bed cultivation to reduce pest risk (91% in 2025, 89% in 2021 and 82% in 2017) but there was no evidence for a change in proportion of those reporting such methods over the last three surveys (chi-squared test: p-value >0.05). The most widely used activity was increasing soil organic matter to improve moisture retention and soil structure (80% in 2025, 78% in 2021 and 61% in 2017). Various establishment systems were also observed to increase compared with 2017, the most widely used being rotational ploughing between periods of non-inversion cultivation (25% in 2025, 31% in 2021 and 19% in 2017) followed by reduced tillage (19% in 2025, 11% in 2021 and 8% in 2017), direct drilling of seed (13% in 2025, 18% in 2021 and 10% in 2017) and use of stale seed beds (11% in 2025 and 2021 and 6% in 2017). Such techniques play a major role in soil health and nutrient cycling. Remaining types of seed bed cultivations are shown in Figure 45.
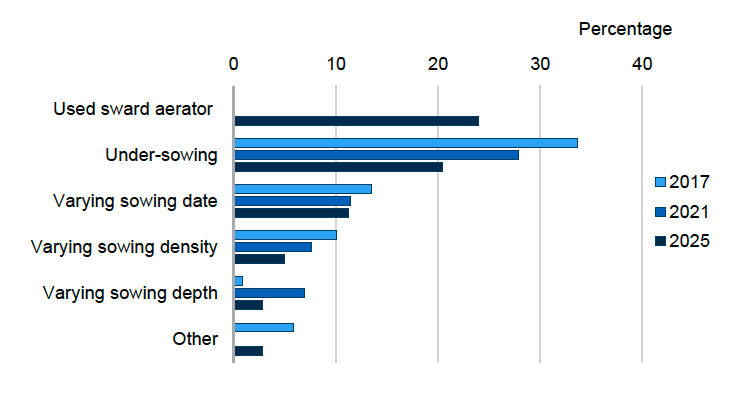
Figure 46 footnote: In 2025 other included using a sub-soiler to alleviate compaction in sub-surface layers (over 10cm) and in 2017 other included using mechanical methods for slug (harrowing and rolling) and leatherjacket (rolling) control and liming soil. In 2017 and 2021 growers were not asked about sward aeration.
There was no evidence of change in the proportion of growers reporting the use of cultivations at sowing to reduce pest risk across the 2017 to 2025 survey period (44% in 2025, 42% in 2021 and 48% in 2017) (chi-squared test: p-value >0.05). There was a decrease in the percentage of growers under-sowing their fodder crops (20% in 2025, 28% in 2021 and 34% in 2017). This will be influenced by factors such as their crop rotation schedule and stocking densities. Varying sowing date and density decreased over the period of the three surveys as shown in Figure 46. These factors are influenced by seasonal factors. For the first time in this survey farmers were asked if they used a sward aerator. Such machinery assists in reducing compaction (<10 cm depth). Compacted areas can often lead to poor drainage, increased weed infestation and lower nutrient uptake resulting in reduced grass growth.
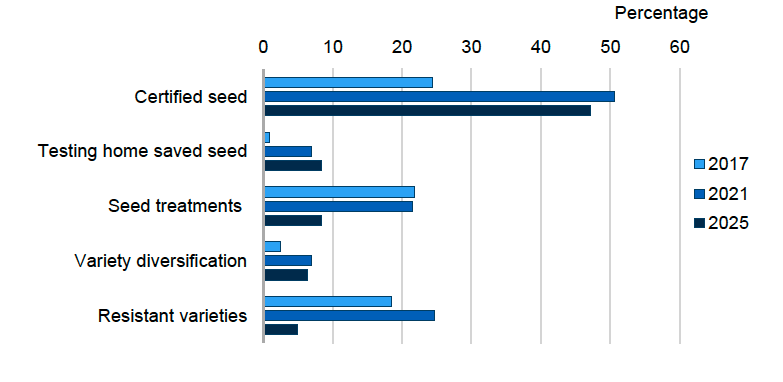
There was strong evidence of change in the proportion of growers who considered varietal or seed choice to reduce pest risk between survey years (53% in 2025, 69% in 2021 and 51% in 2017) (chi-squared test: p-value <0.01). As in previous surveys certified seed was the most reported option used to reduce pest activity (47% in 2025, 51% in 2021 and 24% in 2017). The proportion of growers who tested their home saved seed was similar in 2021 and 2025 but remained higher than that reported in 2017 (8% in 2025, 7% in 2021 and 1% in 2017). Using certified seed or testing home saved seed helps ensure seed meets the required quality standards and is pathogen free. Conversely use of seed treatments reduced across the survey period (8% in 2025, 22% in 2021 and 2017). As discussed in the preceding pesticide usage survey, several seed treatment actives and products have been withdrawn in recent years, leaving growers with less seed treatment options. Use of variety diversification and resistant varieties decreased between 2021 and 2025 after having increased between 2017 and 2021 (Figure 47).
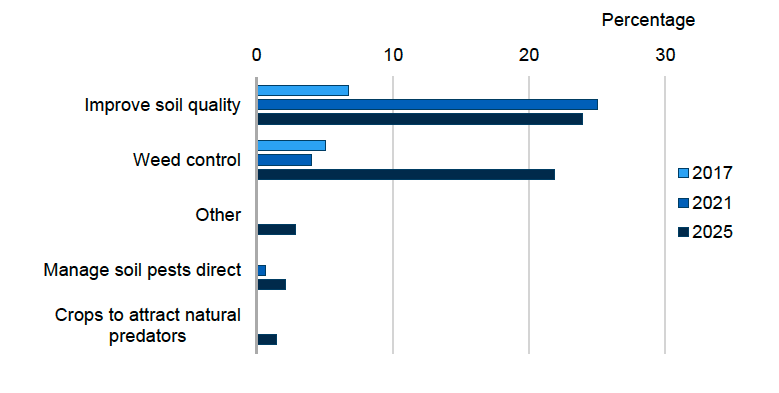
Figure 48 footnote: In 2025 other included used as feed, game cover and to increase biodiversity on farm.
There was very strong evidence the proportion of growers using catch and cover cropping increased in 2025 compared with 2017 and some evidence when compared to 2021 (39% in 2025, 27% in 2021 and 9% in 2017) (2017 to 2025 chi-squared test: p-value <0.001, 2021 to 2025 chi-squared test: p-value <0.05). In 2025 the majority of growers who used catch or cover crops used to improve soil quality and supress weeds (24% and 22% respectively). Various crops were used to increase soil quality including nitrogen fixing crops, crops ploughed in as a green manure and crops grown over winter to prevent soil erosion. Other reasons can be seen in Figure 48.
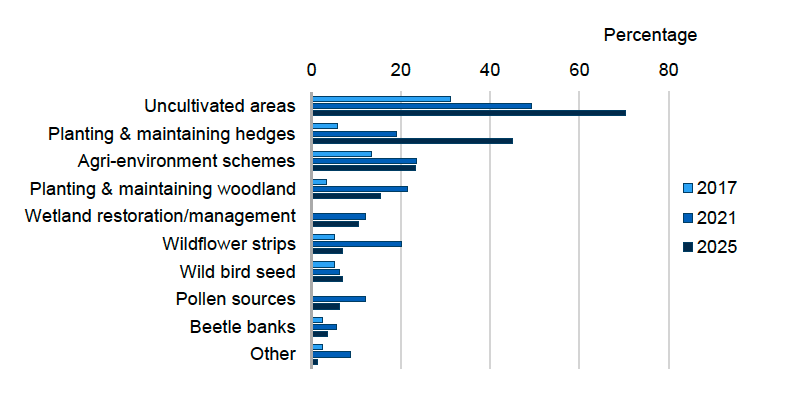
Figure 49 footnote: In 2025 other included upland grazing and field margins. In 2021, other included Ecological Focus Areas, keeps bees, retain winter stubbles, species rich grassland and wildlife corridor, and in 2017, other included conservation grazing, protecting ground nesting birds and maintenance of ponds. In 2017, growers were not specifically asked about planting & maintaining woodland, hedges or wetland restoration/management, therefore 2017 figures may be underestimated.
There was very strong evidence that the proportion of growers protecting or enhancing beneficial organism populations to reduce pest risk increased between 2017 and 2025, and some statistical evidence of an increase between 2021 and 2025 (85% in 2025, 73% in 2021 and 57% in 2017) (2017 to 2025 chi-squared test: p-value <0.001, 2021 to 2025 chi-squared test: p-value <0.05). Uncultivated areas (70% in 2025, 49% in 2021 and 31% in 2017), maintenance and planting of hedges (45% in 2025, 19% in 2021 and 6% in 2017) and sowing seed for wild birds (7% in 2025, 6% in 2021 and 5% in 2017) all increased over the survey years. The remaining methods (planting & maintaining woodland, wetland restoration/management, wildflower strips, pollen sources and beetle banks) all decreased in comparison to 2021 but were higher than in 2017 (Figure 49).
There was some evidence for an increase in membership of an agri-environment scheme amongst growers between 2017 and 2025 but none between 2021 and 2025 (23% in 2025, 23% in 2021 and 13% in 2017) (2021 to 2025 chi-squared test: p-value >0.05, 2017 to 2025 chi-squared test: p-value <0.05). The Scottish Government agri-environment scheme (AECS) was the main scheme specified in 2025 (19%), others included Leaf (4%) and the Soil Association (2%).
The crop hygiene question was not asked in 2017 but there was very strong evidence for a decrease in growers reporting this form of management between 2021 and 2025 (chi-squared test: p-value <0.001). Crop hygiene measures showed a reduction between 2021 and 2025 (40% in 2025, 61% in 2021). In addition, 3% said they cleaned machinery yearly rather than between fields and 1% said they were unaware of the hygiene regime as they used a contractor for field work.
Pest monitoring
Within IPM programmes, pest populations are monitored to assess whether control measures are economically justified and to ensure that any interventions are appropriately targeted. Monitoring and accurate pest identification support informed control decisions, particularly when used alongside established action thresholds. Table O presents an overview of the pest monitoring measures adopted by those growers surveyed in 2017, 2021 and 2025. There was strong evidence of statistical change in the proportion of growers conducting pest monitoring activities between the three survey years (chi-squared test: p-value <0.01) with at least one pest monitoring activity undertaken by 93% of the respondents in 2025.
| Pest monitoring activity | Percentage yes responses 2025 (n=142) | Percentage yes responses 2021 (n=158) | Percentage yes responses 2017 (=119) | Percentage change 2021 to 2025 | Percentage change 2017 to 2025 |
|---|---|---|---|---|---|
| Monitor and identify pests | 90 | 94 | 93 | -4 | -3 |
| Regular monitoring of crop growth stage | 66 | 77 | 81 | -14 | -18 |
| Setting action thresholds for crops | 35 | 34 | 18 | 3 | 90 |
| Use of specialist diagnostics | 12 | 22 | 17 | -44 | -29 |
| Any pest monitoring activity | 93 | 100 | 94 | -7 | -1 |
Table O footnote: For statistical evidence and p-values see Table 25 in the supporting document. There was evidence for statistical change across three of the above risk management categories from 2021 to 2025 or 2017 to 2025.
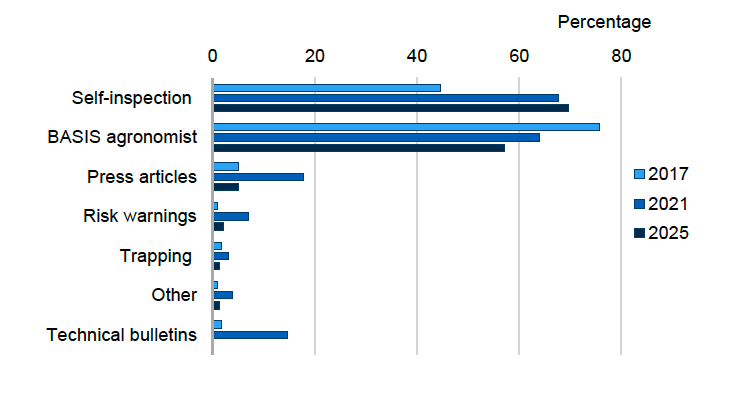
Figure 50 footnote: In 2025 other included SAC advice and distributor provides information, in 2021 other included information from other farmers and growers, social media and engage with experts. In 2017, other included attend SRUC advice scheme discussion group.
There was no evidence of statistical change in the proportion of growers reporting monitoring and identifying pests (90% in 2025, 94% in 2021 and 93% in 2017) (2021 to 2025 chi-squared test: p-value >0.05, 2017 to 2025 chi-squared test: p-value >0.05). The most commonly used method for pest monitoring was self-inspection (70% in 2025, 68% in 2021 and 45% in 2017). The use of a BASIS agronomist to monitor crops for pests has decreased over the three surveys (57% in 2025, 64% in 2021 and 76% in 2017). Other monitoring and identifying pest methods can be seen in Figure 50.
Regular monitoring of crop growth stage has seen a steady decrease over all three surveys (2021 to 2025 chi-squared test: p-value <0.05, 2017 to 2025 chi-squared test: p-value <0.05). However, there was strong evidence for an increase in the proportion of growers setting action thresholds for crops between 2017 and 2025 but none between 2021 and 2025 (35% in 2025, 34% in 2021 and 18% in 2017) (2021 to 2025 chi-squared test: p-value >0.05, 2017 to 2025 chi-squared test: p-value <0.01). This is lower than the uptake of setting action thresholds in other cropping systems, reflecting the lower pesticide input to grass and fodder crops. The threshold level at which pests become an economic threat (e.g. a certain density per plant or unit area at a pre-determined crop growth stage) is critical to guide pest control decisions.
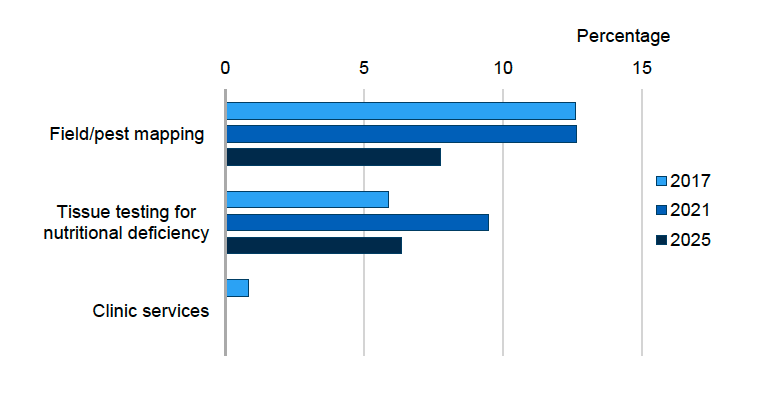
There was some evidence for an increase in the proportion of growers reporting the use of specialist diagnostics between 2021 and 2025 but no evidence of change between 2017 and 2021 (12% in 2025, 22% in 2021 and 17% in 2019) (2021 to 2025 chi-squared test: p-value <0.05, 2017 to 2025 chi-squared test: p-value >0.05).
The primary specialist diagnostic tool used was field/pest mapping (8% in 2025, 13% in 2021 and 2017), followed by tissue testing for nutritional deficiencies (6% in 2025, 9% in 2021 and 6% in 2017). Clinic services were only reported in 2017 at 1% (Figure 51).
Pest control
If monitoring, identification and action thresholds indicate that pest control is required, and preventive methods are no longer effective or available, IPM programs evaluate the best control method in relation to effectiveness and risk. Control programmes incorporate non-chemical methods alongside, or instead of, chemical control. Use of chemical pest control should be as targeted as possible and the risk of resistance development should be minimised. The effectiveness of the control programme should be reviewed regularly to gauge success and improve their regime as necessary. Table P presents an overview of the pest control measures adopted by the growers surveyed and the percentage change between 2017 and 2025.
In 2025, there was no evidence of statistical change in the proportion of growers conducting pest control between the last two surveys (chi-squared test: p-value > 0.05) and only some evidence between 2017 and 2025 (chi-squared test: p-value <0.05). The majority of growers sampled in 2025, 2021 and 2017 adopted at least one IPM pest control activity.
| Pest control activity | Percentage yes responses 2025 (n=142) | Percentage yes responses 2021 (n=158) | Percentage yes responses 2017 (=119) | Percentage change 2021 to 2025 | Percentage change 2017 to 2025 |
|---|---|---|---|---|---|
| Non-chemical control used in partnership or instead of chemical control | 96 | 100 | 87 | -4 | 10 |
| Monitor success of crop protection methods | 77 | 84 | 82 | -8 | -6 |
| Targeted pesticide application | 39 | 35 | 51 | 11 | -24 |
| Follow anti-resistance strategies | 38 | 16 | 39 | 131 | -2 |
| Any pest control activity | 99 | 100 | 97 | -1 | 1 |
Table P footnote: For statistical evidence and p-values see Table 26 in the supporting document. There was evidence for statistical change across three of the above risk management categories from 2017 to 2025 and two from 2021 to 2025.
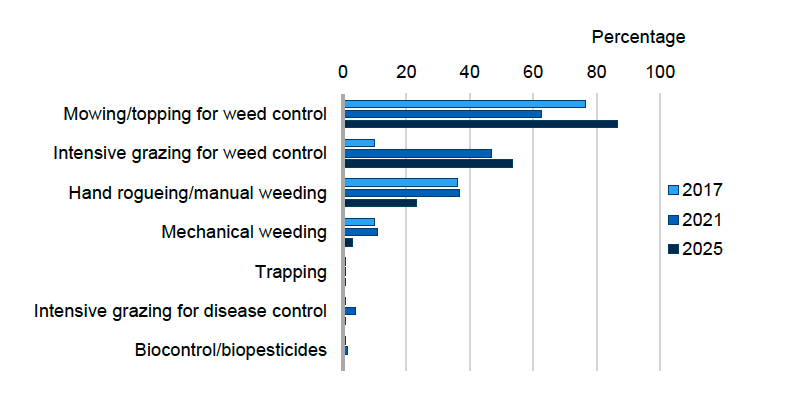
In 2025 and 2021, there was an increase in the proportion of growers using non-chemical control with or instead of chemical control when compared to 2017 (96% in 2025, 100% in 2021 and 87% in 2017) (2021 to 2025 chi-squared test: p-value <0.05, 2017 to 2025 chi-squared test: p-value <0.01). It is worth noting that of the holdings sampled in 2025, 15% were organic, an increase from the 8% in 2021 and 4% in 2017. The most common non-chemical method employed in 2025 was the use of mowing/topping for weed control, used by 87% of growers in 2025, an increase from 63% in 2021 and 76% in 2017. The use of intensive grazing for weed control increased across the three surveys (54% in 2025, 47% in 2021 and 10% in 2017). In contrast, the use of hand rogueing/manual weeding reduced over the same period (23% in 2025, 37% in 2021 and 36% in 2017). Other non-chemical methods of control are shown in Figure 52.
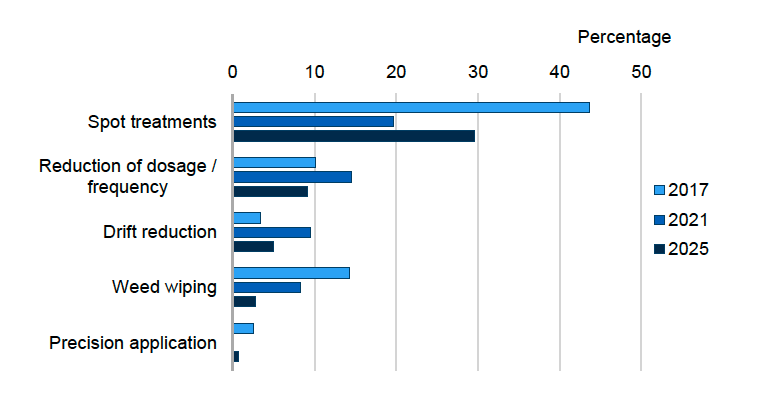
Targeted pesticide application showed a decrease in 2025 and 2021 when compared to 2017 (39% in 2025, 35% in 2021 and 51% in 2017) (2021 to 2025 chi-squared test: p-value >0.05, 2017 to 2025 chi-squared test: p-value <0.05).
There was a decrease in use of all targeted pesticide application methods since the previous survey in 2021, with the exception of the use of spot treatments which increased in 2025 when compared to 2021, but still less than in 2017 (30% in 2025, 20% in 2021 and 44% in 2017). The proportion of growers reducing the dosage/frequency of applications was lower in 2025 than in 2021 and 2017 (9% in 2025, 15% in 2021 and 10% in 2017). This could be linked to an overall reduction in pesticide applications on fodder and grass crops in the 2025 pesticide survey. Other targeted pesticide applications are shown in Figure 53.
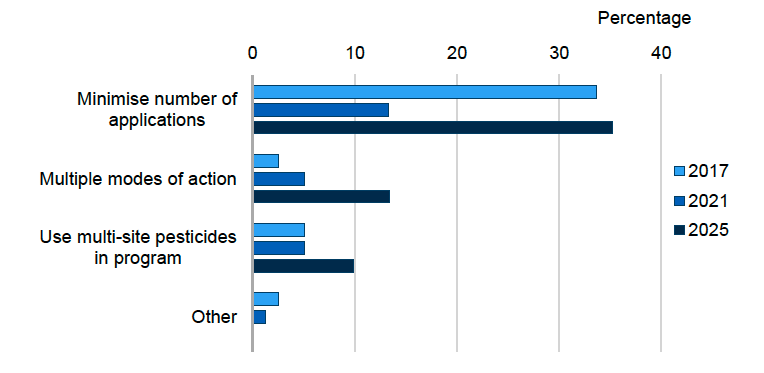
Figure 54 footnote: In 2021, other included taking advice from agronomist. Other in 2017 included taking advice from agronomist and following advice from SRUC consulting.
There was very strong evidence of an increase in the proportion of growers stating they followed anti-resistance strategies between 2021 and 2025 (38% in 2025, 16% in 2021 and 39% in 2017) (2021 to 2025 chi-squared test: p-value <0.001, 2017 to 2025 chi-squared test: p-value <0.001). Anti-resistance strategies are used to minimise the risk of development of pest resistance. There was an increase in the use of all the main anti-resistance strategy methods compared with the previous two surveys, including minimising the number of applications, using multiple modes of action and use of multi-site pesticides (Figure 54). Minimising the number of applications remains the main anti-resistance strategy used (35% in 2025, 13% in 2021 and 34% in 2017).
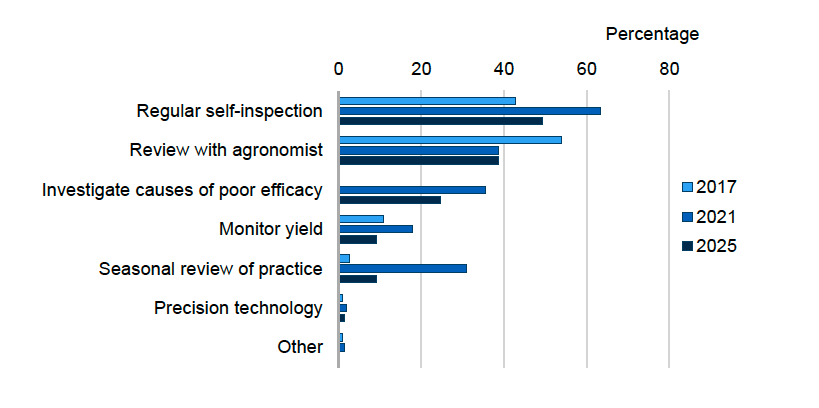
Figure 55 footnote: In 2017 other was uses GPS and in 2021 monitoring crop input costs.
An important aspect of IPM is monitoring the success of risk management and crop protection practices to continually improve regimes. There was no evidence for change in the proportion of growers monitoring success of their crop protection methods (77% in 2025, 84% in 2021 and 82% in 2017) (chi-squared test: p-value >0.05). The principal method used by growers to monitor crop protection success was regular self-inspection, which decreased compared with the previous survey in 2021 but was higher than in 2017 (49% in 2025, 63% in 2021 and 43% in 2017). The proportion of growers who reported they used an agronomist to assist in reviewing management efficacy remained constant between 2025 and 2021 (39%), decreasing from 2017 (54%). Other methods can be seen in Figure 55.
Contact
Email: psu@sasa.gov.scot