
Pesticide usage in Scotland: Grassland and Fodder Crops 2025
This publication presents information from a survey of pesticide use on Grassland and Fodder crops in Scotland in 2025.
Estimated pesticide usage
Direct sown grass
- An estimated 20,930 hectares of direct sown grass were grown in Scotland in 2025, a 17% decrease since 2021
- 25% of the crop was treated with a pesticide
- Pesticides were applied to 6,980 treated hectares with 7,336 kilograms of pesticide applied in total
- Over 99% of pesticides applied by area were herbicides and less than 1% were molluscicides
- Direct sown grass received on average 1.1 pesticide applications (supporting document Table 1). These applications included 1.1 herbicides applied to 25% of the crop area
- Herbicides were predominately applied in April and June and all molluscicide applications applied in June (Figure 19)
- Reasons for herbicide applications were specified for 90% of total use, 25% for general weed control, 18% for grass destruction,15% for the control of thistles, 11% for docks, 9% for chickweed, 3% for annual broad-leaved weeds, 3% for crop destruction, 2% each for nettles and buttercups and 1% for ragwort. The remaining 2% was for control of day-nettle, as a stubble clean up and charlock
| Pesticide group | Formulation area treated (ha) | Weight of pesticides applied (kg) | Percentage of crop treated (%) | Top three most used formulations (ha) |
|---|---|---|---|---|
| Herbicides | 6,947 | 7,335 | 25 | Glyphosate (2,656), MCPA (985),2,4-D/MCPA (886) |
| Molluscicides | 33 | 1 | < 0.5 | Ferric Phosphate (33) |
| All pesticides | 6,980 | 7,336 | 25 | Glyphosate (2,656), MCPA (985), 2,4-D/MCPA (886) |
For details of all pesticide use on direct sown grass, please refer to the supporting document.
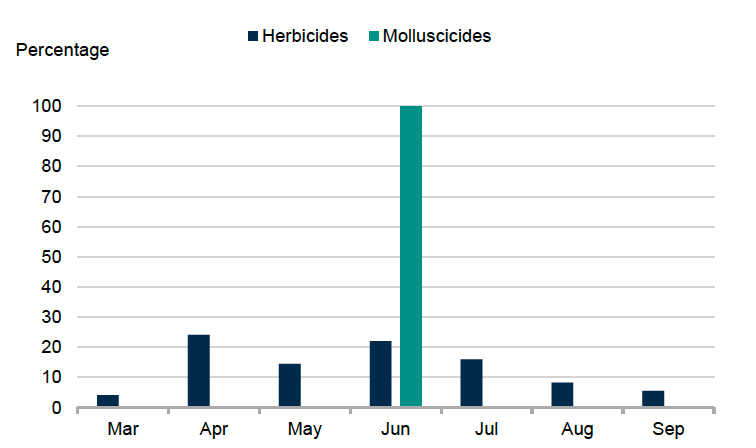
Figure 19 footnote: Herbicide use was 5% in August 2024 and less than 1% in October 2024 and have been excluded from the figure.
Undersown grass
- An estimated 6,739 hectares of undersown grass was grown in Scotland in 2025, a decrease of 27% from 2021
- 37% of the crop was treated with a pesticide
- Pesticides were applied to 5,703 treated hectares with 1,605 kilograms of pesticide applied in total
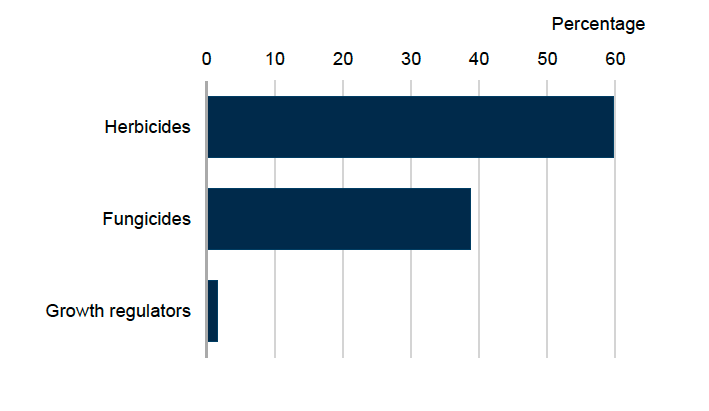
- Undersown grass received on average 1.1 pesticide applications (supporting document Table 1). These applications included 1.3 fungicide and 1.0 herbicide applications (applied to 18% and 32% of the crop area respectively)
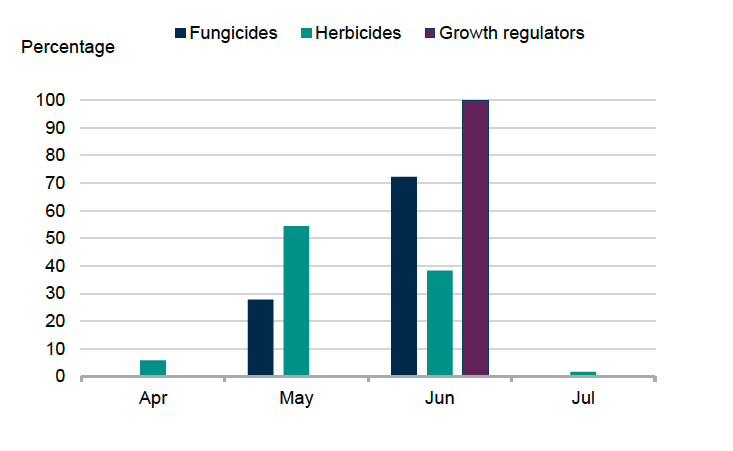
- The majority of herbicides were applied in May, the majority of fungicides and all growth regulator applications were applied in June (Figure 21)
- Reasons for fungicide applications were supplied for 53% of total use; 33% was for rhynchosporium, 14% was for general disease control and 6% for disease precaution
- Reasons for herbicide applications were supplied for 98% of total use; 26% was for broad-leaved weeds, 24% for docks, 18% for general weed control,16% for thistles,10% for nettles and 3% for chickweed
| Pesticide group | Formulation area treated (ha) | Weight of pesticides applied (kg) | Percentage of crop treated (%) | Top three most used formulations (ha) |
|---|---|---|---|---|
| Herbicides | 3,403 | 1,005 | 32 | MCPA (1,088), Amidosulfuron (690), Tribenuron-methyl (479) |
| Fungicides | 2,212 | 590 | 18 | Folpet (644), Prothioconazole (606), Bixafen/prothioconazole/ spiroxamine (473) |
| Growth regulators | 87 | 10 | 1 | 2-Chloroethylphosphonic acid (87) |
| All pesticides | 5,703 | 1,605 | 37 | MCPA (1,088), Amidosulfuron (690), Folpet (644) |
For details of all pesticide use on undersown grass, please refer to the supporting document.
Grassland one to four years old
- An estimated 134,784 hectares of grassland between one and four years old were grown in Scotland in 2025, a decrease of 5% since 2021
- 6% of the crop was treated with a pesticide
- Pesticides were applied to 8,848 treated hectares with 5,126 kilograms of pesticide applied in total
- 100% of the total area of pesticides applied by area were herbicides
- Herbicide applications were predominately applied in May (Figure 22)
- Reasons were supplied for 82% of herbicide use, 41% was for the control of docks, 16% for thistle control (including creeping thistle), 14% for general weed control, 3% was for the control of nettles and 2% each for ragwort, broad-leaved weeds, chickweed and grass destruction
| Pesticide group | Formulation area treated (ha) | Weight of pesticides applied (kg) | Percentage of crop treated (%) | Top three most used formulations (ha) |
|---|---|---|---|---|
| Herbicides | 8,848 | 5,126 | 6 | Fluroxypyr (2,493), Fluroxypyr/triclopyr (1,540), Amidosulfuron/ florpyrauxifen-benzyl (1,273) |
| All pesticides | 8,848 | 5,126 | 6 | Fluroxypyr (2,493), Fluroxypyr/triclopyr (1,540), Amidosulfuron/ florpyrauxifen-benzyl (1,273) |
For details of all pesticide use on grass one to four years old, please refer to the supporting document.
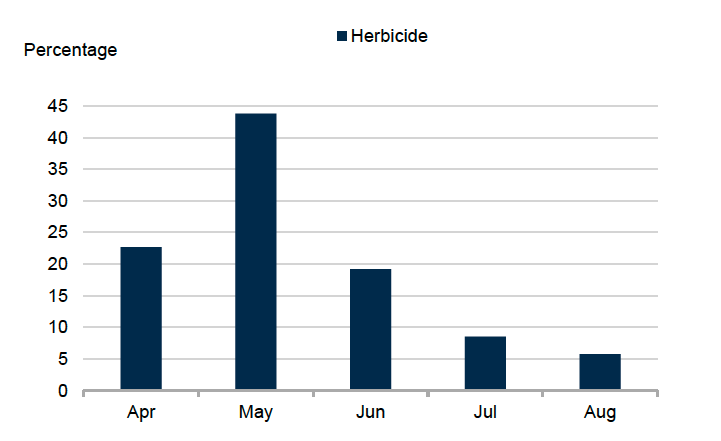
Figure 22 footnote: Herbicide use was less than 1% in September and has been excluded from the figure.
Grass over five years old
- An estimated 1,156,032 hectares of grass over five years old were grown in Scotland in 2025, an increase of 2% since 2021
- 4% of the crop was treated with a pesticide
- Pesticides were applied to 49,733 treated hectares with 42,178 kilograms of pesticide applied in total
- 100% of the total area of pesticides applied by area were herbicides
- Herbicide applications were predominately applied in May (Figure 23)
- Reasons were supplied for 97% of herbicide use, 35% was for the control of docks, 22% for thistle control (including creeping thistle), 11% was for rushes, 10% for ragwort, 5% each for general weed control and nettles, 3% for buttercups, 2% each for chickweed and broad-leaved weeds and 1% for grass destruction. The remaining 2% was for the control of dandelions, horsetails, bracken, volunteer kale, reeds and daisies
| Pesticide group | Formulation area treated (ha) | Weight of pesticides applied (kg) | Percentage of crop treated (%) | Top three most used formulations (ha) |
|---|---|---|---|---|
| Herbicides | 49,733 | 42,178 | 4 | Fluroxypyr (10,341), MCPA (7,671), Aminopyralid/triclopyr (6,346) |
| All pesticides | 49,733 | 42,178 | 4 | Fluroxypyr (10,341), MCPA (7,671), Aminopyralid/triclopyr (6,346) |
For details of all pesticide use on grass over five years old, please refer to the supporting document.
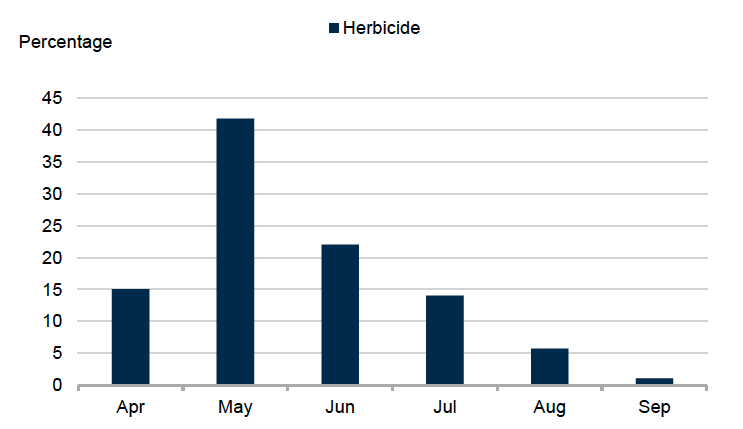
Figure 23 footnote: Herbicide use was less than 1% in August 2024 and March 2025 and have been excluded from the figure.
Rough grazing
- An estimated 2,681,176 hectares of rough grazing were grown in Scotland in 2025, a decrease of 13% since 2021
- Less than 0.05% of the crop was treated with a pesticide
- Pesticides were applied to 834 treated hectares with 923 kilograms of pesticide applied in total
- 100% of the total area of pesticides applied by area were herbicides
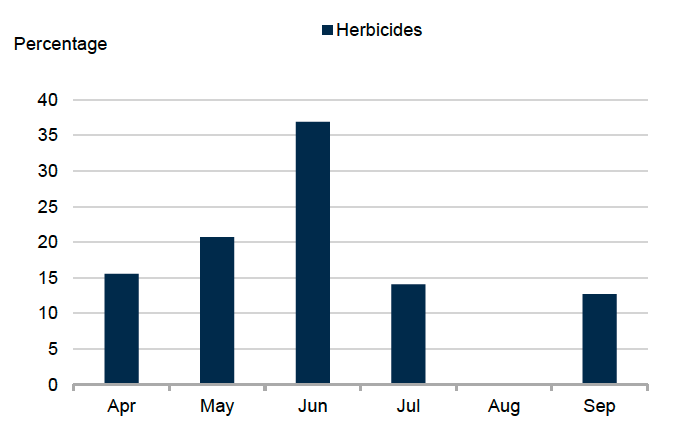
- Herbicide applications were predominately applied in June (Figure 24)
- Reasons were supplied for 100% of herbicide use, 40% was for the control of rushes, 25% for nettles, 21% for the control of ragwort, 13% for gorse and 2% for creeping thistle
| Pesticide group | Formulation area treated (ha) | Weight of pesticides applied (kg) | Percentage of crop treated (%) | Top three most used formulations (ha) |
|---|---|---|---|---|
| Herbicides | 834 | 923 | < 0.5 | MCPA (233), Glyphosate (211), 2,4-D/dicamba (173) |
| All pesticides | 834 | 923 | < 0.5 | MCPA (233), Glyphosate (211), 2,4-D/dicamba (173) |
For details of all pesticide use on rough grazing, please refer to the supporting document.
Arable silage
- An estimated 5,056 hectares of arable silage were grown in Scotland in 2025, a decrease of 7% since 2021
- Arable silage is recorded in the other crops for stockfeeding category of the Agricultural Census
- Crops grown for arable silage included barley, oats, peas, vetch, bere barley, buckwheat, ryegrass and wheat, some of which were undersown
- 26% of the crop was treated with a pesticide
- Pesticides were applied to 4,004 treated hectares with 1,352 kilograms of pesticide applied in total
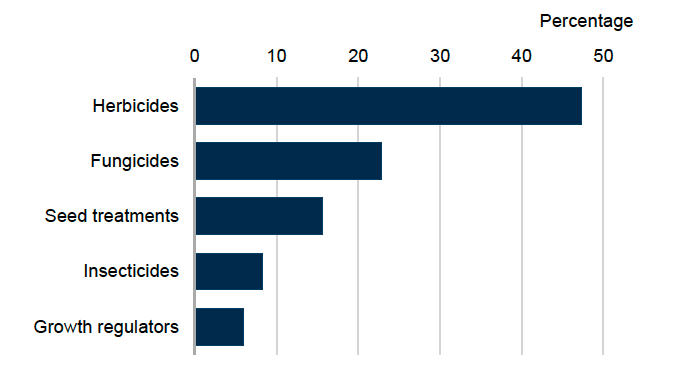
- Arable silage received an average of 1.1 pesticide applications (supporting document Table 1). These included 1.0 herbicide application applied to 24% of the crop area
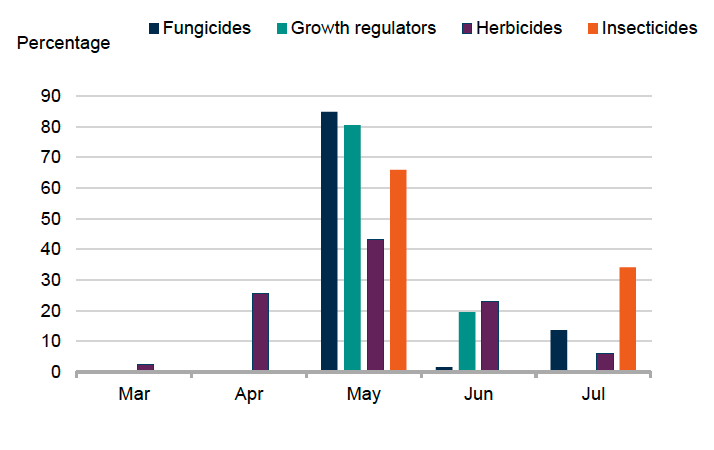
- The majority of fungicides, growth regulators, herbicides and insecticides were applied in May (Figure 26)
- Reasons were supplied for 16% of fungicide use, 14% was for general disease control and 2% for disease precaution
- Reasons were supplied for 73% of herbicide use, 34% was for general weed control, 12% for chickweed, 11% for docks, 7% for thistles, 6% for day-nettle, 4% for annual broad-leaved weeds, 2% each for nettles and grass destruction prior to sowing and less than 1% for control of redshank
- Reasons were supplied for 34% of insecticide use, all for the control of aphids
- The most common variety encountered, when specified, was Laureate (spring barley), accounting for 11% of the sampled area
| Pesticide group | Formulation area treated (ha) | Weight of pesticides applied (kg) | Percentage of crop treated (%) | Top three most used formulations (ha) |
|---|---|---|---|---|
| Herbicides | 1,893 | 1,094 | 24 | Tribenuron-methyl (560), MCPA (440), Glyphosate (306) |
| Fungicides | 915 | 240 | 6 | Folpet (282), Bixafen/prothioconazole/ spiroxamine (239), Prothioconazole/ tebuconazole (230) |
| Seed treatments | 624 | 7 | 12 | Fludioxonil (385), Prothioconazole/ tebuconazole (174), Imazalil/ipconazole (65) |
| Insecticides | 334 | 2 | 7 | Lambda-cyhalothrin (334) |
| Growth regulators | 239 | 9 | 5 | Trinexapac-ethyl (239) |
| All pesticides | 4,004 | 1,352 | 24 | Tribenuron-methyl (560), MCPA (440), Fludioxonil (385) |
For details of all pesticide use on arable silage, please refer to the supporting document.
Fodder beet
- An estimated 1,143 hectares of fodder beet were grown in Scotland in 2025, a decrease of 4% since 2021
- 60% of the crop was treated with a pesticide
- Pesticides were applied to 5,094 treated hectares with 2,099 kilograms of pesticide applied in total
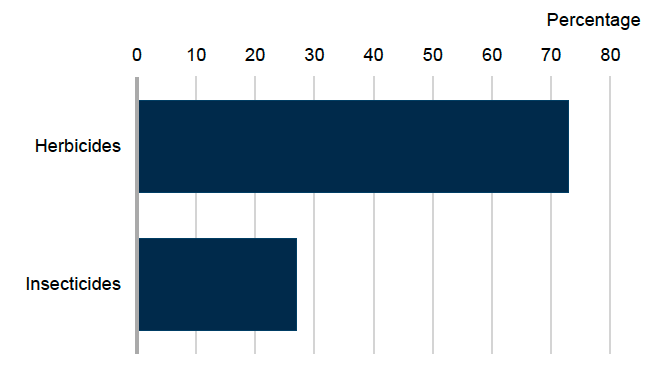
- Fodder beet received an average 3.2 pesticide applications (supporting document Table 1). These applications included 2.8 herbicides and 1.0 insecticide (applied to 59% and 29% of the crop area respectively)
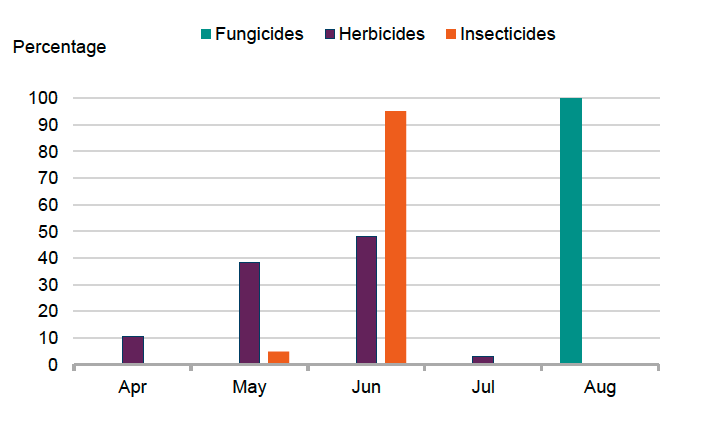
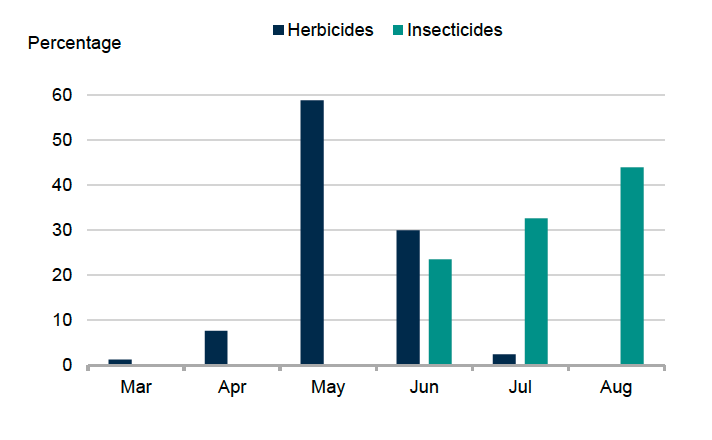
- Herbicides were predominately applied in June. The majority of insecticides were applied in June and all fungicide applications were in August (Figure 28)
- Reasons were supplied for 82% of herbicide use, 42% was for general weed control, 33% for annual broad-leaved weeds, 6% for control of annual meadow grass and less than 1% for volunteer rape
- No reasons were supplied for fungicide use
- Reasons were supplied for 81% of insecticide use, 76% was for mangold fly and 5% for flea beetle control
- The most common variety encountered when specified, was Monro, accounting for 15% of the sampled area
| Pesticide group | Formulation area treated (ha) | Weight of pesticides applied (kg) | Percentage of crop treated (%) | Top three most used formulations (ha) |
|---|---|---|---|---|
| Herbicides | 4,124 | 2,060 | 59 | Metamitron (779), Triflusulfuron-methyl (741), Ethofumesate/ phenmedipham (671) |
| Seed treatments | 626 | 30 | 31 | Hymexazol (358), Tefluthrin (255), Fludioxonil/sedaxane (13) |
| Insecticides | 328 | 5 | 29 | Lambda-cyhalothrin (286), Flonicamid (42) |
| Fungicides | 16 | 4 | 1 | Azoxystrobin/ difenoconazole (16) |
| All pesticides | 5,094 | 2,099 | 60 | Metamitron (779), Triflusulfuron-methyl (741), Ethofumesate/ phenmedipham (671) |
For details of all pesticide use on fodder beet, please refer to the supporting document
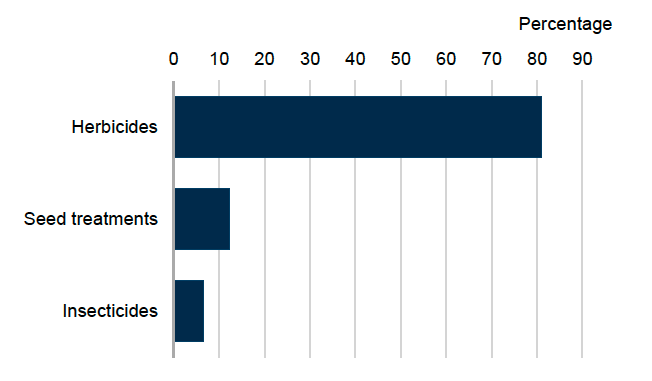
Figure 27 footnote: Fungicides were applied to less than 1% and were excluded from the figure
Fodder rape
- An estimated 1,881 hectares of fodder rape were grown in Scotland in 2025, a decrease of 16% since 2021
- It is estimated that 43 per cent of the fodder rape encountered was mixed with another crop such as kale or stubble turnips
- A further 385 hectares of fodder rape were recorded in fodder crop mixes in the other fodder category (see the other fodder section for details)
- 58% of the crop was treated with a pesticide
- Pesticides were applied to 1,176 treated hectares with 1,719 kilograms of pesticide applied in total
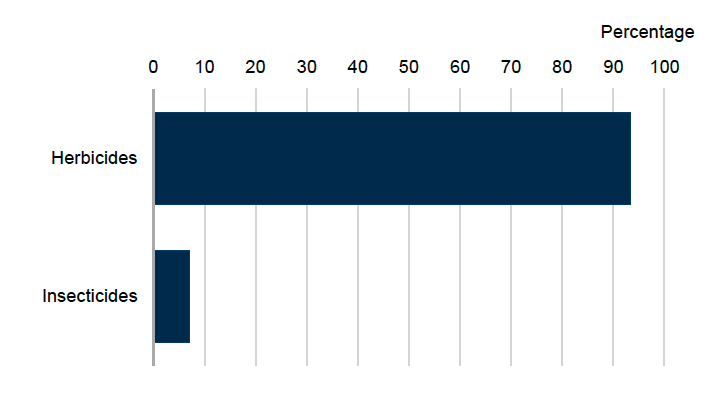
- Fodder rape received an average 1.0 pesticide application (supporting document Table 1). This included 1.0 herbicide application applied to 54% of the crop area
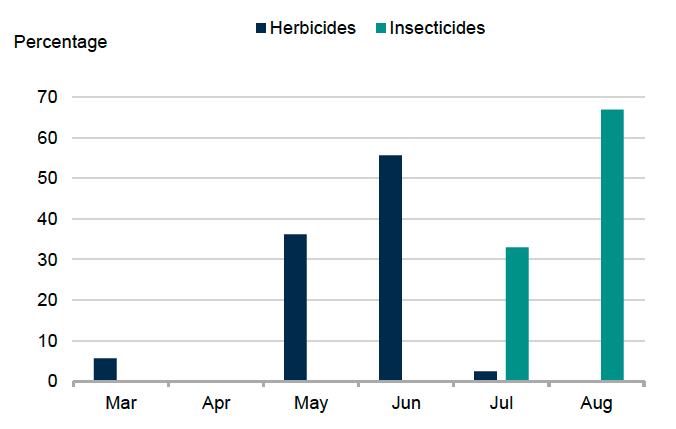
- The majority of herbicides were applied in June and the majority of insecticide applications occurred in August (Figure 30)
- Reasons were supplied for 93% of herbicide use, 46% was for grass destruction, 31% for general weed control and 15% for crop destruction
- Reasons were supplied for 100% of insecticide use, all for the control of flea beetle
- The most common variety encountered when specified, was Redstart, accounting for 24% of the sampled area
| Pesticide group | Formulation area treated (ha) | Weight of pesticides applied (kg) | Percentage of crop treated (%) | Top three most used formulations (ha) |
|---|---|---|---|---|
| Herbicides | 1,097 | 1,718 | 54 | Glyphosate (904), Metazachlor (145), 2,4-D/glyphosate (48) |
| Insecticides | 79 | 1 | 4 | Lambda-cyhalothrin (79) |
| All pesticides | 1,176 | 1,719 | 58 | Glyphosate (904), Metazachlor (145), Lambda-cyhalothrin (79) |
For details of all pesticide use on fodder rape, please refer to the supporting document
Kale and cabbage
- 2,016 hectares of kale and cabbage were grown in 2025, a 3% decrease since 2021
- No cabbage was encountered during this survey
- It is estimated that 43% of the kale encountered was mixed with another crop such as fodder rape or turnips
- A further 375 hectares of kale, kale hybrid and kale mixes were recorded in the other fodder category (see the other fodder section for details)
- 44% of the crop was treated with a pesticide
- Pesticides were applied to 1,449 treated hectares with 818 kilograms of pesticide applied in total
- Kale received an average 1.3 pesticide applications (supporting document Table 1). These applications included 1.3 insecticides and 1.0 herbicides (applied to 15% and 39% of the crop area respectively)
- The majority of herbicides were applied in May and insecticides were predominately applied in August (Figure 32)
- Reasons were supplied for 59% of herbicide use, 43% was for general weed control, 9% for grass destruction, 5% for annual broad-leaved weeds and 2% for couch
- Reasons were supplied for 94% of insecticide use, 77% for the control of flea beetle and 17% for caterpillar control
- The most common variety of kale encountered when specified, was Maris Kestrel, accounting for 15% of the sampled area
| Pesticide group | Formulation area treated (ha) | Weight of pesticides applied (kg) | Percentage of crop treated (%) | Top three most used formulations (ha) |
|---|---|---|---|---|
| Herbicides | 1,062 | 814 | 39 | Metazachlor (414), Glyphosate (380), Clomazone (268) |
| Insecticides | 387 | 3 | 15 | Deltamethrin (263), Lambda-cyhalothrin (124) |
| All pesticides | 1,449 | 818 | 44 | Metazachlor (414), Glyphosate (380), Clomazone (268) |
For details of all pesticide use on kale and cabbage, please refer to the supporting document
Maize
- 2,583 hectares of maize were grown in 2025, an 110% increase since 2021
- 87% of the crop was treated with a pesticide
- Pesticides were applied to 8,659 treated hectares with 3,914 kilograms of pesticide applied in total
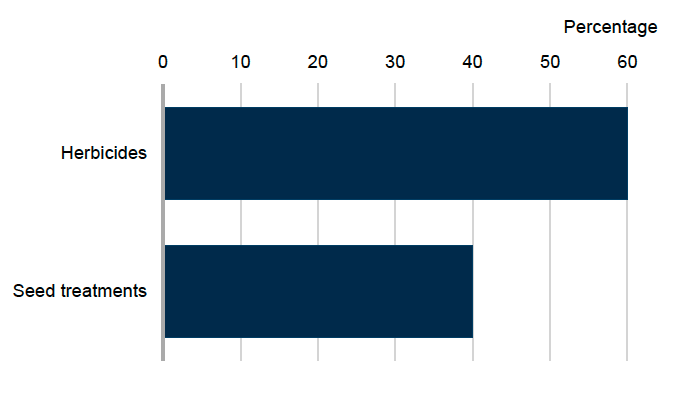
- Maize only received herbicide applications (excluding seed treatments), receiving an average 1.7 herbicide applications (supporting document Table 1)
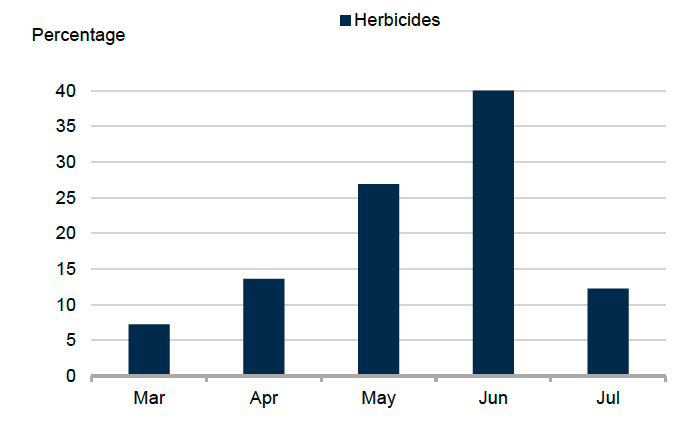
- Herbicides were predominately applied in June (Figure 34)
- Reasons were supplied for 70% of herbicide use, 39% was for general weed control, 22% for annual broad-leaved weeds, 4% for annual meadow grass, 3% for grass destruction, 2% for grass weeds and 1% for couch grass
- The most common variety encountered when specified, was KWS Cito, accounting for 24% of the sampled area
| Pesticide group | Formulation area treated (ha) | Weight of pesticides applied (kg) | Percentage of crop treated (%) | Top three most used formulations (ha) |
|---|---|---|---|---|
| Herbicides | 5,194 | 3,763 | 87 | Pendimethalin (1,458), Mesotrione (1,037), Nicosulfuron (792) |
| Seed treatments | 3,464 | 151 | 69 | Ziram (1,779), Metalaxyl/prothioconazole (1,685) |
| All pesticides | 8,659 | 3,914 | 87 | Ziram (1,779), Metalaxyl/prothioconazole (1,685), Pendimethalin (1,458) |
For details of all pesticide use on maize, please refer to the supporting document. Please note ziram and metalaxyl/prothioconazole have no authorisation in the UK, however, these are approved for use in several EU countries and was recorded on imported maize seed. Imported seed treated with a plant protection product authorised for that use in EU countries were allowed at the time of use.
Stubble turnips
- 643 hectares of stubble turnips were grown in 2025, a 34% increase since 2021
- A further 163 hectares of stubble turnips and stubble turnip mixes were recorded in the other fodder category (see the other fodder section for details)
- Stubble turnips are often a constituent of other fodder mixes and therefore it is likely that the estimated area grown is under-estimated
- 5% of the crop was treated with a pesticide
- Pesticides were applied to 36 treated hectares with 43 kilograms of pesticide applied in total
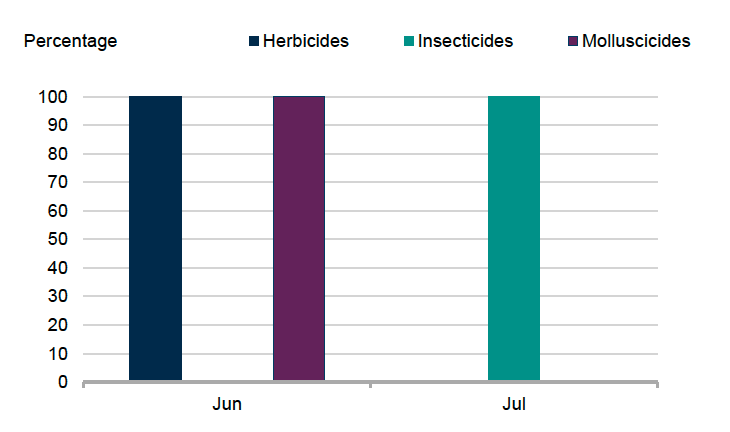
- 100% of herbicides and molluscicides were applied in June and 100% of insecticide applications occurred in July (Figure 36)
- Reasons were supplied for 100% of herbicide use, all for grass destruction prior to sowing
- No reasons were supplied for insecticide use
- The most common variety encountered was Rondo, accounting for 37% of the sampled area
| Pesticide group | Formulation area treated (ha) | Weight of pesticides applied (kg) | Percentage of crop treated (%) | Top three most used formulations (ha) |
|---|---|---|---|---|
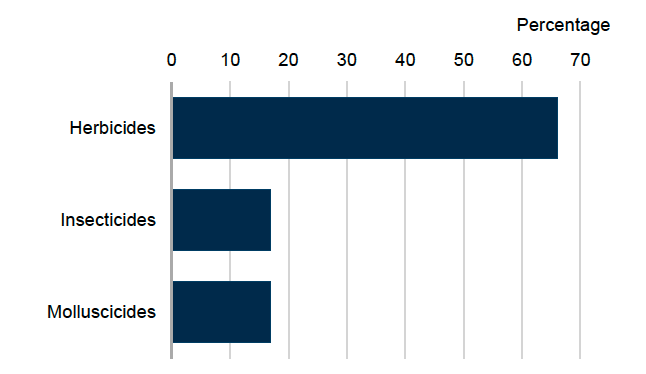
| Herbicides | 24 | 42 | 4 | Glyphosate (24) |
| Insecticides | 6 | < 0.5 | 1 | Lambda-cyhalothrin (6) |
| Molluscicides | 6 | 1 | 1 | Ferric phosphate (6) |
| All pesticides | 36 | 43 | 5 | Glyphosate (24), Lambda-cyhalothrin (6), Ferric phosphate (6) |
For details of all pesticide use on stubble turnips, please refer to the supporting document
Turnips and swedes
- 3,227 hectares of turnips and swedes were grown in 2025, an 8% decrease since 2021
- It is estimated that 77% of the turnips and swedes encountered were mixed with another crop such as fodder rape, kale or stubble turnips
- A further 114 hectares of turnip mixes were recorded in the other fodder category (see the other fodder section for details)
- 54% of the crop was treated with a pesticide
- Pesticides were applied to 2,886 treated hectares with 1,510 kilograms of pesticide applied in total
- Turnips and swedes received an average of 1.4 pesticide applications (supporting document Table 1). These applications included 1.2 insecticide and 1.1 herbicides (applied to 16% and 52% of the crop area respectively)
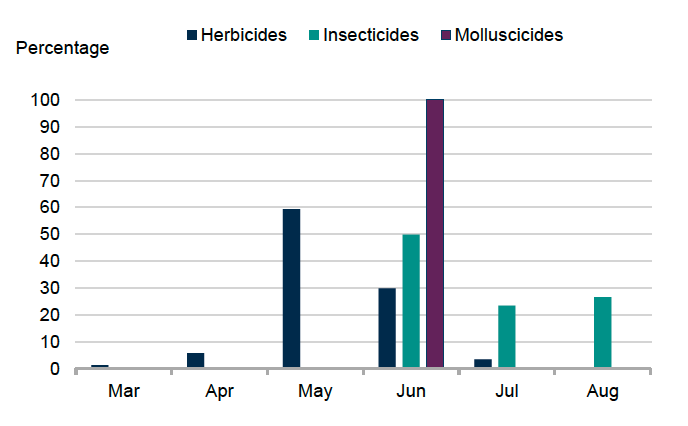
- The majority of herbicides were applied in May. Half of insecticide and all of molluscicide applications were applied in June (Figure 38)
- Reasons were supplied for 74% of herbicide use, 50% was for general weed control, 13% for grass destruction, 4% for fumitory, 3% for fat hen, 2% for annual broad-leaved weeds and 1% for couch
- Reasons were supplied for 59% of insecticide use, 45% for the control of flea beetle, 8% for turnip sawfly and 6% for general insect pest control
- The most common variety encountered was Invitation (swede), accounting for 24% of the sampled area
| Pesticide group | Formulation area treated (ha) | Weight of pesticides applied (kg) | Percentage of crop treated (%) | Top three most used formulations (ha) |
|---|---|---|---|---|
| Herbicides | 2,248 | 1,503 | 52 | Metazachlor (899), Clomazone (539), Glyphosate (512) |
| Insecticides | 619 | 5 | 16 | Deltamethrin (382), Lambda-cyhalothrin (238) |
| Molluscicides | 18 | 2 | 1 | Ferric phosphate (18) |
| All pesticides | 2,886 | 1,510 | 54 | Metazachlor (899), Clomazone (539), Glyphosate (512) |
For details of all pesticide use on turnips and swedes, please refer to the supporting document
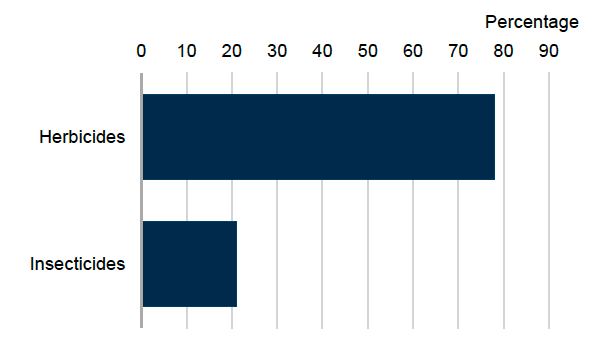
Figure 37 footnote: Molluscicides have been excluded from the figure as the percentage use was less than 1%.
Other fodder crops
- 1,127 hectares of other fodder crops were grown in 2025, a 10% increase since 2021
- Other fodder consists of any crops other than arable silage reported in the other crops for stockfeeding category in the Agricultural Census
- In 2025 this consisted of kale, rye, rape, stubble turnip and fodder crop mixes
- 19% of the crop was treated with a pesticide
- Pesticides were applied to 312 treated hectares with 396 kilograms of pesticide applied in total
- Other fodder crops received an average of 1.5 pesticide applications (supporting document Table 1). These applications included 1.0 herbicide applied to 19% of the crop area respectively
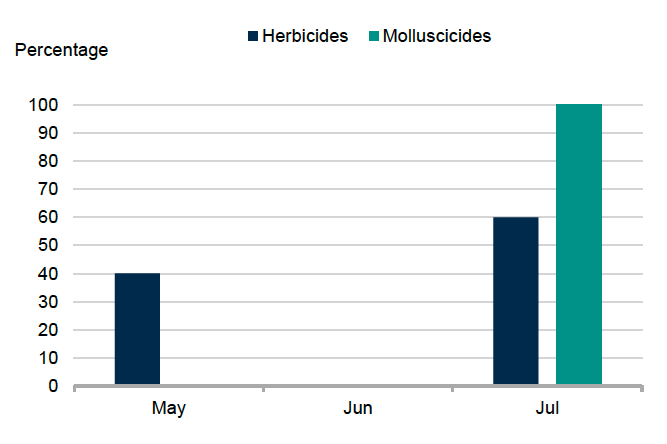
- The majority of herbicides and molluscicides were applied in July (Figure 40)
- Reasons were supplied for 100% of herbicide, all use was for grass destruction
| Pesticide group | Formulation area treated (ha) | Weight of pesticides applied (kg) | Percentage of crop treated (%) | Top three most used formulations (ha) |
|---|---|---|---|---|
| Herbicides | 209 | 381 | 19 | Glyphosate (209) |
| Molluscicides | 104 | 15 | 9 | Ferric phosphate (104) |
| All pesticides | 312 | 396 | 19 | Glyphosate (209), Ferric phosphate (104) |
Other fodder crops include kale, rye, rape, stubble turnip and fodder crop mixes.
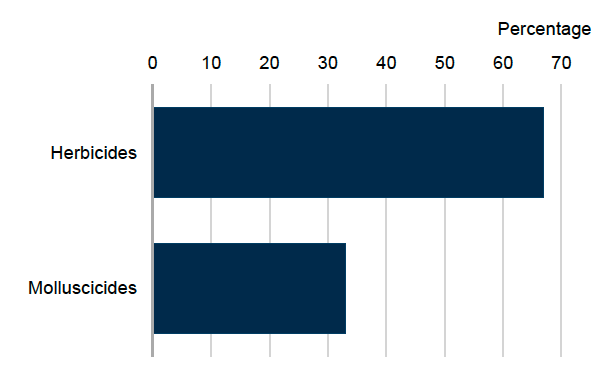
Figure 39 footnote: Other fodder includes kale, rye, rape, stubble turnip and fodder crop mixes.
Contact
Email: psu@sasa.gov.scot