
Pesticide usage in Scotland: Grassland and Fodder Crops 2025
This publication presents information from a survey of pesticide use on Grassland and Fodder crops in Scotland in 2025.
General trends
Crop area of grassland including rough grazing
In 2025 the estimated area of total grassland including rough grazing grown in Scotland was 3,999,656 hectares, this includes an estimate of undersown grass (which is not recorded on the Agricultural Census – further details available in the raising factors and glossary and background sections). This represents a 9% decrease in cropped area since 2021 and an 8% decrease from 2017. Since the last survey, the area of rough grazing, grass under five years (which includes direct sown grass) and undersown grass have decreased (13%, 7% and 27% respectively). The area of grass five years and over increased by 2% since the last survey (Figure 1).
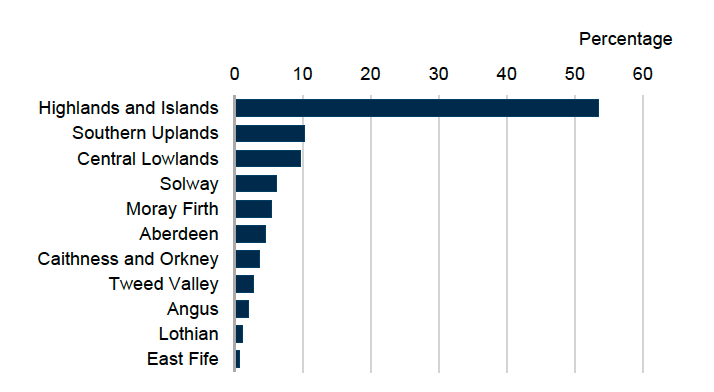
In 2025, as in 2021, rough grazing accounted for 67% of Scottish grassland area. Grass five years old and over accounted for 29%, grass under 5 years old 4% and undersown grass less than 0.5% of the crop area (Figure 2). For full details of census crop areas, see supporting documentation Table 12. The majority of grassland and rough grazing in Scotland is in the Highlands and Islands region (Figure 3).
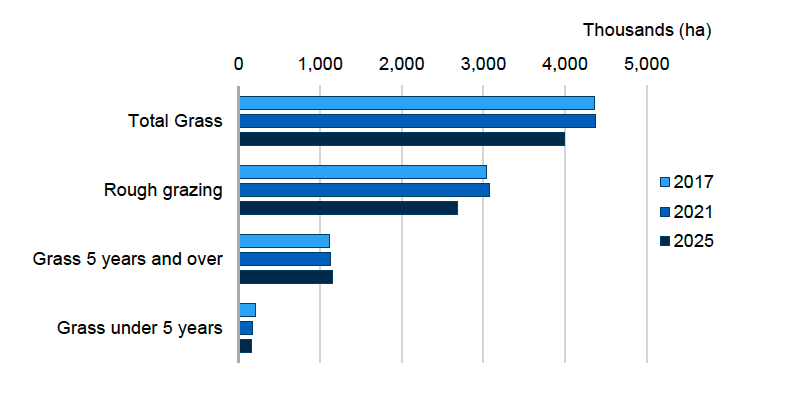
Figure 1 footnote: Total grass includes rough grazing, grass 5 years and over, grass under 5 years old and undersown grass. Grass under 5 years includes grass direct sown and grass 1 to 4 years old. Undersown grass has not been depicted individually in this figure as the area grown is less than 10,000 hectares.
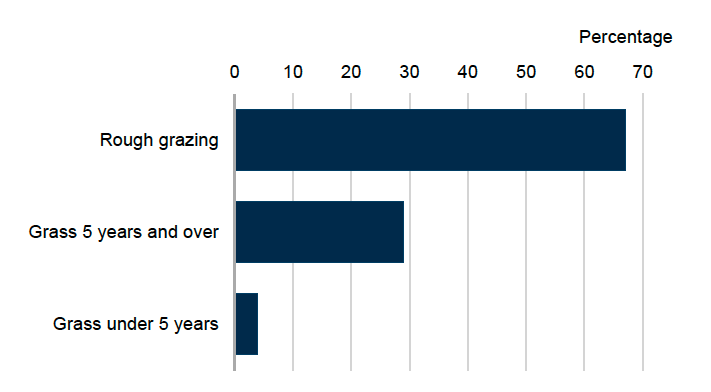
Figure 2 Footnote: Grass under 5 years includes grass one to four years old and direct sown grass. Undersown grass has been excluded from this figure as it represents less than 0.5% of the total area.
Estimated crop area of fodder crops
In 2025 the estimated area of fodder crops grown in Scotland was 17,675 hectares (this includes stubble turnips). This represents a 3% increase in cropped area since 2021 and an 8% increase from 2017. Since the last survey, areas of fodder rape, turnips and swedes, arable silage, fodder beet and kale and cabbage decreased (16%, 8%, 7%, 4% and 3% respectively). Conversely, maize, stubble turnips and other fodder had a 110%, 34% and 10% increase respectively since the last survey (Figure 4 and 5). This increase in maize area is largely driven by the dairy industry demand for forage maize due to its high energy and fibre content [5].
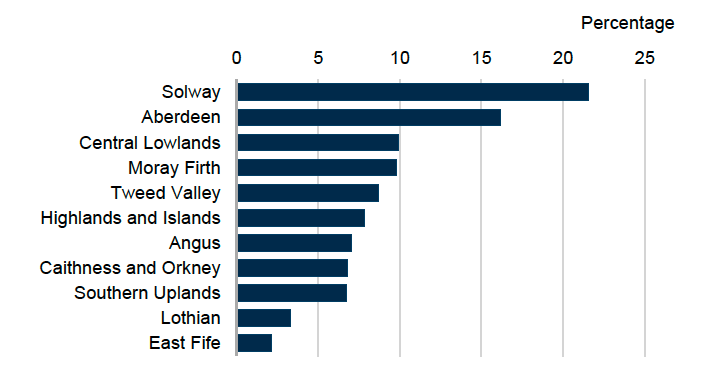
In 2025, arable silage accounted for 29% of the total fodder area, turnips and swedes 18%, maize 15%, kale and cabbage 11%, fodder rape 11%, fodder beet 6%, other fodder 6% and stubble turnips 4%. The distribution of fodder crops within Scotland differs to the pattern seen in 2021 and 2017, with the largest proportion grown in the Solway region (22%, Figure 6), compared to Aberdeen in 2021 (17%) and 2017 (21%). This could be due to the increase in the area of maize grown primarily in Solway where 2,152 ha were grown compared to 431 ha grown across the rest of Scotland in 2025, a 113% increase compared to the 1,010 ha grown in Solway in 2021.
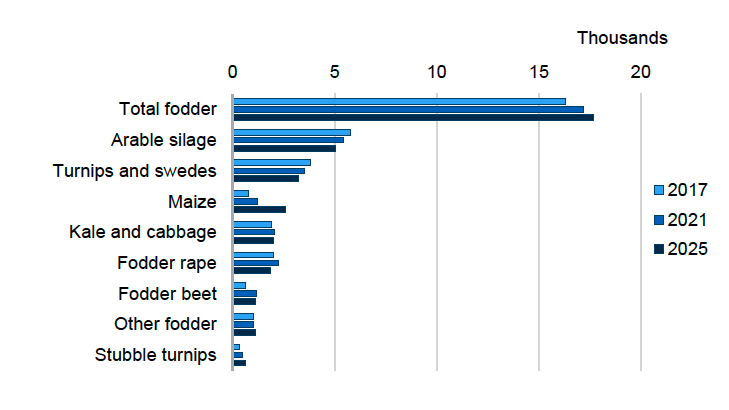
Figure 4 footnote: Other fodder includes kale, rye, rape, stubble turnip and fodder crop mixes.
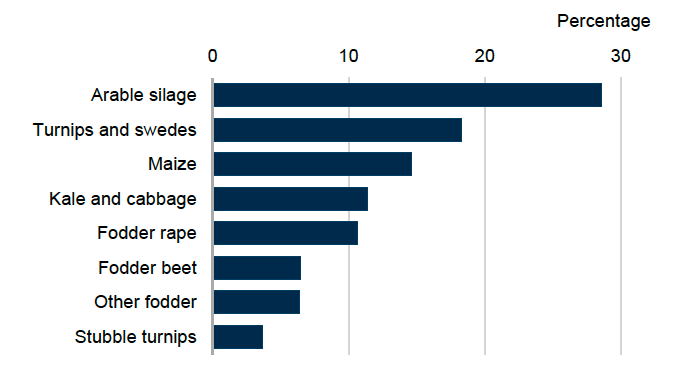
Figure 5 footnote: Other fodder includes kale, rye, rape, stubble turnip and fodder crop mixes.
Pesticide usage on grassland including rough grazing
As in previous surveys, the proportion of grassland and rough grazing treated with a pesticide was very low. As in 2021, only 4% of grassland and less than 0.5% of rough grazing was treated with a pesticide. These areas received 1.1 and 1.0 sprays respectively, on average, during 2025 (Table 1). It is estimated that the area of grassland and rough grazing treated with a pesticide formulation in 2025 was ca. 72,000 hectares (Table 2 and Figure 7).
This represents a decrease of 11% since 2021 and 18% since 2017. In relation to the weight of pesticide applied, ca. 57.2 tonnes was applied in 2025, a decrease of 14% from 2021 and 32% from 2017 (Figure 8).
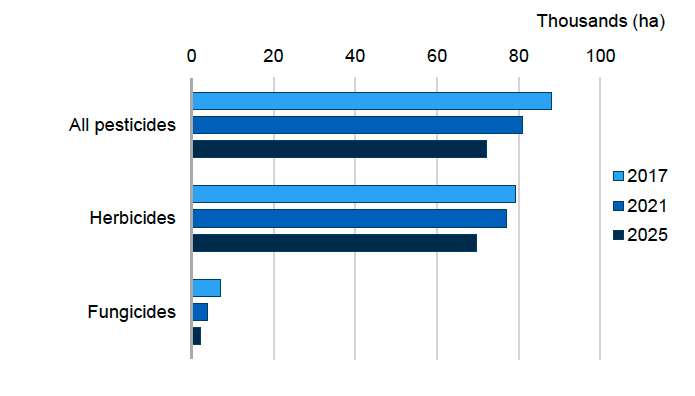
Figure 7 footnote: Growth regulators, molluscicides, seed treatments and insecticides have been excluded from the figure as the area treated is less than 1,000 hectares.
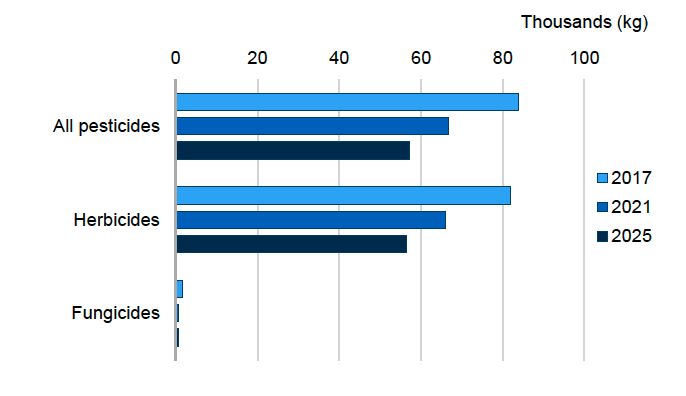
Figure 8 footnote: Growth regulators, molluscicides, seed treatments and insecticides have been excluded as they represent less than 500kg.
In order to make accurate comparisons between the 2025 data and the data collected in previous surveys, it is important to take into account the differences in crop area between survey years. Therefore, the number of treated hectares per hectare of crop grown and the total weight of pesticide used per hectare of crop grown were calculated. In 2025, for each hectare of grassland and rough grazing grown, 0.018 pesticide treated hectares were recorded. This represents a decrease of 2% from 2021 to 2025 and a decrease of 11% from 2017 to 2025 (Figure 9). The estimated weight of pesticide applied per hectare of grassland and rough grazing grown in 2025 was 0.0143 kilograms. This represents a decrease of 6% from 2021 and a decrease of 26% from 2017 (Figure 10).
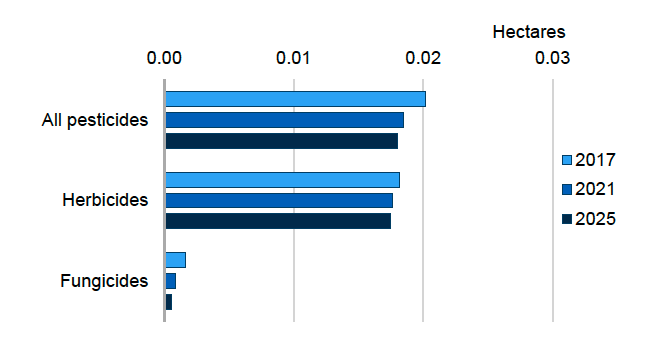
Figure 9 footnote: Growth regulators molluscicides, seed treatments and insecticides were excluded from the figure as the area represented less than 0.001 treated hectares per hectare of crop grown.
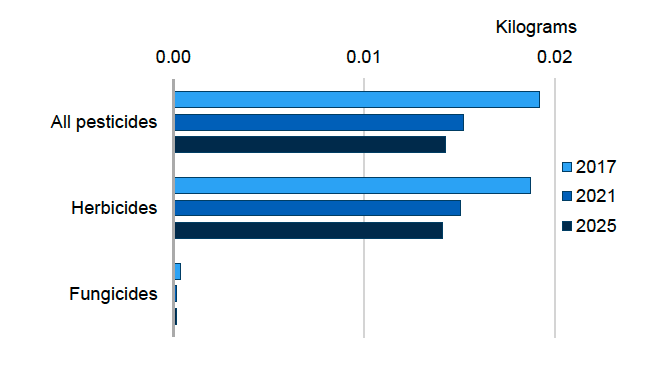
Figure 10 footnote: Growth regulators, molluscicides, insecticides and seed treatments were excluded from the figure as the weight represented less than 0.0004 kg/ha.
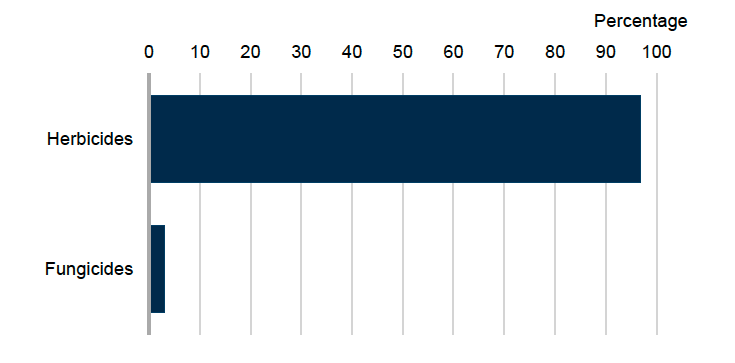
Figure 11 footnote: Growth regulators and molluscicides have been excluded as they represent less than 1% of area treated.
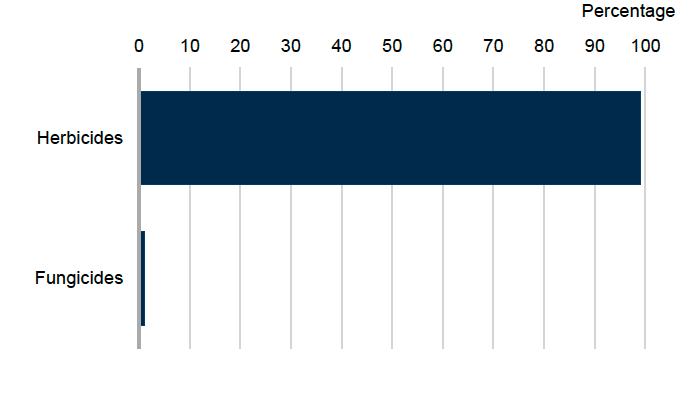
Figure 12 footnote: Growth regulators and molluscicides have been excluded as they represent less than 1% of area treated.
Herbicides
In 2025, as reported in previous surveys, herbicides were the most frequently used pesticide by area treated on grassland and rough grazing, followed by fungicides (Figure 7). Herbicides accounted for 97% of the total pesticide treated area and 99% of the total weight of pesticides applied (Figures 11 and 12). The majority of herbicide use was on undersown and direct sown grass (32% and 25% of crop area treated respectively). Herbicides were the predominant pesticide applied to direct sown grass, and the only pesticide type applied to one to four year old grass, grass over five years old and rough grazing (Table 1). When changes in crop area are taken into account, the area treated with herbicides was similar in 2021 and 2025 and decreased by 4% between 2017 and 2025 (Figure 9). From 2021 to 2025, there was a 6% decrease in the weight of fungicides used per hectare of crop grown and a decrease of 25% between 2017 and 2025 (Figure 10). The decrease in herbicides over the longer term may relate to the loss of key herbicides. For example, the emergency authorisation for asulam for the control of bracken was not granted from 2023, and the herbicide 2,4-DB was withdrawn in 2021. Prior to this, asulam and 2,4-DB were applied at high rates and may explain the larger decrease in weight applied than area treated with herbicides, per hectare of crop grown.
Fungicides
In 2025, fungicides accounted for 3% of the total pesticide treated area and 1% of the total weight of pesticides applied (Figures 11 and 12). As in previous surveys, fungicides were only applied to undersown grass for the control or prevention of disease including rhynchosporium on the nurse crop. When changes in crop area are taken into account, the area treated with fungicides decreased by 36% between 2021 and 2025 and decreased by 66% between 2017 and 2025 (Figure 9). From 2021 to 2025, there was a 4% increase in the weight of fungicides used per hectare of crop grown and a decrease of 61% between 2017 and 2025 (Figure 10). The recent decrease in area treated with fungicides may be influenced by crop composition. There was a 27% decrease in the area of undersown grass grown in 2025 compared to 2021.
Growth regulators
Growth regulators accounted for less than 1% of the total pesticide treated area and total weight of active substances applied to grassland (Figures 11 and 12). Growth regulators were only recorded on undersown grass, for the regulation of growth of the nurse crop. No growth regulators were encountered in the previous survey in 2021.
Molluscicides
Molluscicides accounted for less than 1% of the total pesticide treated area and total weight of active substances applied to grassland (Figures 11 and 12). No molluscicide use was encountered in the previous survey in 2021.
Insecticides
No insecticide use was recorded in 2025 or 2021, and they accounted for less than 1% of the total pesticide treated area in 2017.
Seed treatments
No seed treatments were applied in 2025 or 2021. In 2017 thiram was the only seed treatment active recorded, applied to five per cent of the direct sown grass area. Thiram was withdrawn in January 2020 and there are now no conventional pesticide seed treatments available.
Pesticide usage on fodder crops
In contrast to pesticide use on grassland, an estimated 46% of the total fodder crop was treated with a pesticide. Maize had the highest overall proportion of crop treated with a pesticide at 87%, with fodder beet, fodder rape, turnips and swedes, and kale and cabbage had high proportion of crop treated (60%, 58%, 54% and 44% respectively). Arable silage, other fodder crops and stubble turnips had a lower proportion of crop treated (26%, 19% and 5% respectively) (Table 1). Fodder crops received 1.5 sprays on average (Table 1). Fodder beet received the highest average number of sprays out of all fodder crops at 3.2 applications. These figures only apply to the treated area of crops. During the 2025 survey the area of fodder crops treated with a pesticide formulation was estimated to be 23,616 hectares compared to 25,227 treated hectares in 2021 and 24,262 treated hectares in 2017 (Table 11 and Figure 13).
In terms of weight of pesticide applied, it is estimated ca 12 tonnes were applied in 2025 representing an increase of 15% from 2021 and an increase of 46% from 2017 (Figure 14).
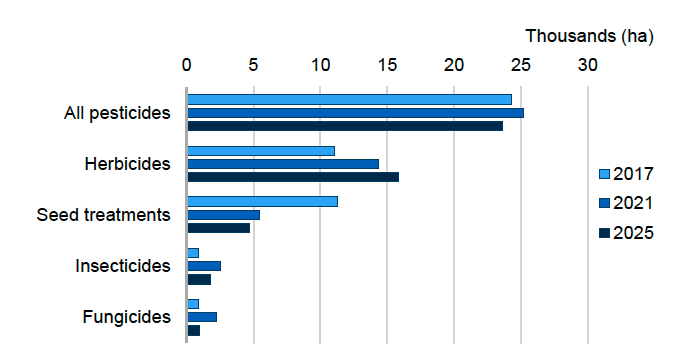
Figure 13 footnote: Growth regulators and molluscicides have been excluded from the figure as the area treated is less than 500 hectares.
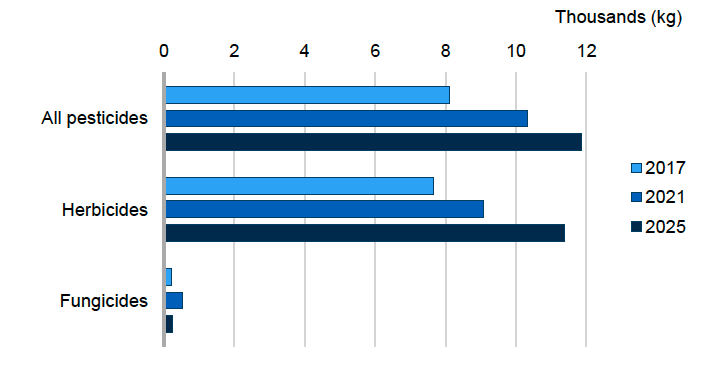
Figure 14 footnote: Molluscicides, insecticides, seed treatments and growth regulators have been excluded as they represent less than 200kg.
In order to make accurate comparisons between the 2025 data and the data collected in previous surveys, it is important to take into account the differences in crop area between survey years. Therefore, the number of treated hectares per hectare of crop grown and the total weight of pesticide used per hectare of crop grown were calculated. In 2025, for each hectare of fodder crops grown, 1.336 pesticide treated hectares were recorded. This represents a decrease of 9% from 2021 to 2025 and a decrease of 10% from 2017 to 2025 (Figure 15). The estimated weight of pesticide applied per hectare of fodder crops grown in 2025 was 0.67 kilograms. This represents an increase of 12% from 2021 and an increase of 35% from 2017 (Figure 16). The decrease in pesticide treated area but increase in the weight treated per hectare grown is likely to be influenced by herbicide use as the use of fungicides, seed treatments and insecticides decreased in comparison to 2021.The increase in weight applied could be due to a large increase in the weight of some herbicide actives applied, as they are generally applied at higher rates.
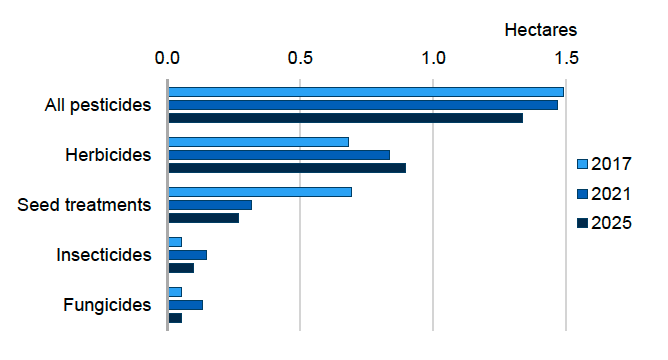
Figure 15 footnote: Molluscicides and growth regulators have been excluded as the area treated is less than 0.05 treated hectares per hectare of crop grown.
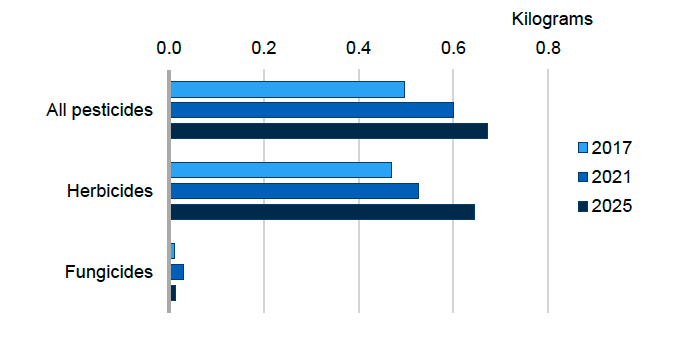
Figure 16 footnote: Growth regulators, molluscicides, insecticides and seed treatments have been excluded from the figure as the weight represented less than 0.01 kilograms per hectare of crop grown.
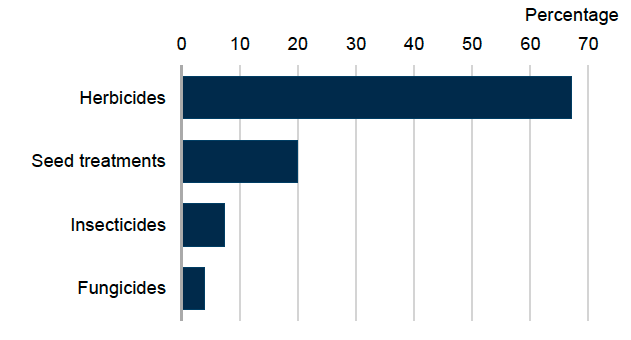
Figure 17 footnote: Growth regulators and molluscicides have been excluded from the figure as their use represents 1% of the area treated.
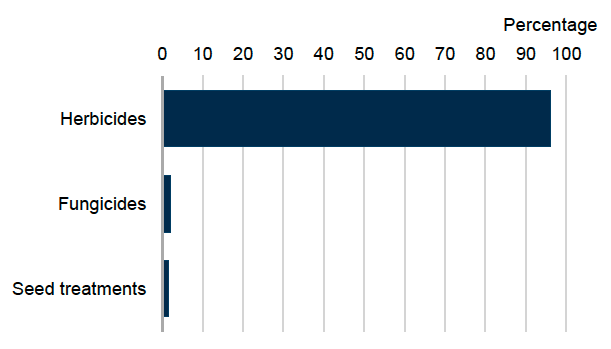
Figure 18 footnote: Growth regulators, insecticides and molluscicides have been excluded from the figure as their use represents less than 1% of the total weight applied.
Herbicides
In 2025, as reported in previous surveys, herbicides were the most frequently used pesticide by area treated on fodder crops followed by the use of seed treatments (Figure 17). Herbicides accounted for 67% of the total pesticide treated area and 96% of the total weight of pesticides applied (Figures 17 and 18). The majority of herbicide use was on maize crops (87% of crop area treated) and were the only type of pesticide applied to maize (other than seed treatments) (Table 1). When changes in crop area are taken into account, the area treated with herbicides increased by 8% between 2021 and 2025 and increased by 32% between 2017 and 2025 (Figure 15). From 2021 to 2025, there was a 22% increase in the weight of herbicides used per hectare of crop grown and an increase of 37% between 2017 and 2025 (Figure 16). This increase in herbicide use is likely to be influenced by crop composition and the increase in maize grown over the three surveys. Maize is the crop with the highest proportion of treated area.
Seed treatments
In 2025, seed treatments accounted for 20% of the total pesticide treated area and 2% of the total weight of pesticides applied to fodder crops (Figures 17 and 18). When changes in crop area are taken into account, the area treated with seed treatments decreased by 16% between 2021 and 2025 and decreased by 61% between 2017 and 2025 (Figure 15). The weight of seed treatments applied per hectare increased by 26% from 2021 to 2025. The decrease in area of seed treatments in 2025 could be driven by the loss of formulations with the withdrawal of actives and products since the previous survey in 2021. A product used as a main seed treatment on maize had a formulation change in 2022, removing the active substance sedaxane from the formulation. The area of sedaxane has a 99% decrease in 2025 compared to 2021 and almost a 100% decrease in the weight applied in 2025 compared to 2021.
Insecticides
In 2025, insecticides accounted for 7% of the total pesticide treated area and less than 0.5% of the total weight of pesticides applied to fodder crops (Figures 17 and 18). When changes in crop area are taken into account, the area treated with insecticides decreased by 33% between 2021 and 2025 but increased by 80% between 2017 and 2025 (Figure 15). In terms of weight of pesticide applied per hectare of crop grown, there was a 48% decrease between 2021 and 2025 but a 72% increase from 2021 to 2025 (Figure 16). This decrease between 2021 and 2025 may have been influenced by the large increase in area of maize grown, which was not treated with insecticides in 2025 and the decreased area of turnips and swedes and kale treated with insecticides between 2021 and 2025. These three crop categories account for 44% of the total fodder area suggesting an influential effect on the pesticide treated areas.
Fungicides
In 2025, fungicides accounted for 4% of the total pesticide treated area and 2% of the total weight of pesticides applied (Figures 17 and 18). Fungicides were only applied to arable silage and fodder beet crops (Table 1). When changes in crop area are taken into account, the area treated with fungicides decreased by 60% between 2021 and 2025 and decreased by 3% between 2017 and 2025 (Figure 15). From 2021 to 2025, there was a 55% decrease in the weight of fungicides used per hectare of crop grown but a 37% increase between 2017 and 2025 (Figure 16). This decrease in the area treated with fungicides is likely to be influenced by crop composition. Fungicides were only applied to arable silage and fodder beet, both of which the area grown in 2025 decreased compared to the previous survey in 2021. However, the proportions of these crops treated also decreased. An estimated 15% of arable silage was treated in 2021 compared to 6% in 2025, similarly for fodder beet, 4% in 2021 and 1% in 2025.
Growth regulators
Growth regulators accounted for 1% of the total pesticide treated area and less than 1% for the total weight of active substances applied to fodder crops (Figures 17 and 18). Arable silage was the only fodder crop treated with a growth regulator. This was similar in 2021. No growth regulators were encountered in 2017.
Molluscicides
Molluscicides accounted for 1% of the total pesticide treated area and less than 1% of the total weight of active substances applied to fodder crops. When changes in crop area are taken into account, the area treated with molluscicides decreased by 12% between 2021 and 2025 and by 16% between 2017 and 2025. In terms of weight of molluscicide applied per hectare of crop grown, there was a 15% increase between 2021 and 2025 but a 35% decrease between 2017 and 2025. Ferric phosphate was the only molluscicide encountered in 2025 and 2021. Metaldehyde was the only molluscicide encountered in 2017 (withdrawn with final use date in March 2022).
General trends in active substances encountered in grassland & fodder crops
The most commonly used pesticides on grassland and fodder crops are herbicides. The principal herbicide mode of action on grassland and fodder crops in terms of area treated were auxin mimics. The same three herbicide active substances, fluroxypyr, MCPA and triclopyr, were the most used in 2025 and 2021 in terms of treated areas, although use has decreased by 26%, 17% and 25% respectively (supporting document Table 6 and Table 8). These three active substances were also the most commonly used herbicides in the 2017 survey. The herbicide active substance halauxifen-methyl had a 383% increase in area treated and a 958% increase in terms of weight applied from 2021 to 2025. This was encountered only on arable silage crops in the 2021 survey, but in 2025, it was primarily encountered on grass over 5 years. Over the last three surveys, the proportion of fodder crops treated with glyphosate has steadily increased (8% in 2017, 12% in 2021 and 15% in 2025), replacing metazachlor as the principal herbicide used.
The principal fungicide mode of action on grass and fodder crops in terms of area treated continues to be sterol biosynthesis in membranes which includes the azoles. As in both 2021 and 2025, the most used foliar fungicide active substance by area in this survey was prothioconazole (supporting document Table 5 and Table 8). The fungicide fluxapyroxad had a 182% increase in use from 2021 to 2025 used on undersown grass crops (applied to the nurse crop). The area treated with fluoxastrobin and trifloxystrobin in 2025 decreased by 84% and 66% respectively. This is due to a 27% decrease in area of undersown grass treated in 2025 compared to 2021 and a reduction in the proportion of undersown grass treated (supporting document Table 8 and Table 3).
The principal insecticide mode of action on grass and fodder crops in terms of area treated were sodium channel modulators, with the pyrethroid lambda-cyhalothrin being the most used (supporting document Table 7). The only active substance available to use for slug control in the 2025 growing season was ferric phosphate.
As in 2021, no seed treatments were encountered on grassland, and seed treatment use on fodder crops all declined, with the exception of ziram, metalaxyl, prothioconazole and tebuconazole, which increased 101%, 59%, 51%, and 2% respectively, in terms of area treated. Ziram, metalaxyl and prothioconazole were encountered only on maize, and as noted previously, the maize area grown in Scotland approximately doubled between 2021 and 2025. Although ziram has no approval in the UK, imported seed treated with a plant protection product authorised for that use in EU countries were allowed at the time of use [6]. In 2025 the seed treatment active substance sedaxane, also primarily encountered on maize in 2021, had a 99% decrease in area treated and a 100% decrease in the weight applied. This is likely due to a product formulation change on a seed treatment applied to maize, where sedaxane was removed from the formulation in 2022. Sedaxane was only encountered on a small area of fodder beet in 2025.
Six active substances were recorded for the first time in the 2025 grassland and fodder survey (supporting document Table 4). These included the herbicides, florpyrauxifen-benzyl, fluroxypyr-meptyl, pyridate and quizalofop-P-tefuryl, used for general weed control, the fungicide difenoconazole and the growth regulator 2-chloroethylphosphonic acid. New products containing the active substances florpyrauxifen-benzyl, fluroxypyr-meptyl have been approved in GB since the previous survey (approved in December 2024 and January 2025 respectively).
Contact
Email: psu@sasa.gov.scot