
Pesticide usage in Scotland: Grassland and Fodder Crops 2025
This publication presents information from a survey of pesticide use on Grassland and Fodder crops in Scotland in 2025.
Data and methodology
Sampling and data collection
Using the June 2025 Agricultural Census [7], two samples were drawn. The first sample was taken from holdings with grassland (Table 17), the second from holdings growing fodder crops (Table 18).
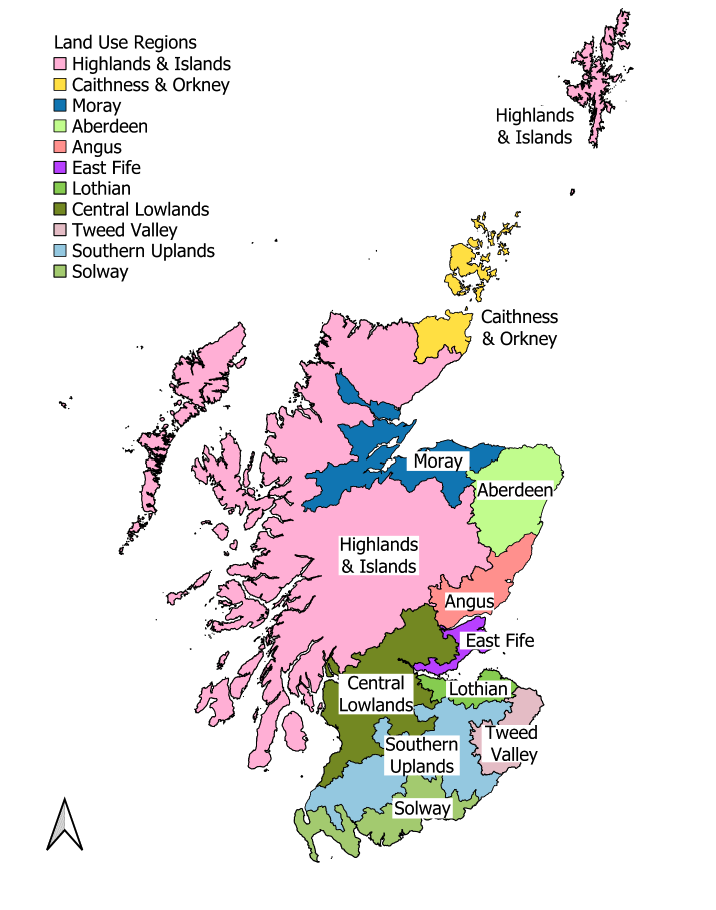
The country was divided into 11 land-use regions (Figure 41). The samples were stratified by these land-use regions and according to holding size. The holding size groups were different for grassland and fodder crops (Table 13 and 14) and were based on the total area of crops grown on the holding. The sampling fractions used within both regions and size groups were based on the areas of relevant crops grown rather than number of holdings, so that smaller holdings would not dominate the sample.
The survey period for pesticide applications to grassland was from August 2024 to August 2025. For fodder crops, the survey period covered pesticide applications during the 2025 growing season, including any post-harvest applications following the 2024 harvest through to the end of harvest in 2025. As well as recording treatments applied directly to the crop, land preparation treatments prior to sowing the crop were also collected.
For holdings in the fodder sample, an introductory letter was sent to farmers followed up by a telephone call. The majority of information was gathered during this telephone call, although some holdings required a subsequent telephone call or email. When necessary, data were also collected from consultant agronomists, contractors and seed merchants. In addition to information about fodder crops, pesticide use data were also collected for grassland grown on holdings selected in the fodder sample. In total, data were collected from 201 holdings growing fodder crops. These 201 holdings collectively grew 23% of the census fodder area. Details of the distribution of the fodder sample can be found in Table 14.
Postal questionnaires were sent to holdings selected in the grassland sample. This postal survey supplemented the grassland data collected during the fodder survey. This combined dataset ensures that the proportionately large areas of grassland grown in Scotland are adequately represented in the survey. Of 1,339 questionnaires sent out there were 403 (30%) useable responses (Table 22). Details of the distribution of the grassland sample can be found in Table 13. The grassland sample represented 6% of the total grassland grown in Scotland and 3% of the total rough grazing.
For both samples, the data collected included the area of grassland and/or fodder crops grown, selected agronomic information and a record of the area and weight of all pesticide applications. Holdings that were not able or not willing to provide data were replaced with alternative holdings from the same region and size group where possible.
Raising factors
National pesticide use was estimated by ratio raising. This is a standard statistical technique for producing estimates from a sample. It is the same methodology used by the other UK survey teams and has been used for all historical datasets produced by the Pesticide Survey Unit, allowing comparability over time. The sample data were multiplied by raising factors (Table 19 and 20). These factors were calculated by comparing the sampled area to the areas recorded in the Agricultural Census within each region and size group. An adjustment (Table 21) was made for each crop within each region by applying the raising factors to the sample area of each crop grown and comparing this with the census area. This adjustment modifies the estimate to take into account differences in composition of crops encountered in the sample and those present in the population. A second adjustment was necessary for some crops which were present in the population but were not encountered in the sample in some strata.
Detailed data tables and data used to create the charts in this report are available in Excel format in the supporting document published separately.
Changes from previous years
There are changes which should be noted when comparing the 2025 data with the previous survey.
The 2025 report follows a different structure to earlier survey reports. Previously full data tables were included in survey reports. This report only includes short summary data tables for each of the crops but references full data tables published in Excel format in a supporting document. This is a similar format used in other Scottish Government accredited publications. Figures have also been improved to meet accessibility criteria. It should also be noted in 2021, a product containing 52.5% metamitron and 4% quinmerac was misreported as 70% metamitron, therefore the area and weight values for metamitron/quinmerac and metamitron, and the ‘All herbicide’ and ‘All pesticides’ categories reported will differ to the 2021 report. In 2021 the formulations for the seed treatments sedaxane and ziram were misreported, therefore the area and weight values for sedaxane and ziram and the 'All seed treatments' and 'All pesticides' categories reported will differ to the 2021 report [3].
Data quality assurance
The dataset underwent several validation processes as follows; (i) checking for any obvious errors upon data receipt (ii) checking and identifying inconsistencies with use and pesticide approval conditions once entered into the database (iii) checking of data held in the database against the raw data. Where inconsistencies are found these are checked against the records and with the grower if necessary. Additional quality assurance is provided by sending reports for review to members of the Working Party on Pesticide Usage Surveys and other agricultural experts. In addition, the Scottish Pesticide Survey Unit is accredited to ISO 9001:2015. All survey related processes are documented in Standard Operating Procedures (SOPs) and our output is audited against these SOPs by internal auditors annually and by external auditors every three years.
Main sources of bias
The use of a random stratified sample is an appropriate survey methodology. A stratified random sample, grouped by farm size and region, is used to select holdings used in this survey. Sampling within size groups is based on area rather than numbers of holdings, so that smaller size groups are not over-represented in the sample. The pesticide survey may be subject to measurement bias as it is reliant on farmers/growers recording data accurately. As this survey is not compulsory it may also subject data to non-response bias, as growers on certain farm/holding types may be more likely to respond to the survey than others. Reserve lists of holdings are held for each stratum to allow non-responding holdings to be replaced with similar holdings.
Experience indicates that stratified random sampling, including reserves, coupled with personal interview technique, delivers the highest quality data and minimises non-response bias.
Standard errors
The figures presented in this report are produced from surveying a sample of holdings rather than a census of all the holdings in Scotland. Therefore, the figures are estimates of the total pesticide use for Scotland and should not be interpreted as exact. To give an idea of the precision of estimates, relative standard errors (RSE) for total pesticide use on grassland and fodder crops for both area and weight have been calculated. Standard errors are produced using the raising factors. An overall variance is calculated by summing the variance estimates for individual strata (region and size group) multiplied by the square of their raising factors. These variance estimates include a finite population correction. The overall standard error is calculated from the overall variance by taking its square root. This method of standard estimation was implemented as it is both relatively straightforward and has advantages over ratio estimator methods when within-strata sample sizes are small.
Standard errors are expressed as percentage relative standard errors for both total pesticide use by area treated and for weight applied. Larger relative standard errors mean that the estimates are less precise. A relative standard error of 0% would be achieved by a census. A relative standard error of 100% indicates that the error in the survey is of the same order as the measurement. Relative standard errors may be reduced with larger sample sizes. However, larger relative standard errors can also result from greater variability in pesticide use among holdings.
The RSE for estimates of total pesticide use on grassland (excluding rough grazing) in 2025 was 10% for area and 12% for weight, similar to 2021 (see supporting document Table 23). On rough grazing in 2025 the RSE was 33% for area and 39% for weight. For fodder crops in 2025 the RSE was 18% for area and 12% for weight. High standard errors mean that there is more uncertainty associated with estimates of pesticide use.
Response rates
See supporting document (Table 22) which summarises the number of holdings contacted during the survey.
Financial burden to farmers
In order to minimise the burden on farmers, the survey team used non-visit methods of collection such as email, post or telephone call.
The grassland survey was carried out by postal questionnaire, with a few follow-up telephone calls when required. The fodder survey was carried out by telephone and email.
All respondents to the grassland postal survey were asked how long it had taken for them to fill out the survey form. Out of 403 respondents, 318 provided this information (79%) The median time taken to provide the information for the grassland survey was 10 minutes.
The time taken to provide the data requested was recorded for 201 respondents to the fodder survey (100%). The median time taken to provide information for the fodder survey was 11 minutes.
The following formula was used to estimate the cost of participating:
Burden (£) = No. surveyed x median time taken (hours) x typical hourly rate*
(* using median “Full Time Gross” hourly pay for Scotland of £20.26) [9].
The total financial burden, accounting for all farmers’ participation in the 2025 grassland survey was £1,074 and for the fodder survey was £747. Therefore, the overall financial burden to growers for 2025 survey participation was £1,820.
Contact
Email: psu@sasa.gov.scot