Pesticide usage in Scotland: arable crops and potato stores 2020
This publication presents information from a survey of pesticide use on arable crops and potato stores in Scotland during 2020.
Part of
2020 Pesticide usage
Winter barley
- An estimated 43,089 hectares of winter barley were grown in Scotland in 2020, an increase of 15 per cent since 2018.
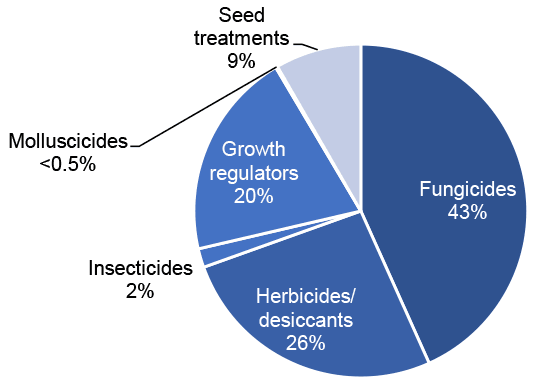
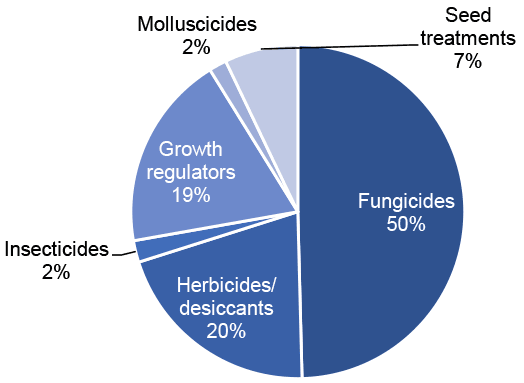
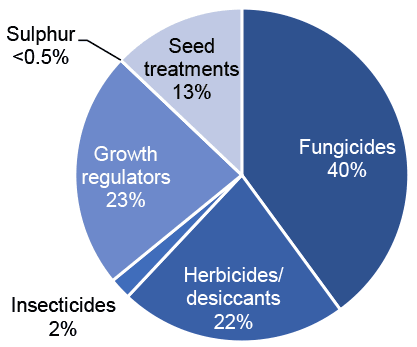
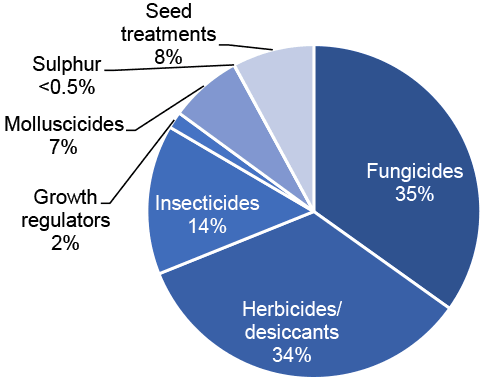
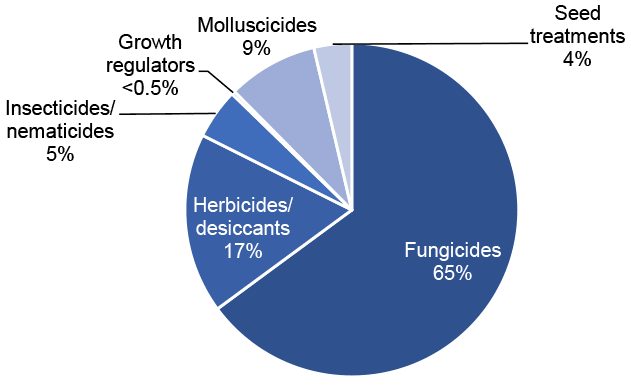
- One hundred per cent of the crop was treated with a pesticide (see Figure 11 for types of pesticides used)
- Pesticides were applied to 453,417 treated hectares
- There were 133,451 kilograms of pesticide applied in total (see summary table)
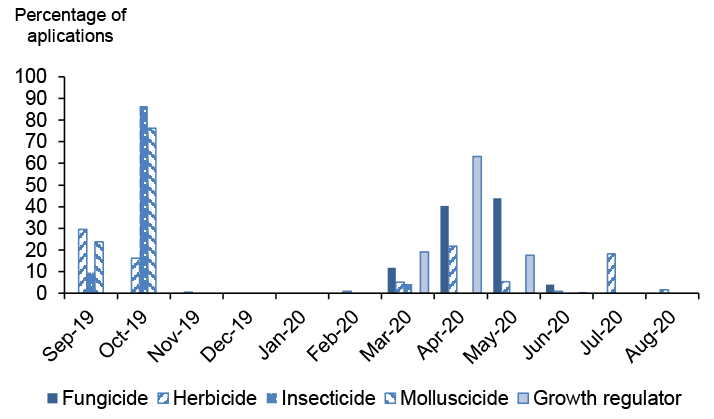
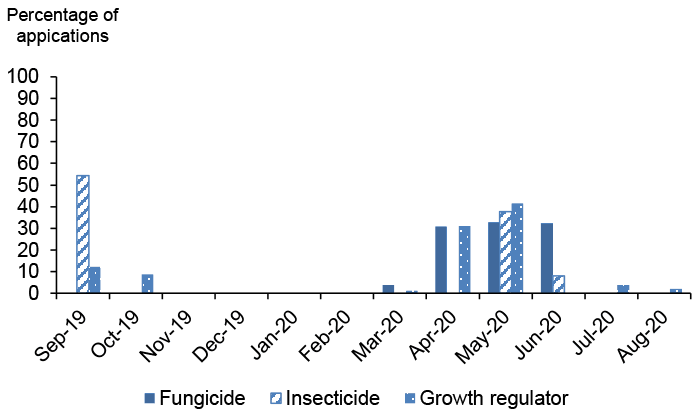
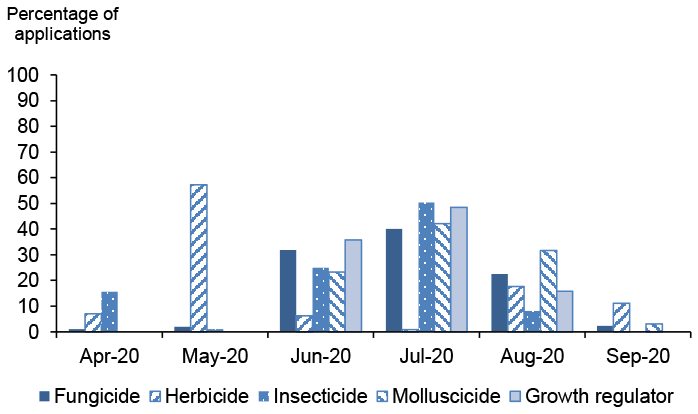
- Winter barley received on average 4.1 pesticide sprays (Table 1). These sprays included 2.6 fungicide applications and 2.1 herbicide/desiccant applications (applied to 96 per cent of the crop area for both groups), 1.9 applications of growth regulators (applied to 89 per cent) and one application of insecticide (applied to 19 per cent)
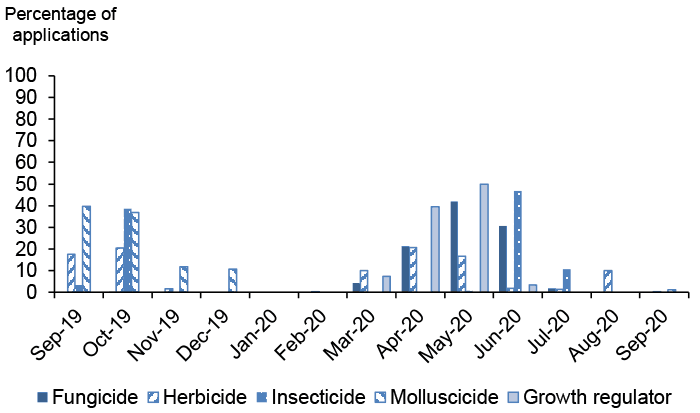
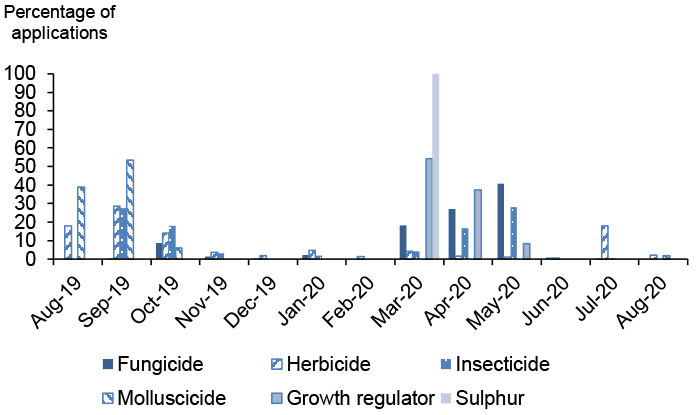
- Timings of pesticide applications are shown in Figure 12
- Where reasons were given (51 per cent), 66 per cent of fungicide use was for disease control/precaution. Where the disease was specified Rynchosporium was the most commonly reported (13 per cent) followed by mildew (seven per cent), Ramularia (six per cent), net blotch (four per cent), Fusarium (two per cent) with abiotic spotting, rust and ear diseases all under one per cent
- Reasons for herbicide/desiccant use were given for 68 per cent of the area. Thirty-one per cent was for annual broad-leaved weeds, 27 per cent for general weed control and 17 per cent for annual meadow grass. The remaining reasons were desiccation/harvest aid (13 per cent), wild oats and annual grass weeds (both three per cent), groundsel (two per cent) and couch (one per cent). All other reasons (cleavers, brome, field pansy, volunteer oats, sterile brome, fumitory, ryegrass, speedwell, docks and black grass) were below one per cent
- Where specified (39 per cent) all insecticide use was for aphids
- The most common varieties encountered were KWS Orwell (20 per cent) and KWS Tower (19 per cent)
- The average reported yield was 8.0 t/ha
Summary of pesticide use on winter barley:
| Pesticide group | Formulation area treated | Weight of pesticides applied | Percentage of crop treated | Most used formulations |
|---|---|---|---|---|
| ha | kg | % | ha | |
| Fungicides | 196,180 | 45,444 | 96 | Chlorothalonil (37,730) |
| Herbicides/ desiccants | 118,957 | 53,729 | 96 | Glyphosate (25,163) |
| Insecticides | 8,272 | 39 | 19 | Lambda-cyhalothrin (5,810) |
| Growth regulators | 91,230 | 33,607 | 89 | Chlormequat (35,880) |
| Molluscicides | 828 | 51 | 2 | Metaldehyde (592) |
| Seed treatments | 37,949 | 581 | 88 | Imazalil/ipconazole (14,628) |
| All pesticides | 453,417 | 133,451 | 100 |
Note: herbicides include desiccants.
Spring barley
- An estimated 258,702 hectares of spring barley were grown in Scotland in 2018, representing an increase of three per cent since 2020
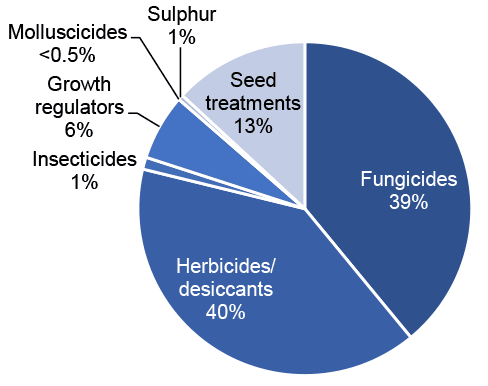
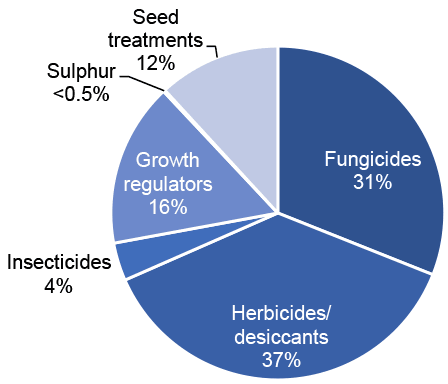
- Ninety-nine per cent of the crop was treated with a pesticide (see Figure 13 for types of pesticide used)
- Pesticides were applied to 1,802,458 treated hectares
- There were 415,027 kilograms of pesticide used in total on the crop (see summary table)
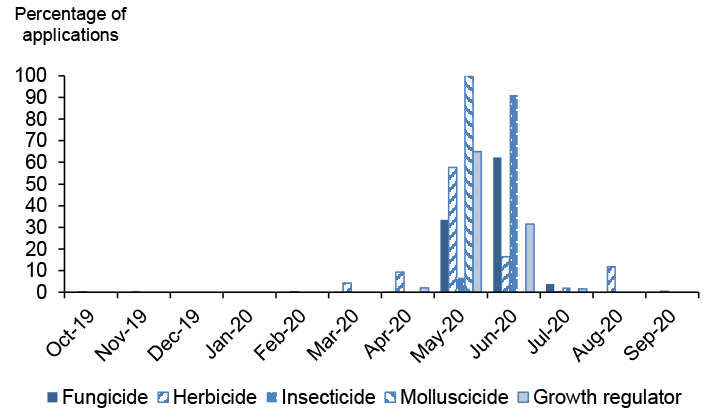
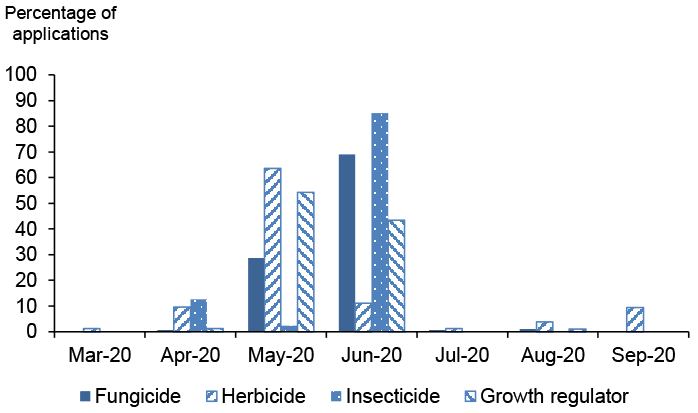
- The spring barley crop received on average 2.7 pesticide applications (Table 1). These included 1.8 fungicide applications and 1.8 herbicide/desiccant applications (applied to 95 per cent and 99 per cent of the crop area respectively) and 1.2 applications of growth regulators (applied to 35 per cent)
- Timings of pesticide applications are shown in Figure 14
- Reasons were given for 59 per cent of total fungicide use with 67 per cent being for disease control/precaution. Where the disease was specified, Rhynchosporium and mildew were most commonly reported (11 per cent each), followed by Ramularia (six per cent), net blotch (three per cent) and rust (one per cent). Four other reasons for fungicide use, each less than one per cent, account for the remainder
- Reasons were supplied for 70 per cent of herbicide/desiccant use; 49 per cent was for general weed control, 21 per cent for annual broad-leaved weeds, seven per cent desiccation/harvest aid, five per cent for both annual meadow grass and wild oats and two per cent for couch. Chickweed, fumitory, volunteer rape, knotgrass, annual grass weeds and volunteer potatoes were all listed at one per cent, and 14 other herbicide reasons were recorded at less than one per cent
- Reasons were supplied for 48 per cent of total insecticide use. 63 per cent was for aphids, 29 per cent was for cereal leaf beetle and eight per cent for general pests
- Laureate was the most common variety, accounting for 64 per cent of the sample area, followed by LG Diablo at 12 per cent
- The average reported yield was 7.1 t/ha
Summary of pesticide use on spring barley:
| Pesticide group | Formulation area treated | Weight of pesticides applied | Percentage of crop treated | Most used formulations |
|---|---|---|---|---|
| ha | kg | % | ha | |
| Fungicides | 702,401 | 155,137 | 95 | Folpet (145,294) |
| Herbicides/ desiccants | 715,836 | 187,703 | 99 | Metsulfuron-methyl/ thifensulfuron-methyl (114,027) |
| Insecticides | 20,985 | 98 | 8 | Lambda-cyhalothrin (17,502) |
| Growth regulators | 115,117 | 30,683 | 35 | Chlormequat (41,806) |
| Molluscicides | 34 | 3 | <0.5 | Metaldehyde (34) |
| Sulphur | 8,841 | 37,086 | 3 | N/A |
| Seed treatments | 239,243 | 4,318 | 92 | Prothioconazole/tebuconazole (142,480) |
| All pesticides | 1,802,458 | 415,027 | 99 |
N/A = not applicable
Note: herbicides include desiccants.
Winter wheat
- An estimated 91,249 hectares of winter wheat were grown in Scotland in 2020, representing a decrease of three per cent since 2018
- One hundred per cent of the crop was treated with a pesticide (see Figure 15 for types of pesticide used)
- Pesticides were applied to 1,270,846 treated hectares
- There were 369,912 kilograms of pesticide used in total on the crop (see summary table)
- The winter wheat crop received on average 5.1 pesticide applications (Table 1). These included 3.5 fungicide applications and 2.1 herbicide/desiccant applications (applied to 100 per cent and 97 per cent of the crop area respectively), 1.9 applications of growth regulators (applied to 96 per cent); molluscicides and insecticides received 1.3 and 1.2 applications applied to 18 and 24 per cent of the area respectively)
- Timings of pesticide applications are shown in Figure 16
- Reasons were given for 59 per cent of total fungicide use with 47 per cent being for disease control/precaution. Where the disease was specified Septoria was most commonly reported (21 per cent) followed by rust (nine per cent), yellow rust (seven per cent), Fusarium (five per cent), mildew (four per cent), eyespot (three per cent) and sooty mould (two per cent). Six other reasons for fungicide use were all recorded at below one per cent
- Reasons were supplied for 66 per cent of herbicide/desiccant use; 32 per cent was for general weed control, 19 per cent for annual broad-leaved weeds and 15 per cent for annual meadow grass. Five per cent of use was for harvest aid and four per cent for annual grass weeds. Three per cent listed brome, wild oats and volunteer rape. Two per cent listed fumitory, ryegrass and mayweed. One per cent listed cleavers, volunteer oats, sterile brome, volunteer beans, speedwell, black grass, black bindweed, chickweed and groundsel. Twelve other reasons for herbicide use were all recorded at below one per cent to give two per cent of all reasons given
- Reasons were supplied for 79 per cent of total insecticide use, all of which was for aphids
- KWS Barrel was the most common variety, accounting for 25 per cent of the sample area, followed by LG Skyscraper at 15 per cent
- The average reported yield was 9.1 t/ha
Summary of pesticide use on winter wheat:
| Pesticide group | Formulation area treated | Weight of pesticides applied | Percentage of crop treated | Most used formulations |
|---|---|---|---|---|
| ha | kg | % | ha | |
| Fungicides | 630,257 | 178,034 | 100 | Chlorothalonil (103,788) |
| Herbicides/ desiccants | 260,752 | 89,757 | 97 | Glyphosate (34,446) |
| Insecticides | 26,692 | 118 | 24 | Lambda-cyhalothrin (21,240) |
| Growth regulators | 241,015 | 98,175 | 96 | Chlormequat (108,909) |
| Molluscicides | 21,746 | 2,087 | 18 | Ferric phosphate (16,394) |
| Seed treatments | 90,385 | 1,741 | 94 | Fludioxonil (41,449) |
| All pesticides | 1,270,846 | 369,912 | 100 |
Note: there were small amounts (<0.5%) of herbicide applications on winter wheat in August 2020 which are not visible on this figure. Herbicides include desiccants
Spring wheat
This crop was not recorded separately in the Agricultural Census. Based upon the proportions of spring and winter wheat encountered in the survey it was estimated that 2,282 hectares of spring wheat were grown in Scotland in 2020, representing a decrease of 59 per cent since 2018.
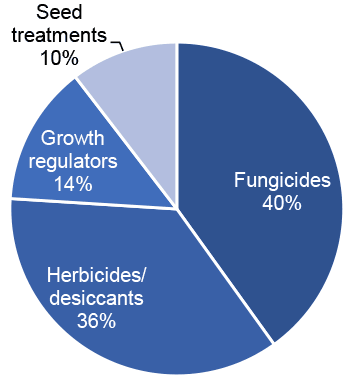
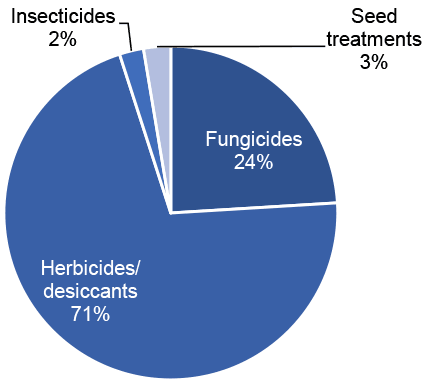
- One hundred per cent of the crop was treated with a pesticide (see Figure 17 for types of pesticides used)
- Pesticides were applied to 17,197 treated hectares
- There were 3,241 kilograms of pesticide used in total on the crop (see summary table below)
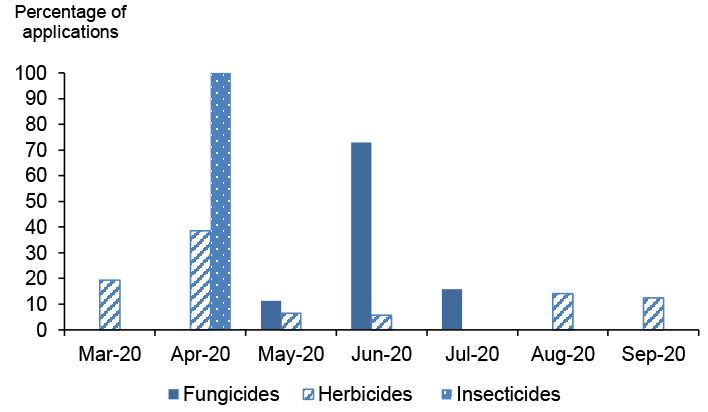
- The spring wheat crop received on average 2.8 pesticide applications (Table 1). These included 1.9 fungicide applications and 1.6 herbicide/desiccant applications (applied to 100 per cent of the crop area for both groups) and 1.0 applications of growth regulators (applied to 79 per cent). There were no insecticide applications.
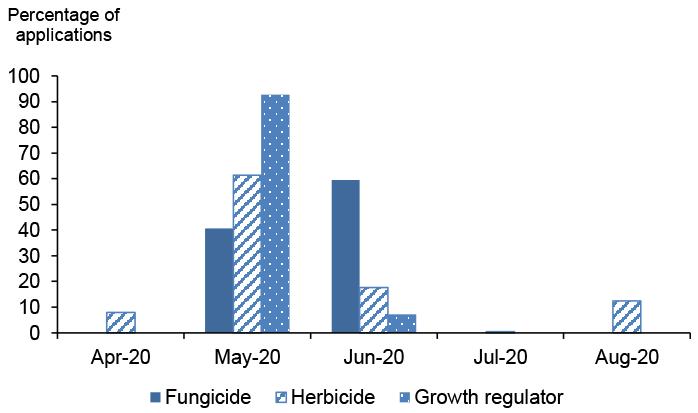
- Timings of pesticide applications are shown in Figure 18
- Reasons were given for 79 per cent of total fungicide use with over 73 per cent being for disease control. Specified diseases included mildew (10 per cent), Septoria and yellow rust (both nine per cent)
- Reasons were supplied for 92 per cent of herbicide/desiccant use; 53 per cent was for general weed control, 30 per cent for annual broad-leaved weeds, eight per cent for couch, six per cent for desiccation and three per cent for wild oats. Fumitory was listed at under one per cent of area
- The most common variety grown, accounting for 45 per cent of the sample area, was Tybalt followed by Belepi at 37 per cent
- The average reported yield was 6.1 t/ha
Summary of pesticide use on spring wheat:
| Pesticide group | Formulation area treated | Weight of pesticides applied | Percentage of crop treated | Most used formulations |
|---|---|---|---|---|
| ha | kg | % | ha | |
| Fungicides | 6,894 | 1,455 | 100 | Prothioconazole/ tebuconazole (1,003) |
| Herbicides/ desiccants | 6,175 | 1,122 | 100 | Metsulfuron-methyl/ thifensulfuron-methyl (1,759) |
| Growth regulators | 2,335 | 643 | 79 | Trinexapac-ethyl (1,813) |
| Seed treatments | 1,792 | 20 | 79 | Fludioxonil/Tebuconazole (1,039) |
| All pesticides | 17,197 | 3,241 | 100 |
Note: Herbicides include desiccants.
Winter oats
- An estimated 7,984 hectares of winter oats were gown in Scotland in 2020, a decrease of five per cent since 2018.
- Eighty-nine per cent of the crop was treated with a pesticide (see Figure 19 for types of pesticides used)
- Pesticides were applied to 52,111 treated hectares
- There were 10,202 kilograms of pesticide applied in total (see summary table)
- Winter oats received on average 3.3 pesticide sprays (Table 1). These sprays included 2.4 fungicide applications and 1.5 herbicide/desiccant applications (applied to 74 per cent and 82 per cent of the crop area respectively), 1.5 applications of growth regulators (applied to 80 per cent) and 1.0 applications of insecticides (applied to 14 per cent)
- Timings of pesticide applications are shown in Figure 20
- Where reasons were given (73 per cent of area treated), 38 per cent of fungicide use was for mildew, 24 per cent for disease control, 14 per cent for crown rust and six per cent for rust. Six other reasons for fungicide use were all recorded at below three per cent.
- Reasons for herbicide/desiccant use were given for 81 per cent of the area, 35 per cent was for general weed control, 29 per cent for annual broad-leaved weeds, 11 per cent for annual meadow grass, seven per cent for both harvest aid and mayweed, three per cent for volunteer beans, groundsel and volunteer rape, one per cent each for chickweed, cleavers and fumitory
- Where specified (100 per cent), 73 per cent of insecticide use was for aphids and 27 per cent for cereal leaf beetle
- The most common variety encountered was Gerald accounting for 35 per cent of the sample area followed by Dalguise at 34 per cent
- The average reported yield was 7.7 t/ha
Summary of pesticide use on winter oats:
| Pesticide group | Formulation area treated | Weight of pesticides applied | Percentage of crop treated | Most used formulations |
|---|---|---|---|---|
| ha | kg | % | ha | |
| Fungicides | 20,818 | 2,456 | 74 | Cyflufenamid (4,460) |
| Herbicides/ desiccants | 11,488 | 2,386 | 82 | Diflufenican/ flufenacet (4,335) |
| Insecticides | 1,095 | 5 | 14 | Lambda-cyhalothrin (1,095) |
| Growth regulators | 11,983 | 5,266 | 80 | Trinexapac-ethyl (6,095) |
| Seed treatments | 6,727 | 88 | 84 | Fludioxonil (3,223) |
| All pesticides | 52,111 | 10,202 | 89 |
Note: Herbicides include desiccants.
Spring oats
- An estimated 25,999 hectares of spring oats were grown in Scotland in 2020, an increase of ten per cent since 2018
- Ninety-three per cent of the crop was treated with a pesticide (see Figure 21 for types of pesticides used)
- Pesticides were applied to 170,500 treated hectares
- There were 40,535 kilograms of pesticide applied in total (see summary table)
- Spring oats received on average 3.1 pesticide sprays (Table 1). These sprays included 1.7 fungicide applications and 1.9 herbicide/desiccant applications (applied to 90 per cent and 92 per cent of the crop area respectively), 1.1 applications of growth regulators (applied to 79 per cent) and 1.0 application of insecticides (applied to 24 per cent)
- Timings of pesticide applications are shown in Figure 22
- Where reasons were given (60 per cent), 38 per cent of fungicide use was for mildew, 21 per cent for leaf spot, 19 per cent for disease control and 10 per cent for crown rust, with six other reasons for fungicide use accounting for the rest.
- Reasons for herbicide/desiccant use were given for 70 per cent of the area, 24 per cent for general weed control, 15 per cent each for annual broad-leaved weeds and desiccation/harvest aid, 13 per cent for volunteer rape, seven per cent each for both cleavers and fumitory, five per cent for field pansy, three per cent for fat hen, two per cent each for mayweed, annual grass weeds, desiccation, volunteer beans, knotgrass and annual meadow grass with one per cent each for thistles, redshank and chickweed.
- Where specified (72 per cent), 74 per cent of insecticide use was for aphids and 26 per cent for cereal leaf beetle
- The most common variety encountered was WPB Elyann, accounting for 25 per cent of the sample area followed by Conway at 24 per cent
- The average reported yield was 6.6 t/ha
Summary of pesticide use on spring oats:
| Pesticide group | Formulation area treated | Weight of pesticides applied | Percentage of crop treated | Most used formulations |
|---|---|---|---|---|
| ha | kg | % | ha | |
| Fungicides | 52,432 | 7,008 | 90 | Cyflufenamid (8,787) |
| Herbicides/ desiccants | 63,182 | 16,205 | 92 | Fluroxypyr (11,253) |
| Insecticides | 6,225 | 31 | 24 | Lambda-cyhalothrin (6,225) |
| Growth regulators | 26,857 | 15,810 | 79 | Chlormequat (14,255) |
| Sulphur | 294 | 1,168 | 1 | N/A |
| Seed treatments | 21,512 | 314 | 83 | Prothioconazole/ tebuconazole (9,929) |
| All pesticides | 170,500 | 40,535 | 93 |
Note: Herbicides include desiccants.
Oilseed rape
- An estimated 30,793 hectares of oilseed rape (winter and spring) were grown in Scotland in 2020, representing a decrease of six per cent since 2018
- One hundred per cent of the crop was treated with a pesticide (see Figure 23 for types of pesticides used)
- Pesticides were applied to 285,283 treated hectares
- There were 78,623 kilograms of pesticide used in total on the crop (see summary table)
- The oilseed rape crop received on average 5.8 pesticide applications (Table 1). These included 2.7 fungicide applications and 2.6 herbicide/desiccant applications (applied to 98 and 100 per cent of the crop area respectively), 1.0 application of growth regulators (applied to 15 per cent), 1.4 molluscicide applications (applied to 46 per cent) and 1.8 insecticides applications to 73 per cent of the crop area
- Timings of pesticide applications are shown in Figure 24
- Reasons were given for 48 per cent of total fungicide use with 43 per cent being for light leaf spot, 27 per cent for Sclerotinia, 16 per cent for disease control/precaution, four per cent for Phoma leaf spot, three per cent Alternaria. Seven other diseases were listed at below one per cent
- Reasons were supplied for 57 per cent of herbicide/desiccant use; 22 per cent for volunteer cereals, 21 per cent each for general weed control, 17 per cent for desiccation/harvest aid, 11 per cent for annual broad-leaved weeds, six per cent for annual meadow grass, five per cent for mayweed, four per cent each for annual grass weeds and brome, three per cent for cleavers, two per cent for fumitory and one per cent each for volunteer barley, charlock, wild oats and sterile brome. Chickweed, black grass, couch, cranesbill and shepherds purse were all recorded at below one per cent
- Reasons were supplied for 59 per cent of total insecticide use. Twenty-six per cent of which was for flea beetle, 22 per cent for seed weevil, 20 per cent for pollen beetle, 15 per cent for cabbage stem flea beetle, 11 per cent for winter stem beetle, three per cent stem weevil and two per cent each for aphids and pod midge
- Anastasia was the most common variety, accounting for 14 per cent of the sample area, followed by DK Exalte at 10 per cent
- The average reported yield was 4 t/ha
Summary of pesticide use on oilseed rape:
| Pesticide group | Formulation area treated | Weight of pesticides applied | Percentage of crop treated | Most used formulations |
|---|---|---|---|---|
| ha | kg | % | ha | |
| Fungicides | 99,321 | 15,344 | 98 | Prothioconazole/ tebuconazole (25,499) |
| Herbicides/ desiccants | 97,013 | 59,219 | 100 | Glyphosate (21,228) |
| Insecticides | 41,369 | 801 | 73 | Lambda-cyhalothrin (26,390) |
| Growth regulators | 4,603 | 859 | 15 | Mepiquat chloride/ metconazole (4,603) |
| Molluscicides | 19,980 | 2,138 | 46 | Ferric phosphate (14,546) |
| Sulphur | 53 | 169 | <0.5 | N/A |
| Seed treatments | 22,944 | 93 | 75 | Thiram (11,966) |
| All pesticides | 285,283 | 78,623 | 100 |
N/A = not applicable
Note: there were small amounts (<0.5%) of herbicide applications on oilseed rape in September 2020 which are not shown on this figure; herbicides include desiccants.
Seed potatoes
- An estimated 12,003 hectares of seed potatoes were grown in Scotland in 2020, representing a decrease of one per cent since 2018
- One hundred per cent of the crop was treated with a pesticide (see Figure 25 for types of pesticide used)
- Pesticides were applied to 292,245 treated hectares
- There were 102,026 kilograms of pesticide used in total on the crop (see summary table below)
- The seed potato crop received on average 10.9 pesticide applications (Table 1). These included 8.8 fungicide applications and 2.3 herbicide/desiccant applications (applied to 100 per cent of the crop area for both groups), insecticides and molluscicides received 6.5 and 1.9 applications respectively (applied to 92 and 34 per cent of the area respectively)
- Timings of pesticide applications are shown in Figure 26
- Reasons were given for 62 per cent of total fungicide use, 98 per cent was for blight, one per cent each for powdery scab and mildew. Sclerotinia was recorded at below one per cent
- Reasons were given for 63 per cent of herbicide/desiccant use; 43 per cent was for general weed control, 37 per cent for desiccation, 13 per cent for annual broad-leaved weeds, five per cent for annual meadow grass and one per cent each for both volunteer rape and couch
- Reasons were supplied for 51 per cent of total insecticide/nematicide use, all of which was for aphids
- Maris Piper was the most common variety, accounting for 12 per cent of the sample area, followed by Hermes at eight per cent
- The average reported yield was 39.3 t/ha
Summary of pesticide use on seed potatoes:
| Pesticide group | Formulation area treated | Weight of pesticides applied | Percentage of crop treated | Most used formulations |
|---|---|---|---|---|
| ha | kg | % | ha | |
| Fungicides | 145,927 | 79,885 | 100 | Cyazofamid (27,113) |
| Herbicides/ desiccants | 43,893 | 15,560 | 100 | Carfentrazone-ethyl (13,408) |
| Insecticides | 83,722 | 2,684 | 92 | Lambda-cyhalothrin (32,806) |
| Molluscicides | 7,811 | 1,034 | 34 | Ferric phosphate (7,400) |
| Seed treatments | 10,891 | 2,863 | 88 | Flutolanil (5,477) |
| All pesticides | 292,245 | 102,026 | 100 |
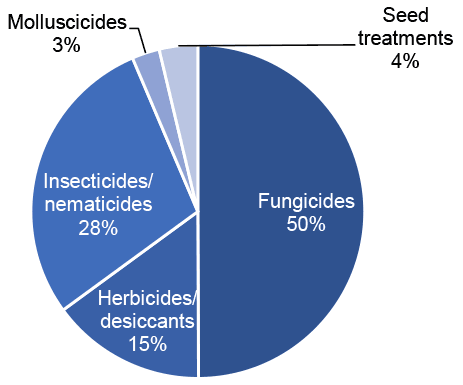
Note: Insecticides include nematicides and herbicides include desiccants.
Ware potatoes
- An estimated 16,294 hectares of ware potatoes were grown in Scotland in 2020, representing an increase of seven per cent since 2018
- One hundred per cent of the crop was treated with a pesticide (see Figure 27 for types of pesticide used)
- Pesticides were applied to 389,323 treated hectares with 201,609 kilograms of pesticide applied in total (see summary table below)
- The ware potato crop received on average 13.8 pesticide applications (Table 1). These included 10.2 fungicide applications and 2.4 herbicide/desiccant applications (applied to 99 per cent of the crop area for both groups), insecticides and molluscicides received 1.9 and 3.3 applications each (applied to 58 per cent of the area for both groups)
- Timings of pesticide applications are shown in Figure 28
- Reasons were given for 50 per cent of total fungicide use, 96 per cent of which was for blight control, two per cent each for both black dot and Alternaria. Sclerotinia was recorded at below one per cent
- Reasons were supplied for 45 per cent of herbicide/desiccant use; 58 per cent was for general weed control, 32 per cent for desiccation, seven per cent for annual broad-leaved weeds and four per cent for annual meadow grass
- Reasons were supplied for 47 per cent of total insecticide/nematicide use. 96 per cent of which was for aphids with two per cent each for both nematodes and wireworm
- Maris Piper was the most common variety grown for ware, accounting for 30 per cent of the sample area followed by Cultra at 18 per cent
- The average reported yield was 53.9 t/ha
Summary of pesticide use on ware potatoes:
| Pesticide group | Formulation area treated | Weight of pesticides applied | Percentage of crop treated | Most used formulations |
|---|---|---|---|---|
| ha | kg | % | ha | |
| Fungicides | 252,674 | 160,160 | 99 | Cymoxanil/mancozeb (61,530) |
| Herbicides/ desiccants | 68,055 | 25,270 | 99 | Pyraflufen-ethyl (18,456) |
| Insecticides | 18,964 | 6,413 | 58 | Esfenvalerate (7,073) |
| Growth regulators | 1,277 | 3,830 | 8 | Maleic hydrazide (1,277) |
| Molluscicides | 34,095 | 3,911 | 58 | Ferric phosphate (29,385) |
| Seed treatments | 14,259 | 2,025 | 85 | Flutolanil (6,670) |
| All pesticides | 389,223 | 201,609 | 100 |
Note: there were small amounts (<0.5%) of fungicide and herbicides/desiccants applied in October 2020 which are not shown on this figure; insecticides include nematicides and herbicides include desiccants.
Legumes
The legumes category includes dry harvest peas and field beans. These crops have been combined as too few holdings were encountered to report the pesticide use for each crop separately
- An estimated 2,466 hectares of legumes were grown in Scotland in 2020, representing a decrease of three per cent since 2018
- Eighty-nine per cent of the crop was treated with a pesticide (see Figure 29 for types of pesticide used)
- Pesticides were applied to 7,491 treated hectares
- There were 4,282 kilograms of pesticide used in total on the crop (see summary table below)
- The legume crop received on average 2.5 pesticide applications (Table 1). These included 1.1 fungicide applications and 1.9 herbicide/desiccant applications (applied to 46 and 89 per cent of the crop area respectively)
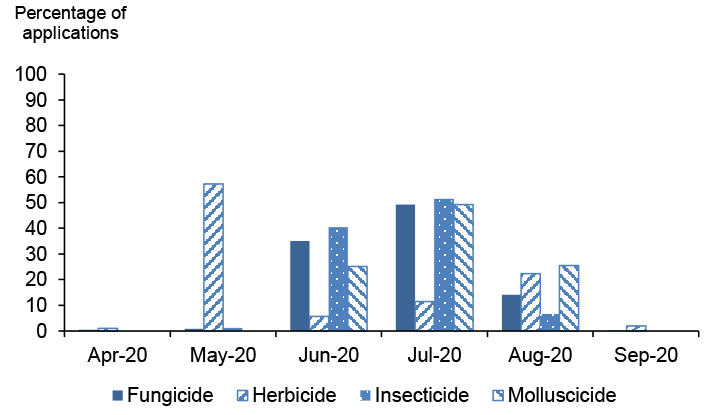
- Timings of pesticide applications are shown in Figure 30
- Reasons were given for 70 per cent of total fungicide use with 46 per cent for Ascochyta, 28 per cent for rust and 26 per cent for Sclerotinia. Chocolate spot (botrytis) which is a common problem was not recorded
- Reasons were supplied for 81 per cent of herbicide/desiccant use; 23 per cent was for cleavers, 20 per cent for desiccation/harvest aid, 19 per cent for general weed control, 12 per cent was for annual broad-leaved weeds, 11 per cent for annual meadow grass, six per cent for volunteer cereals and three per cent each for annual grass weeds, brome and wild oats
- The most common variety, accounting for 37 per cent of the sample area, was Fuego followed by Honey at 19 per cent
- The average reported yield was 4.4 t/ha
Summary of pesticide use on legumes:
| Pesticide group | Formulation area treated | Weight of pesticides applied | Percentage of crop treated | Most used formulations |
|---|---|---|---|---|
| ha | kg | % | ha | |
| Fungicides | 1,800 | 289 | 46 | Azoxystrobin (772) |
| Herbicides/ desiccants | 5,319 | 3,993 | 89 | Glyphosate (1,360) |
| Insecticides | 175 | 1 | 7 | Esfenvalerate (91) |
| Seed treatments | 197 | N/A | 8 | Unspecified seed treatment (197) |
| All pesticides | 7,491 | 4,282 | 89 |
Note: 92 per cent of legumes in 2020 had no seed treatment; the seed treatment information for the remaining eight per cent was unspecified (see appendix 3 for definitions). N/A = not applicable
Note: September 2019 herbicide spray (3%) omitted for ease of reading. Herbicides include desiccants.
Contact
Email: psu@sasa.gov.scot