Pesticide usage in Scotland: arable crops and potato stores 2020
This publication presents information from a survey of pesticide use on arable crops and potato stores in Scotland during 2020.
Part of
General trends
Crop area
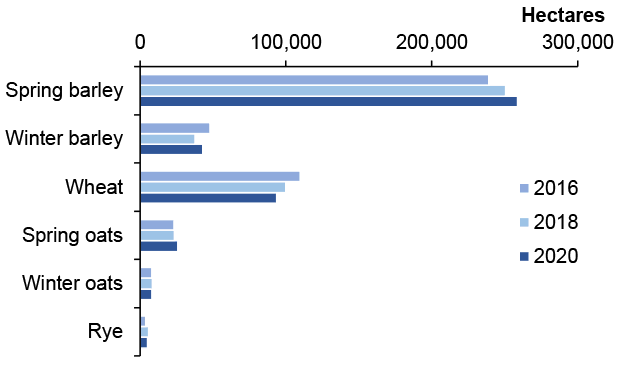
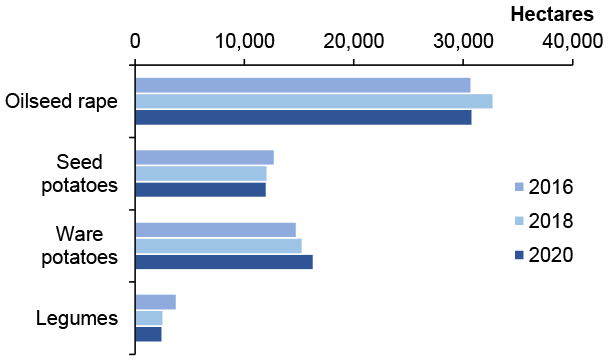
The census area of arable crops grown in 2020 was 496,631 hectares (Table 28). This represents a one per cent increase from 2018(3) and no change from 2016(4). Since the last survey, areas of winter barley, spring barley, spring oats and ware potatoes increased (15, three, 10 and seven per cent respectively), while wheat, winter oats, winter rye, oilseed rape, seed potatoes and legumes have decreased (six, five, 11, six, one, three per cent respectively) (Table 28, Figures 1 and 2).
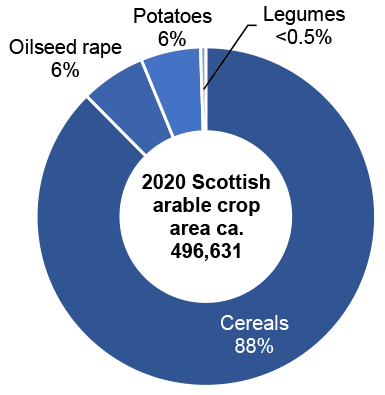
In 2020, cereals accounted for 88 per cent of the arable area (52 per cent spring barley, 19 per cent wheat, nine per cent winter barley, two per cent spring oats, two per cent winter oats and one per cent rye). The remaining area consisted of oilseed rape, potatoes and legumes (accounting for six, six and <0.5 per cent respectively, Figure 3). The largest area of arable crops was in the Aberdeen region, followed by Angus, the Tweed Valley and Moray Firth (Figure 4).
Note: oilseed rape includes winter and spring oilseed rape, legumes includes field beans and dry harvest peas
Note: cereals includes winter and spring barley, wheat, oats and winter rye; potatoes includes seed and ware potatoes; oilseed rape includes winter and spring oilseed rape; legumes includes field beans and dry harvest peas
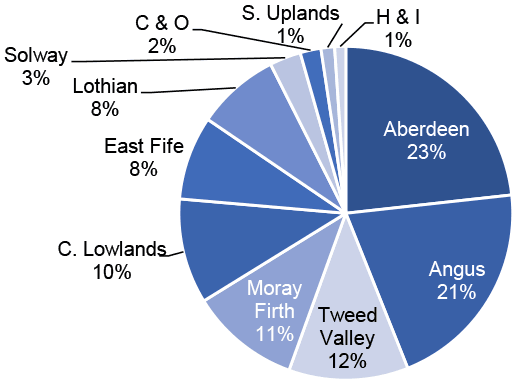
Note: H & I = Highlands and Islands, S. Uplands = Southern Uplands, C & O = Caithness and Orkney and C. Lowlands = Central Lowlands
Pesticide usage
In 2020, as in 2018, the majority of arable crops (99 per cent) received a pesticide treatment.
Winter and spring barley, winter and spring wheat, winter rye, oilseeds, seed and ware potatoes had the highest overall proportion of crop treated with a pesticide (99 per cent of spring barley crop and 100 per cent of the other crops, Table 1). Winter oats, spring oats and legumes had lower proportions of treated crop area (89, 93 and 89 per cent respectively). The average number of sprays applied to treated arable land, excluding seed treatments was 4.1, very similar to that recorded in 2018 (average 3.9 sprays). Ware potatoes and seed potatoes received the highest average number of sprays (13.8 and 10.8 respectively), while legumes, spring barley and spring wheat received the lowest (2.5, 2.7 and 2.8 respectively, Table 1). These figures only apply to the treated area of crops.
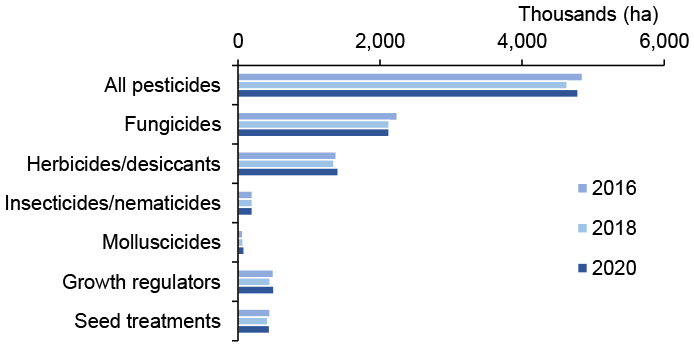
It is estimated that the area of arable crops treated with a pesticide formulation in 2020 was ca. 4,793,000 hectares compared with ca. 4,632,000 hectares in 2018 and ca. 4,852,000 hectares in 2016 (Table 24, Figure 5). This represents an increase of three per cent since 2018 and a decrease of one per cent since 2016.
Note: sulphur is not shown as it represents <2 per cent of the treated area
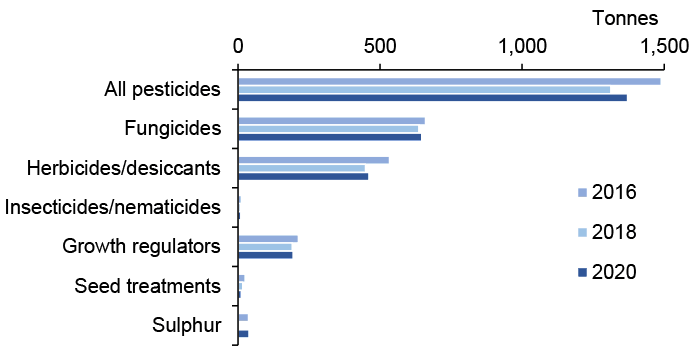
In terms of weight of pesticide applied, it is estimated ca. 1,370 tonnes were applied in 2020, representing an increase of five per cent from 2018 and a decrease of eight per cent from 2016 (Table 24, Figure 6).
Note: molluscicides are not shown as their use represents under 10 tonnes.
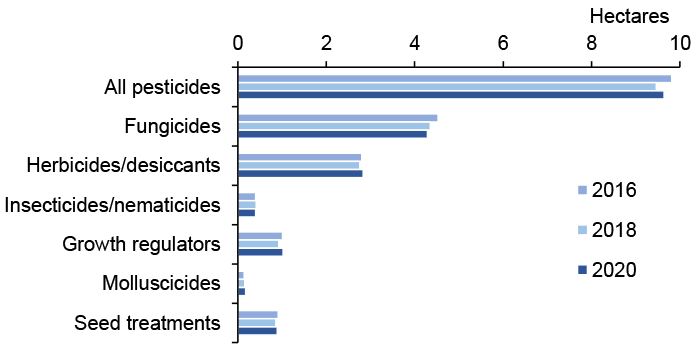
In order to make accurate comparisons between the 2020 data and the data collected in previous surveys, it is important to take into account the differences in crop area between survey years. Therefore, the number of treated hectares per hectare of crop grown and the total weight of pesticide used per hectare of crop grown were calculated. Once crop area is taken into account, there was a two per cent increase from 2018 to 2020 and a two per cent decrease from 2016 to 2020 in terms of the total pesticide treated area per area of crop grown (Figure 7).
Note: sulphur is not shown as it represents <0.1 treated hectares per hectare of crop grown.
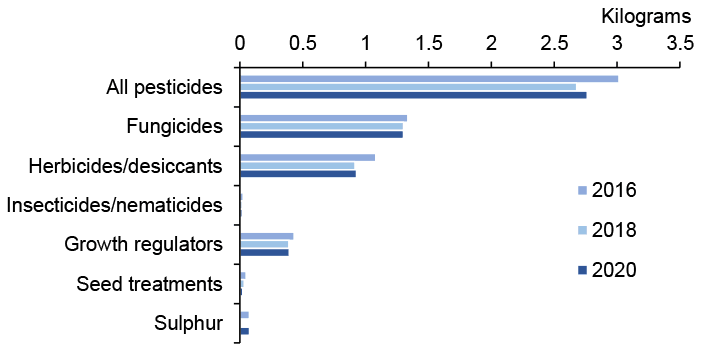
In terms of quantity of pesticides used per hectare of crop grown, there was an increase of three per cent from 2018 to 2020 and a decrease of eight per cent from 2016 to 2020 (Figure 8).
Note: Molluscicides are not shown as it represents <0.02 kg per hectare of crop grown.
As in previous surveys in this series, fungicides were the most frequently used pesticides on arable crops, followed by herbicides/desiccants (Figure 5). In 2020, fungicides accounted for 45 per cent of the total pesticide treated area and 47 per cent of the total weight of active substances applied (Figures 9 and 10). When changes in crop area are taken into account, there was a one per cent decrease in area treated with fungicides from 2018 to 2020 and a five per cent decrease in area treated from 2016 to 2020 (Figure 7). The weight of fungicides applied per hectare was unchanged from 2018 to 2020 and decreased three per cent from 2016 (Figure 8).
In 2020, herbicides/desiccants accounted for 29 per cent of the total pesticide treated area and 33 per cent of the total weight of active substances applied (Figures 9 and 10). When changes in crop area are taken into account, there was a three per cent increase in the area treated with herbicides/desiccants from 2018 to 2020 and a one per cent increase from 2016 to 2020. The weight of herbicides/desiccants applied increased one per cent from 2018 to 2020 and decreased 14 per cent from 2016 to 2020 (Figures 7 and 8).
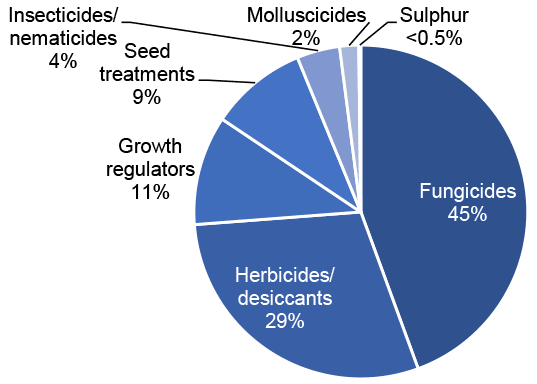
As was the case in 2018, insecticides/nematicides accounted for four per cent of the total pesticide treated area and one per cent of the total weight of active substances applied (Figures 9 and 10). As in 2018, pyrethroids accounted for the largest area treated with an insecticide (83 per cent, Table 19). When changes in crop area are taken into account, there was a three per cent decrease in area treated with insecticide from 2018 to 2020 and no change from 2016 to 2020 (Figure 7). The weight of insecticides applied per hectare of crop grown increased 17 per cent from 2018 to 2020 and decreased 18 per cent from 2016 to 2020 (Figure 8). This decrease in weight of insecticides applied since 2016 is influenced by the loss of the active substance chlorpyrifos in 2016 which was applied at high rates for the control of leatherjackets and wheat bulb fly in cereal crops. The increase in weight of insecticides applied since 2018 appears to have been driven by an increase in use on oilseed rape. When changes in crop area are taken into account, insecticide use on oilseed rape in 2020 increased by 54 per cent in terms of weight applied since 2018. A very wet autumn which delayed sowing may have resulted in some poorer crops that were more susceptible to pest attack in early growth stages, necessitating increased usage. With the loss of neonicotinoid seed treatments, growers are now reliant on foliar insecticides for insect control during the autumn crop establishment period.
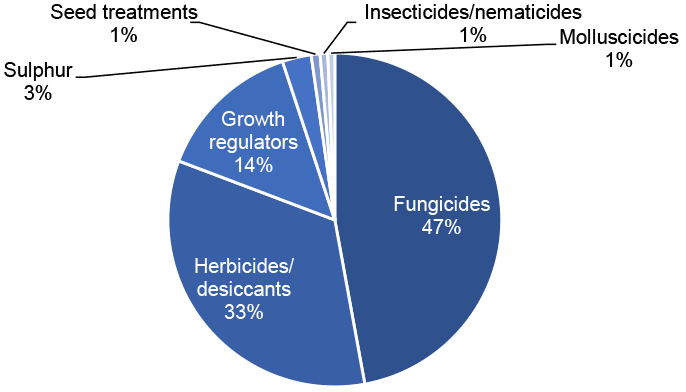
Molluscicides accounted for two per cent of the total pesticide treated area and one per cent of the total weight of active substances applied (Figures 9 and 10). When changes in crop area are taken into account, there was a 16 per cent increase in area treated from 2018 to 2020 and a 28 per cent increase from 2016 to 2020 (Figure 7). The weight of molluscicides applied per hectare of crop grown increased by four per cent from 2018 to 2020 and by 17 per cent from 2016 to 2020 (Figure 8). Heavy rainfall in autumn 2019 favoured slugs and growers were reliant on slug pellets for slug management in oilseed rape and wheat during the autumn(5,6). Also, when changes in crop area are taken into account the weight of molluscicides applied to potato crops increased by 62 per cent. Wet weather during the summer months increased slug pressure on potato crops(7).
Growth regulators accounted for 11 per cent of the total pesticide treated area and 14 per cent of the total weight of active substances applied (Figures 9 and 10). When changes in crop area are taken into account, the area treated increased by 10 per cent from 2018 to 2020 and by two per cent from 2016 to 2020 (Figure 7). The weight of growth regulators applied per hectare of crop grown did not change from 2018 to 2020 and decreased nine per cent from 2016 to 2020 (Figure 8).
Seed treatments accounted for nine per cent of the total pesticide treated area and one per cent of the total weight of active substances applied (Figures 9 and 10). When changes in crop area are taken into account, there was a six per cent increase in area treated between 2018 and 2020 and a one per cent decrease between 2016 and 2020 (Figure 7). The weight of seed treatments applied per hectare decreased 26 per cent from 2018 and by 52 per cent since 2016 (Figure 8). The decrease in the weight of seed treatments applied may relate to the withdrawal of some seed treatment formulations since the previous survey including prochloraz/thiram which was the principal seed treatment on winter oilseed rape in 2018 (final use January 2019) and pencycuron which was the main seed treatment on potatoes in 2018 (final use March 2020). The use of imazalil/ipconazole, the main seed treatment on cereals in 2018, has decreased by 54 per cent in terms of treated area (particularly on spring barley). This was likely influenced by a temporary restriction on the use of this product in 2019 when use was limited to autumn use only. The constraint was lifted in early 2020 which meant the seed treatment could be applied throughout the year to combat a range of soil borne diseases in both wheat and barley.
Sulphur accounted for less than 0.5 per cent of the total pesticide treated area and three per cent of the total weight of active substances applied (Figures 9 and 10). When changes in crop area are taken into account, there was a 480 per cent increase in area treated from 2018 to 2020 and a 23 per cent decrease from 2016 to 2020 (Figure 7). The quantity of sulphur applied per hectare of crop grown increased by 1,322 per cent from 2018 to 2020 and increased two per cent from 2016 to 2020 (Figure 8). Spring barley accounted for 96 per cent of the sulphur treated area and 97 per cent of weight applied in 2020; no sulphur was recorded on spring barley in 2018.
Five active substances were recorded for the first time in the 2020 arable survey (Table 18). These included the herbicide aclonifen (for general weed control in potato crops) and the fungicide mefentrifluconazole (for disease control and precaution in cereals) and spirotetramat (used for aphids in seed potatoes). There were also two new fungicidal seed treatments encountered for the first time in this survey, Bacillus amyloliquefaciens strain MBI600 (used as a biological fungicide on winter OSR) and penflufen used on potatoes.
Whilst overall use of pesticides in 2020 has remained broadly similar to the previous two arable surveys, some individual active substances have exhibited considerable change. For example, the withdrawal of the multi-site fungicide chlorothalonil in May 2020 led to a 64 per cent decrease of area treated from 2018 and decreased 61 per cent by weight. This is likely to be correlated with the substantial increased use of the multi-site fungicide folpet (993 per cent increase by area treated and 1,039 per cent by weight) on wheat and barley (Table 22).
The area treated with fungicides fenpropimorph and epoxiconazole decreased 82 and 50 per cent respectively from 2018 and the weight applied decreased 82 and 52 per cent respectively. The authorisations for fenpropimorph and epoxiconazole have now been withdrawn (final use dates Oct 2020 and October 2021 respectively). In contrast, the area treated and weight applied of the fungicide and growth regulator metconazole increased 305 and 50 per cent respectively from 2018. The increase in use of metconazole may have been influenced by the reduced availability of epoxiconazole products prior to its withdrawal.
The herbicide treated area with pyraflufen-ethyl in 2020 increased by 345 per cent while the weight applied increased 324 per cent from 2018. Pyraflufen-ethyl is applied as a desiccant to potatoes. This increase in use is likely to be a consequence of the withdrawal of the main potato desiccant, diquat, in February 2020.
The largest increased use of a growth regulator was maleic hydrazide. The treated area increased by 295 per cent and the quantity used increased by 394 per cent. Maleic hydrazide is applied as a field treatment to ware potatoes to prevent sprouting during storage. The increase in the use of maleic hydrazide may have been influenced by the withdrawal of the main growth regulator, chlorpropham, in October 2020. Please refer to the potato storage report for further information.
In 2020, the area treated with the nematicide fosthiazate (organophosphorus) and insecticide acetamiprid (neonicotinoid) increased from 2018 by 589 and 1,065 per cent respectively, while weight applied increased by 1,058 and 996 per cent respectively. The increase in use of fosthiazate was the result of it being one of the few alternatives to oxamyl, which was the principal nematicide in 2018. Growers may have switiched to using fosthiazate in 2020 in preparation for the loss of oxamyl which had a final use date 31 December 2020. Acetamiprid was used primarily on potatoes, with a small quantity used on winter oilseed rape. Acetamiprid plays an important part in aphid management programmes as it has no known resistance to peach-potato aphids, unlike pyrethroids.
Use of the molluscicide active substance metaldehyde in 2020 decreased 68 and 79 per cent by area treated and weight applied respectively from 2018. In contrast, the only other chemical alternative for slug control, ferric phosphate, increased by 163 and 135 per cent by area treated and weight applied respectively (Tables 22 and 23) as growers prepare for the loss of metaldehyde in March 2022. Molluscicide use has been influenced in recent years by changes in authorisation of products containing metaldehyde(8).
Integrated pest management
Information about the uptake of IPM measures by Scottish growers was collected alongside the 2020 arable crops pesticide usage survey. This 2020 IPM survey represents the second in the series of surveys of IPM measures on arable crops, allowing the adoption of IPM techniques to be monitored.
This is a summary of the data; please refer to Appendix 6 for the full dataset. Growers were asked a series of questions about the IPM activities that they implemented for arable crop production. Unlike the other statistics in this report, the figures relating to IPM are not raised to produce national estimates but represent only the responses of those surveyed.
In total, IPM data was collected from 242 growers, collectively representing 248 holdings and six per cent of Scotland’s 2020 arable crop area. Of these growers, 72 per cent had an IPM plan (45 per cent completed their own IPM plan and 27 per cent had a plan completed by their agronomist) (Figure 32). There was very strong evidence for an increase in the use of IPM plans from the 2016 survey where 24 per cent of growers had an IPM plan (p-value < 0.001). Since 2015, there has been a focus on the promotion of IPM and the introduction of mandatory completion of IPM plans within some key QA schemes to help growers make the best possible and most sustainable use of all available methods of pest control. Growers were asked about their IPM activities is relation to three categories; risk management, pest monitoring and pest control.
In both 2020 and 2016, all growers sampled reported that they implemented at least one measure associated with an IPM risk management approach (Table 36). There was strong evidence for an increase in the proportion of positive responses to soil testing techniques (p-value = 0.003) and to cultivation at sowing techniques (p-value < 0.001). Although not statistically significant, there were also increases in uptake in other risk management activities from 2016.
In terms of the uptake of pest monitoring activities, there was very little change seen between 2016 and 2020. In both years, all the growers sampled reported they implemented at least one pest monitoring measure (Table 37).
All of the growers sampled in 2020 adopted at least one IPM pest control activity, the same as in 2016. There was evidence for an increase in the proportion of positive responses to targeted pesticide application techniques (p-value = 0.005) and strong evidence for an increase in the use of anti-resistance strategies (p-value < 0.001) (Table 38). There were increases in the use of targeted pesticide applications to reduce pesticide use (73 per cent in 2016 to 85 per cent in 2020) and anti-resistance strategies (73 per cent in 2016 to 91 per cent in 2020). Finally, in 2020 a similar proportion of respondents stated that they regularly monitored the success of their crop protection measures (100 per cent in 2016 and 98 per cent in 2020).
Contact
Email: psu@sasa.gov.scot