Pesticide usage in Scotland: arable crops and potato stores 2020
This publication presents information from a survey of pesticide use on arable crops and potato stores in Scotland during 2020.
Part of
Appendix 6 – Integrated Pest Management
It is a requirement of the retained EU law Directive 2009/128/EC of the European Parliament and of the Council(15) (equivalent to the EU Sustainable use of Pesticides Directive 2009/128/EC) that member states should promote low pesticide input pest management, in particular Integrated Pest Management (IPM). The Directive defines IPM as follows “‘integrated pest management’ means careful consideration of all available plant protection methods and subsequent integration of appropriate measures that discourage the development of populations of harmful organisms and keep the use of plant protection products and other forms of intervention to levels that are economically and ecologically justified and reduce or minimise risks to human health and the environment. ‘Integrated pest management’ emphasises the growth of a healthy crop with the least possible disruption to agro-ecosystems and encourages natural pest control mechanisms.”
Information about the uptake of IPM measures by Scottish growers was collected alongside the 2020 arable crops pesticide usage survey. IPM data have previously been collected and published for all crop groups in our cycle of pesticide usage surveys (vegetable crops 2015 & 2019, protected edible crops 2015 & 2019, arable crops 2016, soft fruit crops 2016 and fodder crops 2017). Our intention is to monitor IPM uptake in each crop sector every four years. This 2020 IPM survey represents the second in the series of surveys of IPM measures on arable crops, allowing the adoption of IPM techniques to be monitored. These datasets will be used as an indicator of the success of Scottish Government funded IPM research, knowledge transfer and promotion activities.
Unlike the other statistics in this report, the figures reported in this section are not raised to produce national estimates but represent only the responses of those surveyed. The IPM sample, whilst smaller than that sampled for the pesticide usage survey, provides a good representation of Scottish regions and farm size groups.
Pearson chi-square tests were used to assess statistical evidence for changes, with permutation tests used when expected values were five or less. When comparing between 2016 and 2020, any evidence of a statistical change in the proportion of growers reporting under a category is indicated by a p-value. Any other notable differences that might indicate a direction of travel are also recorded in the text. If no comparison is made, then the responses recorded are similar between 2016 and 2020.
In total IPM data was collected from 242 growers representing 248 holdings and collectively growing 32,083 ha of crops. This sample represented six per cent of Scotland’s 2020 arable crop area. Of these growers, 72 per cent had an IPM plan (45 per cent completed their own IPM plan and 27 per cent had a plan completed by their agronomist) and 29 per cent did not have an IPM plan (Figure 32). There is very strong evidence that the proportion of growers completing an IPM plan has increased from the 2016 survey where 24 per cent of growers had a plan (p-value <0.001). Using an IPM plan helps growers to make the best possible, and most sustainable, use of all available methods for pest control.
Since the 2016 survey, the requirement to complete an IPM plan has been added to the most widely used UK farm assurance schemes; for example, farmers certified with Red Tractor are required to complete the NFU/VI IPM plan. Scottish farm businesses certified by Scottish Quality Crops (SQC Ltd) must complete an IPM plan, a biodiversity plan and a soil testing plan(16).
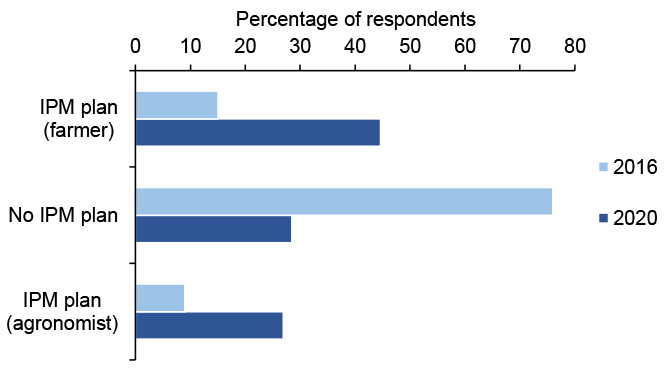
Although more plans were completed in 2020, there was no change in the proportions of plans completed by growers and by agronomist, with around 62 per cent of IPM plans completed by growers and 38 per cent completed by agronomists in 2020 and 2016. Of those growers who had an IPM plan in 2020, either completed themselves or by their agronomist, 53 per cent used the Scottish Government IPM plan, 19 per cent used the NFU/VI plan and 4 per cent used other plans (Figure 33). A quarter of responses, 25 per cent, said they or their agronomist had completed a plan but were not sure which plan it was.
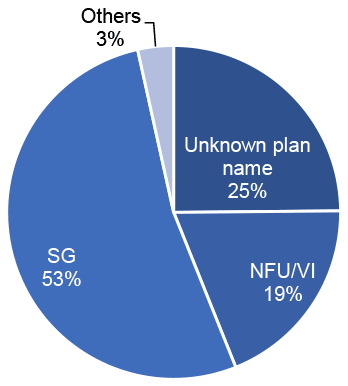
Note: Others include Agrii, Accura, Gatekeeper, LEAF
Farmers were asked about their IPM activities in relation to three categories; risk management, pest monitoring and pest control. Information was collected about all activities each grower conducted in relation to these categories and the responses are reported in the following sections. The term ‘pest’ is used throughout to denote diseases, weeds and invertebrate pests.
Risk management
IPM programmes aim to prevent or reduce the risk of pests becoming a threat by minimising the likelihood of damage occurring that will require subsequent control. Table 36 presents an overview of the risk management measures adopted by those growers surveyed. In both 2020 and 2016, all growers sampled reported that they implemented at least one measure associated with an IPM risk management approach. There was evidence for an increase in the proportion of growers reporting the implementation of two of the risk management questions between 2016 and 2020, including cultivation at sowing to reduce pest risk and soil testing.
| Risk management activity | Percentage positive response | |
|---|---|---|
| 2020 | 2016 | |
| Crop rotation | 88 | 88 |
| Soil testing | 100 | 96 |
| Cultivation of seed bed to reduce pest risk | 92 | 93 |
| Cultivation at sowing to reduce pest risk | 64 | 44 |
| Varietal or seed choice to reduce pest risk | 93 | 93 |
| Catch and cover cropping | 34 | 27 |
| Protection or enhancement of beneficial organism populations | 90 | 88 |
| Cleaning machinery between fields | 72 | N/A |
| Any risk management | 100 | 100 |
Note: In 2016 growers were not directly asked about cleaning machinery between fields.
N/A = not applicable
Eighty-eight per cent of growers in both 2020 and 2016 used crop rotation to reduce the risk of pest damage. Rotation breaks the link between pathogen and host, reducing pest population build-up. It can also improve soil fertility and structure, and consequently crop vigour.
Evidence was found for an increase in the proportion of growers responding positively to testing their soil (p-value 0.003), although this is a modest increase (100 per cent in 2020 compared with 96 per cent in 2016) (Table 36). Soil testing allows growers to make informed decisions about the inputs required and optimal crop choice for their land. Most testing encountered in 2020 was for pH or lime (97 per cent). This was the biggest change observed from 2016, however, growers were not asked directly about testing soil for pH or insects in 2016, therefore these responses are underestimated in 2016 and classified under ‘Other’ (Figure 34). There was a decrease in 2020 in the proportions of growers testing for nutrients (92 per cent in 2016 to 88 per cent in 2020). There was an increase in 2020 for testing for nematodes (19 per cent to 23 per cent). In 2020, similar proportions of growers tested for leatherjackets (two per cent), soil borne disease (eight per cent in 2016 to seven per cent in 2020) and wheat bulb fly (two per cent in 2016 to one per cent in 2020).
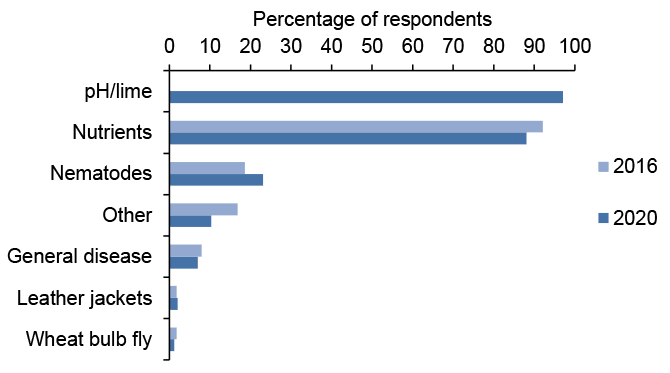
Note: In 2016 growers were not directly asked about testing for pH or lime. However, pH testing was recorded under ‘Other’ in 2016. Therefore the 2016 data are underestimated.
‘Other’ in 2020 included tests for club-root, wireworm, rhizoctonia, powdery scab, organic matter testing, worm and slug counts
‘Other’ in 2016 included pH, sulphur and eelworm
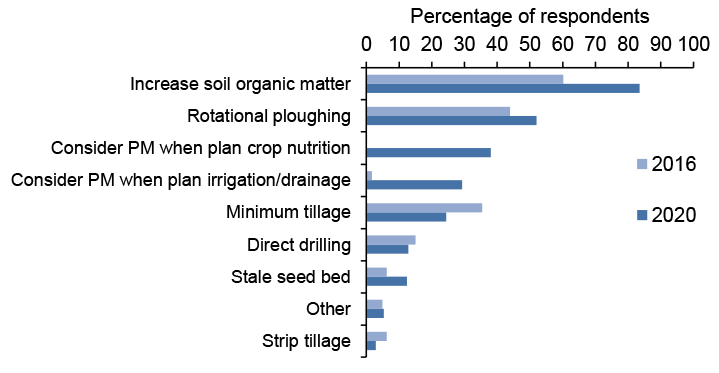
The majority of growers in 2020 (92 per cent) and in 2016 (93 per cent) reported that they managed their seed bed agronomy to improve crop performance and reduce pest risk (Table 36). In 2020, 83 per cent of growers increased soil organic matter which was an increase from 60 per cent in 2016. Twelve per cent in 2020 used a stale seedbed for weed management compared with six per cent in 2016 (Figure 35). Stale seed beds allow weeds to germinate before sowing the next crop; these are often treated with a herbicide, depleting the seed bank, and resulting in lower weed pressure, and potentially pesticide use in the succeeding crop. Twenty-nine per cent of growers considered pest management when planning irrigation and drainage, an increase from two per cent in 2016, however this was not directly asked in 2016 and was captured under ‘Other’. Thirty-eight per cent of growers also considered pest management when planning crop nutrition however this question was not asked directly in 2016 and cannot be compared. Other methods employed by growers in 2020 included using non-inversion techniques such as minimum tillage (24 per cent) and direct drilling (13 per cent) and 52 per cent using rotational ploughing. These techniques can preserve organic matter in the soil. For comparison in 2016, 35 per cent carried out minimum tillage, 15 per cent direct drilling and 44 per cent rotational ploughing. In 2020, other seed bed cultivation techniques captured during the survey included consolidating seed beds and cultural control (rolling, power harrowing, discing stubbles and application of hen manure) primarily for the control of slugs but also for leatherjackets. In 2016, other techniques included considering pest management when planning irrigation, using a straw rake, shallow cultivations or rolling to control slugs.
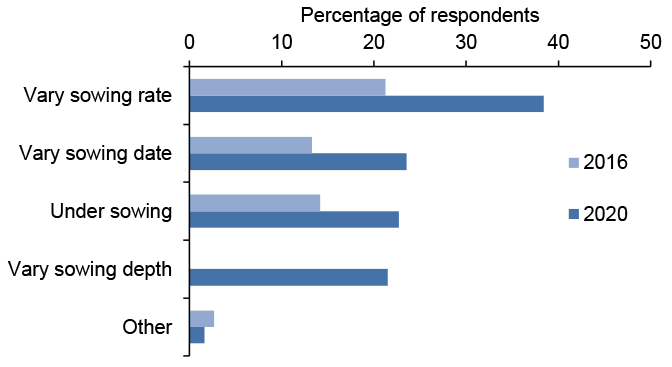
In 2020, 64 per cent of growers amended cultivation methods at sowing with the aim of increasing crop success, a significant increase from the 44 per cent recorded in 2016 (Table 36). Thirty-eight per cent varied the sowing rate, 24 per cent varied the sowing date and 23 per cent used under sowing in 2020 (Figure 36). In 2016, 21 per cent varied the sowing rate, 13 per cent varied the sowing date and 14 per cent used under sowing, all less than in 2020. Twenty-one per cent varied the sowing depth in 2020, however this question was not directly asked in 2016 so cannot be compared. Two per cent used other cultivation methods at sowing in 2020, similar to 2016 (three per cent). Other techniques in 2020 included changing the orientation of sowing and switching to winter cropping rather than in spring due to leatherjackets. In 2016, other included drilling headlands after crop to reduce slugs, considering pest management when planning nutrition and sowing deeper when crows are a problem.
Note: ‘Other’ in 2020 includes cultivations to control slugs such as rolling, harrowing, applying hen manure and discing stubbles. Also power harrowing to control leatherjackets and burying weed seed
‘Other’ in 2016 includes considering pest management when planning irrigation, using a straw rake, shallow cultivations or rolling to control slugs
PM = pest management.
Note: ‘Other’ in 2020 includes changing the orientation of sowing and winter cropping rather than in spring due to leatherjackets
‘Other’ in 2016 includes drilling headlands after crop to reduce slugs, considering pest management when planning nutrition and sowing deeper when crows are a problem.
In 2016 growers were not specifically asked about varying sowing depth.
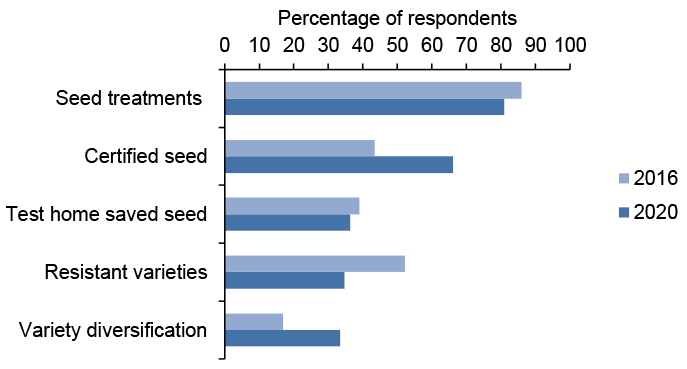
The majority (93 per cent) of growers in 2020 and 2016 considered risk management when selecting seeds and/or varieties (Table 36). In 2020 there were decreases in the proportions of growers using seed treatments, resistant varieties and testing home saved seed when compared to 2016 (Figure 37). Eighty-one per cent of growers used seed treatments, both pesticide seed treatments to protect seedlings at crop emergence (80 per cent) and growth promotors to improve crop establishment (16 per cent). Thirty-five per cent selected pest resistant varieties to reduce damage and the need for pesticide input, 66 per cent used certified seed and 36 per cent tested home saved seed. Thirty-three per cent of growers used diversification of varieties to increase overall crop resilience to pests and environmental stresses.
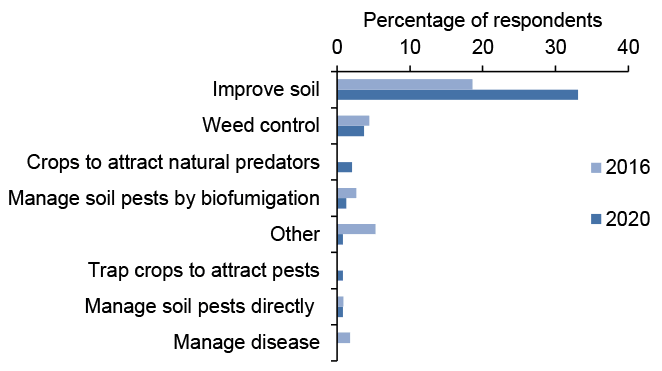
Thirty-four per cent of growers sowed catch or cover crops in 2020, a small increase from 27 per cent in 2016 (Table 36). In 2020, 33 per cent of growers used cover and catch crops such as clover and phacelia to improve soil quality, an increase of 14 per cent from 2016 (Figure 38). Four per cent were used to suppress weeds, two per cent used crops such as oilseed radish to attract natural predators, one per cent used crops such as mustard with bio-fumigation properties and one per cent used crops to manage soil pests directly. One per cent used trap crops to attract pests. In 2020, other techniques highlighted were cover crops to prevent winter runoff and soil erosion as well as companion crops. Other techniques in 2016 included Ecological Focus Area, catch crop, companion crop and stopping runoff from soil.
Note: In 2020, ‘Other’ techniques highlighted were cover crops to prevent winter runoff and soil erosion as well as companion crops.
‘Other’ techniques in 2016 included Ecological Focus Area catch crop, companion crop, stopping runoff from soil.
In 2016, growers were not specifically asked about using crops to attract natural predators.
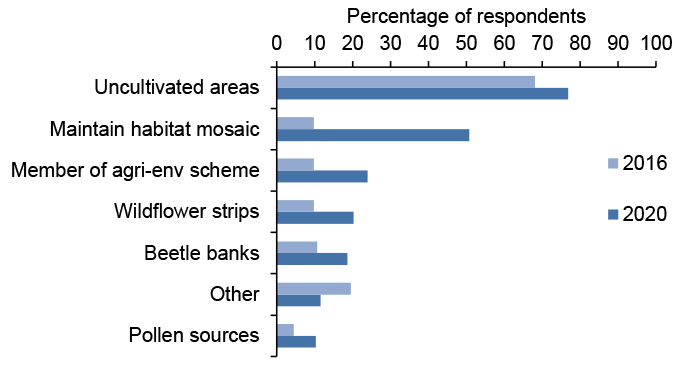
Finally, 90 per cent of growers stated that they adopted techniques to protect or enhance populations of beneficial organisms, similar to 88 per cent in 2016 (Table 36). In 2020 there were increases in all of the categories which were surveyed in 2016 (Figure 39). Seventy-seven per cent left uncultivated areas, including leaving margins, headlands, headlands and other areas wild and using buffer strips to increase biodiversity. Fifty-one per cent maintained a habitat mosaic including planting and maintaining hedgerows, tree planting and wetland restoration. Ten per cent planted pollen sources and 20 per cent planted wildflower strips. Nineteen per cent had beetle banks. Twenty-four per cent took part in an agri-environment scheme, with the main scheme reported as the Scottish Government agri-environment climate scheme (AECS). A number of other actions to support beneficial organism populations were also reported in 2020. These additional measures included planting wild bird seed, leaving winter stubbles and not using insecticides. Other categories in 2016 included maintaining hedging and wetland areas.
Note: In 2020, ‘Other’ activities included planting wild bird seed, leaving winter stubbles and not using insecticides
In 2016, growers were not specifically asked about maintaining habitat mosaic or beetle banks. However, these were recorded under ‘Other’ in 2016. Therefore, responses will be under reported in 2016.
Pest monitoring
In IPM, pests are monitored both to determine whether control is economically justified and to effectively target control options. IPM programmes aim to monitor and identify pests, so that appropriate control decisions can be made in conjunction with action thresholds. Table 37 presents an overview of the pest monitoring measures adopted by the growers surveyed in 2016 and 2020. The responses show little change between 2016 and 2020. In both years, all of the growers sampled (100 per cent) reported they implemented at least one pest monitoring measure.
| Pest monitoring activity | Percentage positive response | |
|---|---|---|
| 2020 | 2016 | |
| Setting action thresholds for crops | 71 | 68 |
| Monitor and identify pests | 100 | 100 |
| Use of specialist diagnostics | 53 | 58 |
| Regular monitoring of crop growth stage | 98 | 99 |
| Any pest monitoring activity | 100 | 100 |
All growers surveyed reported that they regularly monitored and identified pests and 98 per cent regularly monitored crop growth stages (Table 37). Most growers (71 per cent) also used action thresholds when monitoring pest populations. Over half (53 per cent) reported that they used specialist diagnostics to identify pests.
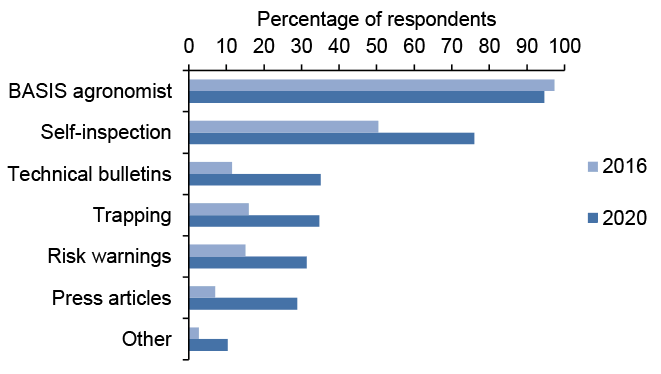
Pest monitoring information was primarily gained by seeking advice from a BASIS qualified agronomist (95 per cent in 2020 and 97 per cent in 2016) (Figure 40). There was an increase in the proportion of growers using self-inspection of crops to collect information from 50 per cent in 2016 to 76 per cent in 2020. In 2020 there were increases in the use of risk warnings, technical bulletins and press articles (31, 35 and 29 per cent of growers respectively). Trapping was used by 35 per cent of growers (primarily for slugs), an increase from 16 per cent in 2016. Other methods of pest monitoring reported in 2020 included using phone applications, using weather data to estimate risk, using local information from other farmers/growers and using the internet to monitor/identify pests. In 2016 other methods only included information from local farmers and growers.
Note: ‘Other’ included using weather data to estimate risk, using local information from other farmers/growers and using the internet or phone apps to monitor/identify pests.
‘Other’ in 2016 only included information from local farmers and growers.
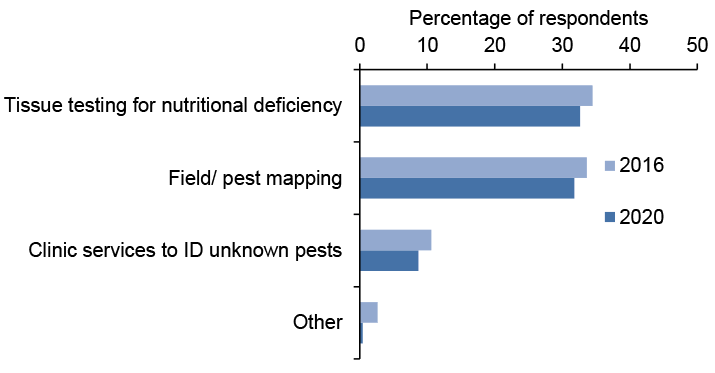
Fifty-three per cent of respondents also used specialist diagnostics when dealing with pests that were more problematic to identify or monitor in 2020 (Table 37). Thirty-three per cent used tissue testing for nutritional deficiencies. Thirty-two per cent of growers used field or pest mapping (predominately field mapping which includes soil mapping) to aid crop monitoring (Figure 41). Nine per cent of growers used clinic services to identify unknown pests. All of these categories were very similar to the responses in 2016 (34, 35 and 11 per cent respectively).
Note: ‘Other’ in 2020 included calculating Green Area Index (GAI)
‘Other’ in 2016 included using nitrogen sensors for variable rate application, and using applications on phone
Pest control
If monitoring, identification, and action thresholds indicate that pest control is required, and preventive methods are no longer effective or available, IPM programs evaluate the best control method in relation to effectiveness and risk. Control programmes incorporate non-chemical methods alongside, or instead of, chemical control. Use of chemical pest control should be as targeted as possible and the risk of resistance development should be minimised. The effectiveness of the control programme should be reviewed regularly to gauge success and improve their regime as necessary. Table 38 presents an overview of the pest control measures adopted by the growers surveyed. Of the holdings sampled in 2020, two per cent were organic, the same proportion as in 2016.
All of the growers sampled in 2020 and in 2016 adopted at least one IPM pest control activity. There is an increase in 2020 on the use of non-chemical control, targeted pesticide application and following anti-resistance strategies. There was evidence for an increase in the proportion of positive responses to targeted pesticide application techniques (p-value = 0.005) and very strong evidence for an increase in the proportion of positive responses to implementing anti-resistance strategies (p-value < 0.001).
| Pest control activity | Percentage positive response | |
|---|---|---|
| 2020 | 2016 | |
| Non-chemical control used in partnership or instead of chemical control | 74 | 68 |
| Targeted pesticide application | 85 | 73 |
| Follow anti-resistance strategies | 91 | 73 |
| Monitor success of crop protection methods | 98 | 100 |
| Any pest control activity | 100 | 100 |
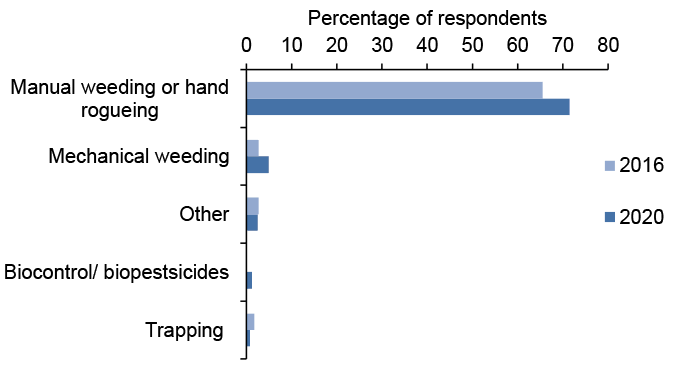
Seventy-four per cent of growers reported that they used non-chemical control in partnership or instead of chemical control, a small increase from 68 per cent in 2016 (Table 38). The most common non-chemical method employed in 2020 was manual weeding or hand rogueing used by 71 per cent of respondents, an increase from 65 per cent in 2016 (Figure 42). Hand rogueing was primarily to control wild oats, but control of brome, ragwort and volunteers was also recorded. A range of physical control methods, which prevent pest access to the crop, were also used. Trapping was used by one per cent of growers in 2020 and two per cent in 2016. The use of biocontrol and biopesticides was encountered in one per cent of surveyed holdings. Other methods of non-chemical control used in 2020 were using straw mulches, applying mineral oil to potato crops to prevent virus transmission and use of biostimulants. Other non-chemical methods used in 2016 included growing winter oilseed rape under nets and mechanically removing slug eggs.
Note: ‘Other’ in 2020 includes using straw mulches, applying mineral oil to potato crops and use of biostimulants.
‘Other’ in 2016 included growing winter oilseed rape under nets and mechanically removing slug eggs
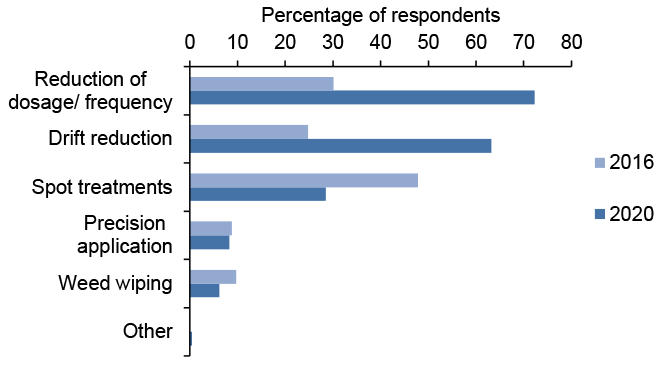
Eighty-five per cent of growers in 2020 stated that they targeted their pesticide applications to reduce pesticide use, an increase from 73 per cent in 2016 (Table 38). The most common method, used by 72 per cent of growers in 2020, was reducing the dosage or frequency of pesticide applications, an increase from 30 per cent in 2016 (Figure 43). Sixty-three per cent of growers targeted pesticide application by using drift reduction apparatus, an increase from 25 per cent in 2016. Precision application methods, such as the use of GPS were used by eight per cent of growers, similar to the proportion recorded in 2016 (nine per cent). Spot treatments (applying only to the affected area) were used by 29 per cent of growers in 2020, compared to 48 per cent in 2016 to combat weeds including docks, thistles, wild oats and couch. The use of weed wiping (direct herbicide application to weeds taller than the host crop), decreased from 10 per cent in 2016 to six per cent in 2020. Other methods used for targeting pesticide application in 2020 included downloading specific resistance action guidelines for crops to ensure only effective active substances were applied.
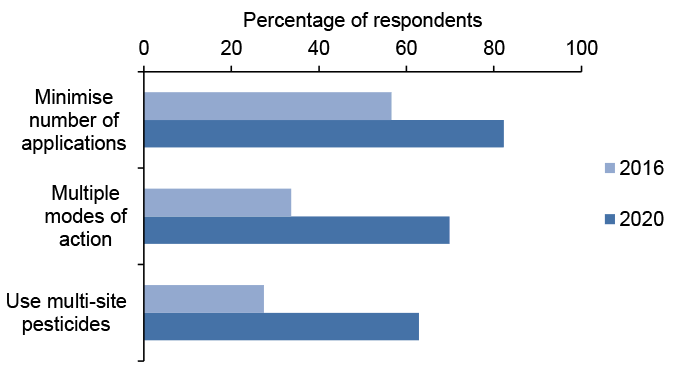
In addition, 91 per cent of growers in 2020 stated that they followed anti resistance strategies, an increase from 73 per cent in 2016 (Table 38). Anti-resistance strategies are used to minimise the risk of development of pest resistance. In 2020, 82 per cent of growers stated they minimised the number of pesticide applications used, an increase from 57 per cent in 2016 (Figure 44). Seventy per cent of growers in 2020 used a range of pesticides with multiple modes of action, an increase from 34 per cent in 2016. Sixty-three per cent of growers used pesticides with multi-site modes of action, compared to only 27 per cent in 2016. This is despite the loss of chlorothalonil from the market in 2020 which was the principal multi-site active used on arable crops.
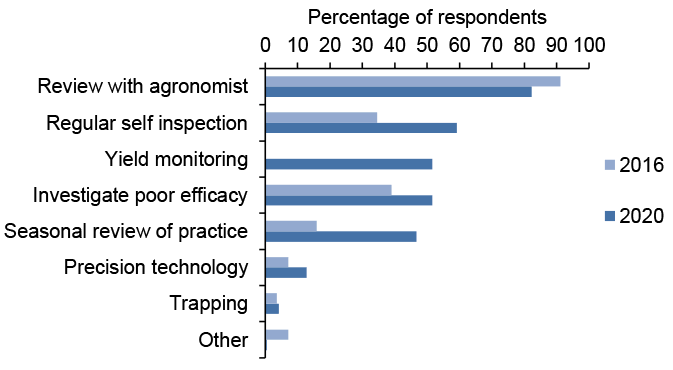
An important aspect of IPM is monitoring the success of risk management and crop protection practices to continually improve regimes. Ninety-eight per cent of growers in 2020 stated that they monitored the success of their crop protection measures, similar to the proportion in 2016 (100 per cent) (Table 38). Between 2016 and 2020, there has been a decrease in the proportion of growers having a regular review with their agronomist and an increase in the proportion using regular self-inspection to monitor their crop protection success. In 2020, 82 per cent of growers had a regular review with their agronomist to monitor crop protection success, a decrease from 91 per cent in 2016 and 59 per cent of growers conducted regular self-inspections of their crops, an increase from 35 per cent in 2016. There was a similar increase in the use of self-inspection to monitor and identify pests from 2016 to 2020 (Figure 45). However, the majority of respondents in both years sought advice from a BASIS qualified agronomist for pest monitoring and identification. Seasonal review of practice, investigating causes of poor efficacy and use of precision technology were used by a larger proportion of growers in 2020 compared to 2016 (47, 52 and 13 per cent respectively in 2020 and 16, 39 and seven per cent in 2016). Trapping was used on four per cent of holdings in 2020 and in 2016. Other methods recorded for monitoring success in 2020 included comparisons with trial plots where pesticides are not applied. Other methods recorded in 2016 includes measuring success by examining the results of harvest and comparing with historic yields and independent trials. This was directly asked in the 2020 survey where 52 per cent of growers said they used yield monitoring to monitor the success of crop protection methods.
Note: In 2020, ‘Other’ includes trial plot where pesticide is not applied
In 2016 'Other' includes measuring success by examining the results of harvest and comparing with historic yields and independent trials
In 2016, growers were not specifically asked about yield monitoring
Contact
Email: psu@sasa.gov.scot