Negative Emissions Technologies (NETS): Feasibility Study
This study estimates the maximum Negative Emissions Technologies (NETs) potential achievable in Scotland, 2030 - 2050.
4. Economic feasibility of nets at existing and new sites
This section outlines the methodology used to assess the investment and operating costs of converting a site to deliver negative emissions based on a Levelised Cost of Carbon (LCOC) parameter. The LCOC, along with other factors like site location, stakeholder feedback on technologies, and site age, was then used to determine the likelihood a candidate site would convert to a carbon removal or NETs project. This enabled sites to be compared and categorised into the various pathways described later in Section 5.
4.1 LCOC methodology
The LCOC served as a filtering mechanism to determine whether a site would likely convert to a NETs and hence be included in the subsequent pathways, as the higher the LCOC the less economically attractive the site. Note that the LCOC for a site varied depending on the choice of pathway, with revenues associated from negative emission trading being included in pathway 3, whilst pathways 1 and 2 only included revenue streams from the site itself. For existing sites, no revenue streams were accounted for within Pathways 1 and 2, whilst they were for future sites.
The LCOC of a site was calculated using:
- the investment cost of retrofitting a site with CCS (CAPEX),
- the Capital Recovery Factor (CRF), a figure used to annualise the investment cost,
- the variable and fixed OPEX, which accounts for the annual operating and maintenance costs of CCS,
- the annual cost of transporting and storing the carbon; and
- the annual NETs potential including both biogenic and fossil emissions.
See Appendix 2 of the technical appendices document for the definitions of each parameter involved.

The LCOC threshold (i.e., the LCOC that a site had to achieve to be included in the pathway was £80/tCO2 in 2025 – this value was chosen as it was broadly in-line with current EU ETS trading prices. The LCOC threshold price had an inflation added such the LCOC threshold increases year on year (see Figure 6, page 52).
4.1.1 Cost analysis
This section provides an overview of the methodology used to determine the CAPEX, OPEX, and CO2 transport and storage costs. A thorough breakdown of the specific methodologies and assumptions used for each NET, as well as example calculations, are provided in Appendix 2 of the technical appendices document.
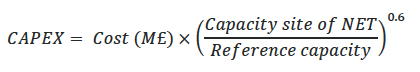
CAPEX: In estimating the CAPEX, the widely used sixth-tenths rule was employed[52], which is a method for approximating a project’s costs by taking the cost of a comparable completed project and scaling it by the exponent 0.6, based on the capacity of the reference plant. This scaling can be done by considering various factors such as CO2 capture potential, heat/power production, and biomethane production. An example calculation is provided below.
This methodology was used for both existing and potential future sites. For existing sites, the cost analysis focused solely on CCS retrofit expenses. In contrast, future sites factored in additional costs associated with constructing the NET site itself. Specifically, BECCS Power and EfW sites accounted for the construction of the energy centre, while BECCS Biomethane sites considered the construction of both the AD Plant and AD Upgrading facility. Refer to Appendix 2 of the technical appendices document for a thorough breakdown of the specific methodologies and assumptions used for each NET, as well as example calculations.
It's important to note that this method provides a quick and rough estimate of costs. However, it should be used with caution, as it may not encompass all the unique aspects and complexities of a project. Since a detailed cost analysis for each NET site would not have been feasible due to resource and time constraints of this project, using this method was deemed the most economical approach to this task.
OPEX: OPEX is divided into two categories: fixed and variable costs. Fixed OPEX encompasses ongoing expenses that remain consistent regardless of the production or operational level. Examples include salaries, equipment maintenance, and insurance. Variable OPEX includes costs that fluctuate based on the level of production or operation. These can include raw materials, fuel, and energy consumption.
Cost benchmarks were not used to determine fixed and variable OPEX of existing sites, due to significant variations in assumptions and parameters found in the literature. Utilising these benchmarks would lead to incomparable costs. Instead, fixed OPEX was estimated to be 5% of the CAPEX[53], and variable OPEX considered increases in electricity and heat usage only. The only exception was the Dunbar Cement site, where site specific data was unavailable. When evaluating future sites, it was necessary to consider the overall costs associated with both installing and operating a NET. To accomplish this, cost benchmarks were employed in their entirety and then scaled up using the sixth-tenths rule. Although this approach may lead to potential cost overestimation, this conservative cost approach was deemed to be the most appropriate given the time and resource constraints on the project.
To validate the assumptions, the respective costs were compared to industrial benchmarks (see Appendix 2 of the technical appendices document). The overall estimation was reasonably close, with costs falling within +- 39% of each other. As for variable OPEX, the assumption was supported by the fact that heat and power usage are the primary components of variable costs mentioned in the literature. However, in reality, the variable OPEX for a CCS facility is a complex component with very limited available published data. The variable OPEX was cross-referenced against the LCOC results to ensure consistency with literature.
The prices for heat and power used to determine variable OPEX were 14.6 p/kWh (power), based on Ofgem’s wholesale market indicators[54], and 4p/kWh (heat), which was assumed, based on Ricardo’s internal modelling and expert judgement and knowledge of recent DH schemes. The assumed low price of heat was justified by the fact that the heat price was being considered at the export point, rather than the price at which heat is sold directly to the customer. In this scenario, the generator sells heat to a third party at 4p/kWh.
The heat price assumption is relevant for biomass and EfW sites and is applied in calculating the loss of revenue due to the majority of heat recovered from the generation process being used to satisfy the CO2 capture process. Increasing the heat price to 6p/kWh increases revenue in comparison to the reference case (i.e., based on 4p/kWh) and leads to a 13-20% increase in LCOC for the existing CHP and EfW sites and 0-4% for new sites. This relatively small change in LCOC did not have an impact in the total NET potential for the pathways as it did not lead to additional sites deemed feasible to include as a result of the additional heat revenue.
CAPEX and OPEX benchmarks: Table 15 lists the respective cost benchmarks used in the analysis. These were adjusted for inflation using indices provided by the World Bank[55], and subsequently converted to British pounds Sterling using OECD exchange rates[56]. This ensured a fair and consistent comparison across all NETs. The indexes and exchange rates used are detailed in Appendix 2 of the technical appendices document. The costs listed under the heading ‘CCS Costs’ account for existing sites, whilst those under ‘Plant Costs’ account for future sites.
CAPEX and OPEX benchmarks
| NET | CCS Costs | ||||
|---|---|---|---|---|---|
| Capacity | CAPEX (M£) | Fixed OPEX (M£/year) | Variable OPEX (M£/year) | Reference | |
| BECCS Biomethane | 0.0044 MtCO2/year | 0.86 | 0.03 | 0.17 | Lars-Julian Vernersson[57] |
| BECCS Power/Industry (Wood) | 498 MWe | 346.97 | 13.88 | 1.08 | BEIS (2018)[59] |
| BECCS Industry (Cement) | 2328.77 t,clinker/day | 192 | 8.6 | 72.7 | AECOM (2022)[53] |
| BECCS Fermentation | 0.13 MtCO2/year | 5.93 | 0.40 | 1.25 | US Department of Energy (2014)[60] |
| BECCS EfW/ACT | 0.3 MtCO2/year | 96.8 | 4.7 | 17.7 | AECOM (2022)[53] |
| NET | Plant Costs | ||||
|---|---|---|---|---|---|
| Capacity | CAPEX (M£) | Fixed OPEX (M£/year) | Variable OPEX (M£/year) | Reference | |
| BECCS Biomethane | 230 m3/hr | 4.78 | 0.52 (total OPEX) * | Mattia De Rosa[58] | |
| BECCS Power/Industry (Wood) | 498 MWe | 876.81 | 45.70 | 2.48** | BEIS (2018)[59] |
| BECCS Industry (Cement) | N/A | N/A | N/A | N/A | N/A |
| BECCS Fermentation | N/A | N/A | N/A | N/A | N/A |
| BECCS EfW/ACT | 0.39 Mt,waste/year | 247.17 | 5.52 | 20.97 | Catapult Energy Systems (2020)[61] |
*Units of £/m3
**This benchmark does not include the cost of using biomass feedstocks. This additional cost of biomass feedstock is taken to be ~£25/MWh (used in BEIS CCS report)[62] and is applied later in the calculations
CO2 Transport: It was assumed that the Feeder 10 pipeline would be re-purposed to transport CO2 to Peterhead and to the St Fergus gas terminal, with the CO2 stored permanently in the North Sea. It was assumed that the capture location was the factor that determined whether the emissions could be considered to be of Scottish origin. Alternative storage locations across the UK were also considered, such as the Liverpool Bay area for HyNet and the coast of Humber and Teesside under the East Coast Cluster. These alternative storage locations meant that captured CO2 would be transported overground as there is no pipeline in place – this resulted in excessive costs for all sites, which tipped the LCOC analysis in a significantly unfavourable direction. Therefore, all captured emissions were assessed at being stored in the North Sea due to cost implications of transporting to other storage hubs. For more details on the transportation assumptions and associated costs, see section 1.6 of the technical appendices document.
The NET site locations were determined using X and Y coordinates found using a Grid Reference Finder[63] and mapped using GIS Mapping. The distances by road from these sites to the four injection points along the Feeder 10 pipeline were then calculated to estimate potential road transport costs. See Table 16 below for the list of pipeline injection points considered, and their respective distances to the St Fergus pipeline.
| Injection point | Location | Distance to St Fergus (km) |
|---|---|---|
| Bathgate | Start of Feeder 10 for injection into pipeline | 278 |
| Kirriemuir | Potential injection point on Feeder 10 | 214 |
| Garlogie | Potential injection point on Feeder 10 | 64 |
| St Fergus | End of Feeder 10 pipeline | 0 |
To minimise these transportation costs, the shortest distance by road was assumed for the initial leg of the journey. The final transportation cost was the summation of road transport, the direct pipe distance from one of the injection points to the St Fergus site, and the direct pipe distance from St Fergus to the Acorn storage site (80km)[48].
There were a number of additional assumptions that needed to be considered:
1.) The method ruled out any sites that were located on islands.
2.) The method did not consider the potential construction of additional pipelines for transporting CO2 from different locations to the feeder 10 pipeline. For instance, sites located in industrial clusters like Grangemouth may opt to transport captured CO2 directly through pipelines to the feeder 10 pipeline in the future. Therefore, transportation costs for certain sites may have been overestimated in the analysis.
3.) The road transportation analysis also considered transporting CO2 to other potential sites (i.e., HyNet and the East Coast Cluster). This was done to understand the effect not having an active storage facility in Scotland would have on costs.
CO2 Storage: Storage costs were taken directly from the IEAGHG EfW CCS paper[48], where the high-end costs were utilised to ensure the final results remained conservative. As these costs were quoted in a £/tCO2 basis, with no reference to plant size, then costs were linearly scaled up based on CO2 capture capacity. See section 1.6 of the technical appendices document for further detail.
Revenues: When considering future sites, the proposed revenue streams that were non-CO2 related had to be accounted for. Regarding BECCS Biomethane, revenue sales from biomethane were not considered as this fell outside of the established mass/energy balance boundary. However, for BECCS Power and EfW/ACT, revenue sales derived from the provision of both heat and power were considered. The same methodology and prices used to determine variable OPEX for existing sites were applied here, but instead of estimating the loss in heat and/or power revenues, the gain in heat/power revenues was considered. For further details, refer to the Cost Analysis section in Appendix 2 of the technical appendices document.
4.1.2 Relative profitability test for pathway
The relative profitability of a site was a test that was added to site inclusion in pathway 2: SG Action. It was applied to evaluate the potential product value uplift that would be required if a site was to implement NETs (and this was not applied in pathway 3 as there was a negative emission trading scheme included in this pathway, see 5.2.3.1, page 57).
The following parameters were tested:
Products/Parameters
- BECCS Power - Electricity & Heat
- BECCS EfW - Electricity & Heat
- BECCS Biomethane - Biomethane
- BECCS Fermentation - Whisky
- BECCS Industry - various products
The test calculated the impact of applying CCS at these sites and the impact on the mass/balance calculations was evaluated. The test involved keeping a constant output for the site and determining what the impact on input/throughput of product/raw materials was needed to maintain this output. The costs associated were then calculated and these were calculated as a % of product value. A low % uplift indicates that CCS could be applied at the site and there would not be a significant increase on product, a larger % indicates a higher uplift on costs (and thus less likely to remain profitable with CCS.
The result of this test was that high value products (Whisky) could remain profitable with CCS due to the high volumetric throughput. Similarly, biomethane can remain competitive as the impact of applying CCS at a biomethane site does not impact the inputs (as CO2 is already produced in a high quality stream, it is just not captured) and so should be able to be implemented at relatively low cost. More detail on this interim test is provided in see 5.2.3.1, page 57.
4.2 LCOC results
4.2.1 Existing sites
The LCOC of a site was used as the threshold point for whether or not it would be included in the various pathways (i.e., a site has to have an LCOC above the threshold in order for it to be included in the pathway). The LCOC calculation was based on the formula outlined in section 4.1. Revenue from trading of negative emissions (based on the UK ETS price) was considered only within Pathway 3 – UK Government and Scottish Government Action. Where the LCOC for a site was negative in this pathway, then it was included in the list of potential sites where NETs could be implemented.
Meeting this threshold did not mean that these sites would automatically be included in the final list of future sites that contribute to the NETs target for each pathway. Additional considerations were also taken into consideration as described in Section 5. There were several ways in which LCOC could be calculated, some of which are based on CO2 avoided and some on CO2 captured.
The approach adopted was based on CO2 captured and considered the increase in energy costs associated with that captured CO2, by fixing the fuel input rate and calculating the increase in heat or power demands of the site. This approach was applied to power generation in the Frontiers Economics paper[64], but was extended to other applications in this report. This method was justified given the fact that retrofitting existing sites was being considered rather than new builds, and focussing on the pathways analysis rather than the costings. The inputs and outputs are defined in section 2 of this report, whilst the various LCOC calculation methods employed, and their logic, are detailed in Appendix 2 of the technical appendices document.
The LCOC, which does not include any revenue from negative emissions trading for existing sites, are shown in Figure 5.
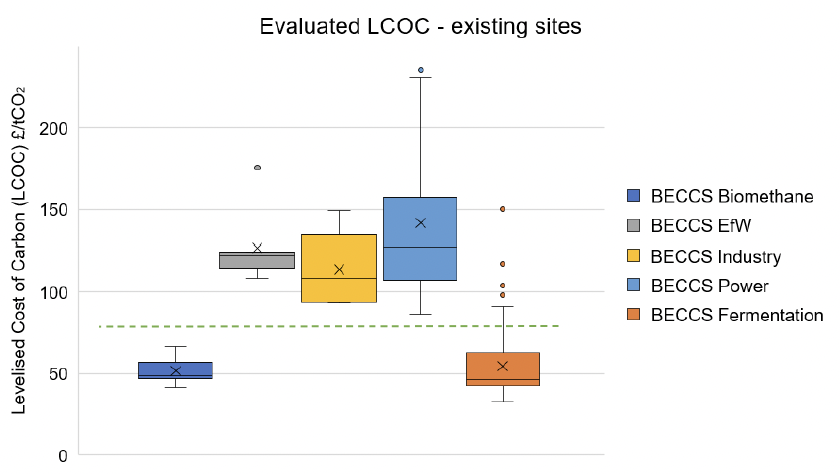
The X label indicates the exclusive median (i.e., the median is excluded from the calculation if the number of values in the dataset is odd), the horizontal lines indicate the upper and lower quartiles, and the dots are known as outliers (i.e., data points that are numerically distant from the rest of the data). The horizontal green line indicates a negative emission trading revenue of £80/tCO2 that is excluded in the calculation of LCOC.
There is a large difference in the LCOC per site within a technology category, which highlights both the differences in emitted carbon per site as well as the differences in components that make up the LCOC calculation. In particular, transportation costs can vary considerably depending on where the site is physically located and the route that any captured carbon would need to take prior to being permanently stored.
Figure 5 shows the LCOC as per the formula presented in section 4.1 – but does not include any revenue from any negative emissions trading. Figure 6 includes a revenue stream equating to £80/tCO2 for the negative emissions credits. The £80/tCO2 figure was used in the analysis based on an estimation of the UK ETS trade price in 2025. More details of this are shown in 5.2.3.1, page 57.
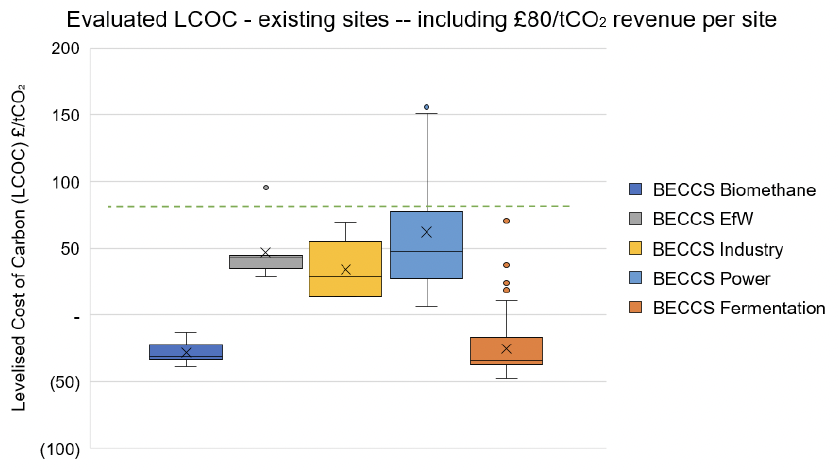
The X label indicates the exclusive median (i.e., the median is excluded from the calculation if the number of values in the dataset is odd), the horizontal lines indicate the upper and lower quartiles, and the dots are known as outliers (i.e., data points that are numerically distant from the rest of the data). The horizontal green line indicates a negative emission trading revenue of £80/tCO2 that is included in the calculation of LCOC.
Figure 6 replicates Figure 5 but includes the impact of revenue from potential negative emissions credits. For sites with a negative LCOC, this suggests that with the £80t/CO2 revenue then this would be an advantageous site to implement NETs. The sites with the lowest LCOC (in either figure) are those that could implement NETs at the lowest additional cost. When NETs credits are introduced, those with a negative LCOC are those that could profit from introducing NETs at that site.
The policies that support each pathway are outlined in section 5; however, the negative emission credit revenue is only included in pathway 3.
4.2.2 Future sites
Data was also available for power, biomethane, and EfW sites currently in planning. An assessment of the LCOC for adding CCS to these new sites was undertaken. Due to the high capital costs for CCS on power and EfW and due to the low volumes of CO2 involved in CO2 capture from biomethane, the analysis shows that none of these technologies can be economically attractive without a negative emission price. The future threshold emission price used in the analysis is shown in Figure 7, page 57.
Key conclusions from this analysis are as follows:
- EfW benefits from lower variable OPEX due to the negligible cost of waste feedstocks compared to alternative biomass feedstocks.
- Sites operating as CHP benefit from the fact heat recovered can be utilised directly into the CO2 capture process for solvent regeneration (typically required as low-pressure steam at 3 bar and temperature of around 120C) and so the energy penalty can be significantly reduced. It is thus advantageous for new EfW and power sites to consider operating as CHP and be part of DH systems if they also intend to install carbon capture in the future as this improves process efficiencies and reduces the energy penalty associated with CCS. Several EfW BECCS sites in Scandinavia are being developed as CHP and DH schemes which contributes to improving the overall economic feasibility.
- Advanced Conversion Thermal (ACT) technologies include waste gasification. Such systems can apply pre-combustion capture which is slightly less expensive than post-combustion capture.
- Several AD sites are being developed in Scotland. If these are developed as biomethane sites (i.e., to access the specific benefits and incentives applicable to biomethane available in the future), they provide an opportunity for CO2 capture from the biogas upgrade process and subsequently can become potentially NETs sites. The small volumes and the high CAPEX involved in constructing the conversion equipment to make an AD site a biomethane producing facility means that these will have a high LCOC and will thus require incentivisation if they are to develop as NETs projects. There are additional non-financial reasons that any site may choose to not develop NETs; for AD in particular there are additional regulatory reasons for the management of wastes (manures and slurries) that any future AD sites need to comply with.
4.3 Summary
Section 4 presented the results from the economic feasibility analysis. The purpose of the LCOC analysis was to compare sites on a common basis and to identify which sites fit into which pathway. When calculating the LCOC for existing sites, the cost of retrofitting CCS was only considered. The CAPEX was calculated using the sixth tenths rule, and OPEX was divided into fixed and variable costs; fixed OPEX was set at 5% of CAPEX, while variable OPEX was determined based on increases in electricity and heat demand. Regarding future sites, the LCOC included the additional costs of constructing the NET site itself, where CAPEX and OPEX benchmarks were fully applied and scaled up using the sixth tenths rule. Costs associated with CO2 transport and storage assumed that the Feeder 10 pipeline would be repurposed, the CO2 sent to the Acorn CCS Cluster, and the CO2 stored in the North Sea.
When comparing the LCOC of existing sites, it’s clear biomethane and distilleries can act as ‘low hanging fruits’ and can contribute to initiating and kick-starting a NET industry in Scotland, although at very small volumes. As will be discussed in the next section, this is subject to ensuring that the captured emissions are permanently stored. EfW can play a key role in achieving NET targets due to the regulations surrounding the incineration of waste, as well as CCUS being a key technology recommendation made in the independent review of the role of incineration in the waste hierarchy in Scotland[65]. On the other hand, BECCS Power and BECCS Industry both exhibit a high LCOC (averaging at £114/tCO2 and £142/tCO2), even when negative emission revenues are considered. This is an indication of additional government support being required if these sites are to become economical.
Contact
Email: NETs@gov.scot