Negative Emissions Technologies (NETS): Feasibility Study
This study estimates the maximum Negative Emissions Technologies (NETs) potential achievable in Scotland, 2030 - 2050.
3. Assessment of NETs potential in Scotland
3.1 Introduction
The analysis for this study considered the NETs potential and costs for:
i. converting existing sites to become carbon removal projects (e.g., existing biomethane, distillery, biomass CHP and EfW sites),
ii. the development of future NETs in Scotland (e.g., DACCS, biochar, hydrogen from biomass, biofuels and new biomass CHP and EfW sites), and
iii. fuel switching (e.g., fossil fuel sites converting to biomass).
A preliminary list of fossil fuel sites which could potentially fuel-switch to biomass as the fuel source was developed. However, due to lack of data, the prohibitive costs and the lack of appetite of such sites to convert to biomass and ultimately to become carbon removals, this option (iii above) was excluded from further analysis. In addition, it is expected that many industrial sites that currently consume fossil fuels are likely to consider converting to hydrogen rather than a bioenergy alternative.
The analysis relied heavily on data and evidence gathering through a comprehensive review of literature sources, recent studies and a stakeholder questionnaire combined with targeted interviews.
The section below outlines the methodology used to assess the total NETs potential for each of the NETs categories. This total potential represents the maximum achievable negative emissions without considering policy and economic constraints.
3.1.1 Key findings
- The maximum biogenic carbon available from existing sites in Scotland is currently 3.3 MtCO2/year. This falls short of the benchmark set by the CCPu (5.7 MtCO2/year in 2032 consisting of 5.2MtCO2/yr of BECCS and 0.5MtCO2/yr from DACCS)[14] by 2032. The maximum projected NETs potential for both existing and future sites (5.3 MtCO2/year) would not be achieved before 2032, falling below the 2032 benchmark set by the CCPu.
- NETs in the BECCS Power and BECCS Industry sectors accounts for 69% of the total NETs potential.
- EfW emerged as the predominant technology in terms of carbon removal potential, being able to capture 83% of the total carbon emitted (including non-biogenic CO2 originating from the non-biogenic part of the feedstock) but only accounted for 55% of the total NET potential, as not all EfW emissions are biogenic.
- The flexibility (e.g., municipal solid waste, MSW vs. refuse derived fuel, RDF) in feedstock selection means that EfW sites have greater variability in capture potential and costs. Whilst the composition can vary greatly, in general RDF has lower biogenic content and a higher calorific value than MSW. This difference in properties means that the design of CO2 capture processes can change from site to another leading to variation in performance and costs.
3.2 Net potential for existing and planned sites
A comprehensive list of existing and future planned sites in Scotland which emit biogenic carbon potentially contributing to NETs targets was developed. The list includes new DACCS and biochar developments, the deployment of BECCS on future biomass power and CHP, industry, EfW, biomass-based hydrogen and other potential BECCS sites. For each of the sites identified, the maximum NETs potential (considering the biogenic content of the fuel) was then calculated. Projections for future industries (e.g., power, cogeneration, EfW, hydrogen, biomethane and other industries) were developed based on historic trends and future demand estimates of the expected deployment and penetration rates of CCUS in each of these industries in order to predict the future potential of NETs in Scotland.
Data was obtained from publicly available sources including the Renewable Energy Planning Database (REPD), National Non-Food Crops Centre (NNFCC), Heat Networks Planning Database (HNPD), and Scottish Pollutant Release Inventory (SPRI). In addition, relevant CCUS papers and websites, news articles, and blog posts related to specific sites were also reviewed. These sources yielded valuable information about specific sites, including biomass/waste utilisation rates, heat and power outputs, production rates (such as biomethane, biogas, alcohol), and year of initial operation. Table 8 below shows a breakdown in the source of data used. The data collected was complemented and gaps addressed by engaging with key stakeholders, as discussed in Section 2. Finally, planning permission documents were also consulted to fill any knowledge gaps or cross-reference existing literature.
Note that the REPD is only applicable for sites that are currently in some form of planning, and therefore is only applicable until circa 2030. Beyond that, future sites across all technology categories are likely to be implemented depending on the specific political landscape and whether it is supportive of NETs. Therefore, penetration rates based on historic evidence, technology readiness and likely future policies which could encourage or discourage certain technological options were developed.
Table 8: Summary of data sources used to inform the CO2 capture calculations
Existing sites
- BECCS Biomethane - NNFCC*[35]
- BECCS Power - REPD[36]
- BECCS Industry - REPD**, HNPD[37], SPRI[38], CHPQA***, and websites
- BECCS AD - NNFCC and REPD
- BECCS Fermentation - Whisky Invest Direct[39], [40] and Scottish Carbon Capture Storage (SCCS)[47]
- BECCS EfW/ACT - REPD
Future sites in planning
- BECCS Biomethane - REPD and planning documents
- BECCS Power - REPD
- BECCS AD - REPD
- BECCS EfW/ACT - REPD and relevant websites/blog posts
*An amendment had to be made against the data quoted in the NNFCC and that stated in the planning application. See notes in Appendix 2 of the technical appendices document, for further information.
** Amendments had to be made against the data quoted in the REPD and that submitted under the CHPQA. See notes See notes in Appendix 2 of the technical appendices document, for further information.
*** Combined Heat and Power Quality Assurance
The database of potential sites was filtered, removing sites that lacked sufficient data or those sites that relied solely on fossil fuels for their heat and power demands. Sites located on islands were also excluded due to the small volumes of CO2 involved in addition to the impractical logistical challenges and relatively high costs associated with transporting CO2 by ship. Appendix 2 in the technical appendices document shows a detailed breakdown of all the sites included and disregarded in the analysis, along with the specific data related to each site and the sources from which the data was extracted.
A comprehensive list of sites which are currently in planning was developed and the potential for deploying BECCS on these sites estimated utilising penetration rates based on historic evidence, technology readiness and likely future policies which could encourage or discourage certain technological options. To create this list the REPD, planning permissions documents, and site-specific websites and blogs were reviewed.
To project capacity growth beyond 2030 a number of assumptions were made based on existing growth rates and demands for power, biomethane, and industry products. These were bounded by the available bioenergy resources (for BECCS & biochar) ensuring that the estimation of the NETs potential from future sites was not excessively ambitious.
NETs potential from new future industrial developments in Scotland was also considered. Data on such developments is limited as these are sites which are not currently in planning and include (for example) future developments of biomass CHP, biomethane or EfW sites. Projections of future power and heat demand, waste generation, and biomethane targets were used in combination with historic trends to estimate future demand and CO2 available from such sites. CCS deployment rates on new future sites was based on the analysis of existing sites and on the expected technology readiness to capture CO2 from specific sectors. For example, analysis, done for this study, on existing biomethane sites shows that 50% of existing sites are economically feasible to capture carbon dioxide and so it is estimated that at least 50% of future sites will also be equipped with CCS. A similar approach was also applied to future biomass CHP and EfW sites. This is all discussed in further detail in Section 5.
For hydrogen sites, it is expected that the majority of future targets in Scotland will be based on green hydrogen, with some blue hydrogen production. Biomass-based hydrogen production is expected to complement any future demand but is not expected to become a major contributor until the late 2030s. This assumption is based on the technology readiness and costs as well as competitiveness in the market. This is also supported by both Scottish Government’s Hydrogen Action Plan and the UK Government’s Hydrogen Strategy where the focus is mainly on green and blue hydrogen. Biomass gasification to produce hydrogen gas has several technical challenges to overcome through and so it is unlikely for hydrogen from biomass gasification to develop widely until the late 2030s.
3.2.1 NETs potential estimates: assumptions and methodology
The potential for NETs at each of the existing sites was estimated based on:
- The CO2 available from each of the sites (determined based on data gathered from a review of literature sources as well as stakeholder engagement),
- A consideration of the biogenic content of the fuel,
- An application of typical CO2 capture rates for each of the technology options
It should be noted that the NETs potential determined in this way is the maximum potential and assumes that the captured CO2 remains permanently stored and that no CO2 is lost during transportation. The sections below describe the specific methodology used for each of the NETs options, which is the same for existing and future potential sites.
A summary of the LCOC modelling parameters used are listed in Appendix 2 of the technical appendices document. An overview of the modelling parameters and assumptions used are:
- An assumed 90% CO2 capture efficiency has been used for all sites where pre- or post-combustion capture may be used, as discussed in section 1.2 of the technical appendices document. Capture rates for CO2 resulting from biogas to biomethane upgrading has been assumed to be 95%, based on Ricardo’s knowledge of current site performance.
- Different load factors were used depending on the choice of NET, ranging from 68% to 90%. These factors differ based on Ricardo’s industrial expertise as well referencing to the literature (see Appendix 2 of the technical appendices document).
- The gross power efficiencies for BECCS power and industrial sites were taken to be 38.7% and 35.7% when considering NETs capacities. Similarly, EfW/ACT sites have efficiencies of 22% (gross) and 19% (net).[41] These figures are taken directly from the literature (Appendix 2 of the technical appendices document).
- The heat and power efficiencies for a reference CHP site were estimated using the CHPQA Database. Regarding biomass powered CHPs, the power and heat efficiencies are taken to be 37.5% and 25% respectively, whilst waste powered CHPs exhibit efficiencies of 31% and 15% respectively.
- The quantity of CO2 produced by each NET was estimated using mass/energy balances and applying emission conversion factors that are taken from the literature (see Appendices 5, 11 and 12 of the technical appendices document for more details).
Below is an overview of the methodology employed for each specific NETS to assess CO2 capture potentials. A more comprehensive explanation and example calculations are given in chapter 2 and Appendix 2 of the technical appendices document.
3.2.1.1 BECCS Biomethane
In estimating the CO2 capture potential of a biomethane site, a mass and energy balance was conducted. This involved utilising the biomethane production rate, either obtained from the literature or manually calculated, and applying specific modelling parameters to back-calculate the CO2 produced during the biogas upgrade process. Key modelling parameters are the biomethane loss rate during the biogas upgrade process, the assumed biogas composition, and the assumed density of CO2 exiting the upgrader.
The CO2 production potentials determined through the mass balance were compared to benchmarks from the literature[42] and the values were found to be very close, deviating by +- 0.002 MtCO2/year, validating the assumptions and calculations used. See Appendix 2 of the technical appendices document for comparison.
The study also considered conversion of existing biogas production (AD sites) to biomethane sites incorporating carbon capture. However, after preliminary analysis these sites were subsequently excluded, due to the small CO2 volumes and high site conversion costs increasing the levelised cost of capture beyond economic feasibility. To see the list of existing biogas sites considered, see Appendix 2 of the technical appendices document.
3.2.1.2 BECCS Power and Industry
A similar methodology was implemented to estimate CO2 capture potential for existing power and industrial sites. This is justified since the combustion technologies used in BECCS Industry sites, such as biomass-powered turbines, boilers, and CHPs, are equivalent to BECCS Power sites.
The negative emission potential for each of the sites was estimated based on carbon content of the fuel input (determined from the gathered power output and using a factor of 0.35 kgCO2/kWh[43]) and applying the relevant CO2 capture efficiency. The estimated CO2 production potential for selected sites was compared to the SPRI Database where data was available. The comparison revealed a general alignment, as demonstrated in Appendix 2 of the technical appendices document, which supports the reasonableness of the assumptions and data sources used.
Due to limited data availability, the CO2 emissions rate provided by the SPRI database was relied upon to calculate the negative emission potential of the Dunbar Cement site assuming 40% of cement emissions result from fossil fuel combustion[44]. Additionally, considering the planned fuel mix of 45% RDF/SRF waste[45] with a biogenic content of 17%[46], the quantity of emissions classified as biogenic was able to be determined.
3.2.1.3 BECCS Distilleries and Breweries
For whisky distilleries and breweries, the negative emission potential was estimated by assuming that the sites operate like industrial bioethanol plants as these sites use the same process of fermentation where process CO2 emissions result. From this, the litres of pure alcohol (LPA) quoted in the literature was used and the CO2 production potential calculated using a conversion factor of 755 tonnes CO2 / Million litres of alcohol produced[47]. The resulting negative emission potential was determined using a capture efficiency of 90%.
3.2.1.4 BECCS EfW including waste gasification sites with pre-combustion carbon capture
For EfW (including advanced conversion thermal (ACT) sites such as gasification with carbon capture), the same methodology as BECCS Power/Industry was applied, but with variations in efficiencies, utilisation factors, and emission conversion factors.
One key difference between BECCS EfW/ACT and BECCS Power/Industry was the flexibility in feedstock selection, with EfW sites having the option to use either municipal solid waste (MSW) or refuse derived fuel (RDF). In comparison to MSW, RDF undergoes additional pre-processing. Whilst the composition can vary greatly, in general RDF has lower biogenic content and a higher calorific value than MSW[48]. As a result, there is greater variability in carbon capture potential and, consequently, capture costs for EfW facilities.
To validate the calculations, the calculated CO2 production rate was compared to literature benchmarks, observing a close alignment for MSW-powered sites (see Appendix 2 of the technical appendices document). This final finding reinforces confidence in the accuracy of the assumptions and methodology used.
3.3 Negative emission potential estimates: results
3.3.1 Existing sites
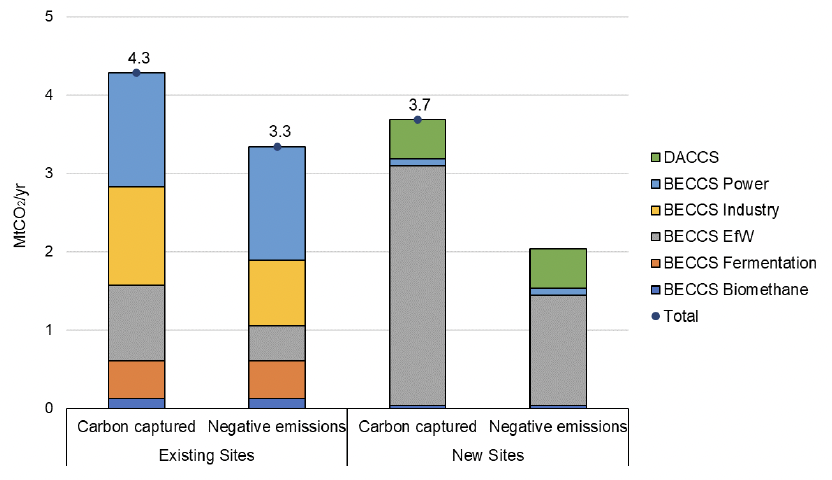
Figure 4, page 44 shows an overview of the carbon capture and hence NETs potential for existing sites which can potentially become carbon removal sites. It should be noted that the NETs potential corresponds to the capture and storage of biogenic emissions, whilst the total carbon captured accounts for both biogenic and fossil emissions. The maximum projected NETs potential of existing sites is 3.3 MtCO2/year, compared to the target set out in the CCPu (5.7 MtCO2/year by 2032)[14], confirming that whilst retrofitting of existing sites will contribute to this target, the development of future NETs sites is key. It also signifies that the target year of 2032 to achieve these NETs is unfeasible and a new, more realistic target and/or target year for NETs will be required.
3.3.1.1 BECCS Power and BECCS Industry
Figure 4, page 44 shows the NETs potential to be primarily concentrated in the BECCS Power and BECCS Industry sectors, accounting for 69% of the total NETs potential. Two-thirds of the NETs potential from the power sector is provided by the Markinch Biomass CHP Plant and Stevens Croft Power Station, due to their significant gross power capacities (combined 115.4 MWe) and utilisation of 100% biogenic feedstocks. This is clearly illustrated by the breakdown in capture potential for the five largest BECCS sites shown in Table 9 below.
| Site | NET | Carbon capture potential (MtCO2/year)[49] | Percentage of capture potential (sector specific)[50] | Percentage of capture potential (total)[51] |
|---|---|---|---|---|
| BECCS Power | ||||
| Markinch Biomass CHP Plant | BECCS Power (CHP) | 0.65 | 44% | 15% |
| Stevens Croft | BECCS Power | 0.32 | 22% | 7% |
| Speyside Biomass CHP Plant | BECCS Power (CHP) | 0.12 | 9% | 3% |
| Rothes Bio-Plant | BECCS Power (CHP) | 0.08 | 6% | 2% |
| Westfield Biomass Power Station | BECCS Power | 0.08 | 6% | 2% |
| BECCS Industry | ||||
| Dunbar Cement | BECCS Industry (Cement) | 0.44 | 35% | 10% |
| Morayhill Mill | BECCS Industry (Oriented Strand Board) | 0.31 | 25% | 7% |
| Caledonian Papermill | BECCS Industry CHP (paper - coated magazine) | 0.26 | 21% | 6% |
| Cowie Biomass Facility | BECCS Industry CHP (Particle & MDF) | 0.15 | 12% | 3% |
| Barony Road, Auchinleck | BECCS Industry CHP (Chipboard and wood recycling) | 0.05 | 4% | 1% |
Regarding BECCS Industry, Dunbar Cement is a significant potential contributor of captured carbon, representing 35% of the capture potential. However, the site’s NETs potential is low due to the use of solid recovered fuel (SRF). Consequently, the negative emissions potential of BECCS industry is only 0.85 MtCO2/year, from a total capture potential (biogenic and fossil CO2) of 1.26 MtCO2/year. When only biogenic emissions are considered, Norbord Morayhill (wood panel producer) and Caledonian Paper Mill account for the majority of the BECCS Industry NETs potential (67% when combined).
Regarding BECCS Industry, Dunbar Cement is a significant potential contributor of captured carbon, representing 35% of the capture potential. However, the site’s NETs potential is low due to the use of solid recovered fuel (SRF). Consequently, the negative emissions potential of BECCS industry is only 0.85 MtCO2/year, from a total capture potential (biogenic and fossil CO2) of 1.26 MtCO2/year. When only biogenic emissions are considered, Norbord Morayhill (wood panel producer) and Caledonian Paper Mill account for the majority of the BECCS Industry NETs potential (67% when combined).
3.3.1.2 BECCS EfW
Among EfW sites, the NETs potential is distributed evenly between sites, with Dunbar EfW being the most significant because of its a large gross power capacity of 25.6 MWe. This is clearly illustrated by the breakdown in capture potential for key EfW sites shown in Table 10 below.
| Site | NET | Carbon capture potential (MtCO2/year) | Percentage of capture potential (sector specific) | Percentage of capture potential (total) |
|---|---|---|---|---|
| Dunbar EfW (previously Oxwellmains EfW) | BECCS EfW | 0.28 | 29% | 6% |
| Charlesfield Biomass CHP Plant | BECCS EfW ACT (CHP) | 0.16 | 17% | 4% |
| Glasgow Renewable Energy and Recycling Centre (ACT) | BECCS EfW ACT (CHP) | 0.16 | 17% | 4% |
| Millerhill EfW | BECCS EfW | 0.14 | 14% | 3% |
| Levenseat EfW | BECCS EfW ACT | 0.12 | 12% | 3% |
Note that the NETs potential of EfW sites is reduced by over half when biogenic emissions are accounted for, due to the utilisation of both MSW and SRF waste, which have varying biogenic contents of 50% to 17% on a wet weight (w/w) basis.
3.3.1.3 BECCS Fermentation
The four largest grain distilleries (Strathclyde, Cameronbridge, Girvan, and Invergordon) account for 40% of NETs potential from breweries/distilleries out of 141 sites in total (see the breakdown in capture potential for the largest alcohol producing sites in Table 11 below). These large distilleries are spatially far from one another, but there are some clusters of smaller distilleries – most notably in Speyside.
| Site | NET | Carbon capture potential (MtCO2/year) | Percentage of capture potential (sector specific) | Percentage of capture potential (total) |
|---|---|---|---|---|
| Girvan | Grain whisky | 0.07 | 15% | 2% |
| Cameronbridge | Grain whisky | 0.07 | 15% | 2% |
| Strathclyde | Grain whisky | 0.03 | 5% | 1% |
| Invergordon | Grain whisky | 0.02 | 5% | 1% |
| Starlaw/Glen Turner Distillery | Grain whisky | 0.02 | 4% | ~0% |
3.3.1.4 BECCS Biomethane
For BECCS Biomethane, the NETs potential is low and makes up only 4% of the total NETs potential. This is due to the small-scale and localised nature of these upgrading sites, as shown in Table 12 below.
| Site | NET | Carbon capture potential (MtCO2/year) | Percentage of capture potential (sector specific) | Percentage of capture potential (total) |
|---|---|---|---|---|
| Girvan Distillery | BECCS Biomethane (grid injection & CHP) | 0.02 | 20% | 1% |
| Glenfiddich Distillery | BECCS Biomethane (grid injection) | 0.02 | 15% | ~0% |
| Portgordon Maltings Beyside | BECCS Biomethane (grid injection & CHP) | 0.01 | 6% | ~0% |
| Lockerbie Creamery | BECCS Biomethane (grid injectioN) | 0.01 | 6% | ~0% |
| Keithick Farm | BECCS Biomethane (grid injection & CHP) | 0.01 | 4% | ~0% |
3.3.2 Future potential sites planned
Figure 4 provides an overview of the carbon capture and NETs potentials for future sites. The maximum projected NETs potential from future sites is an additional 2 MtCO2/year giving a total NET potential (for both existing and future sites) of 5.3 MtCO2/year). Again, falls below the target set by the CCPu (5.7 MtCO2/year)[14].
The main components of the future planned sites are outlined below.
3.3.2.1 BECCS EfW
EfW emerged as the predominant technology of future sites, due in part to the quantity of EfW sites that are currently in some stage of planning. The potential was distributed reasonably evenly across multiple sites, with Thainstone Energy Park Project ERF, Coatbridge Material Recovery and Renewable Energy Facility, Earlsgate Energy Centre, and Drumgray Energy Recovery Centre (DERC) as the major potential contributors (see Table 13 below). These sites are fuelled by MSW rather than RDF, which has a higher biogenic content, representing the highest negative emission potential, accounting for approximately 55% of the total negative emissions from BECCS EfW.
| Site | NET | Carbon capture potential (MtCO2/year) | Percentage of capture potential (sector specific) | Percentage of capture potential (total) |
|---|---|---|---|---|
| Drumgray Energy Recovery Centre (DERC) | BECCS EfW (CHP) | 0.41 | 13% | 11% |
| Coatbridge Material Recovery and Renewable Energy Facility | BECCS EfW ACT (CHP) | 0.40 | 13% | 11% |
| Thainstone Energy Park Project ERF | BECCS EfW | 0.38 | 12% | 10% |
| CalaChem Fine Chemicals (Grangemouth) - Earlsgate Energy Centre | BECCS EfW (CHP) | 0.35 | 11% | 9% |
| Westfield (former Opencast Coal Mine) | BECCS EfW | 0.26 | 8% | 7% |
3.3.2.2 Direct Air Carbon Capture and Storage (DACCS)
The future NETs potential from DACCS was accounted for by the single Storegga Carbon Engineering project, which is proposed to be built in the late 2020s with assumed minimum capture rate of 0.5 MtCO2/year. The development of future DACCS projects is location-dependent and, as discussions with stakeholders indicated, relies significantly on the available incentives and financial support as well as the development of international carbon markets. Additional future capacity in Scotland was estimated based on what is considered feasible as highlighted by stakeholder discussions and global DACCS targets.
3.3.2.3 BECCS Power
The carbon capture and NETs potential for BECCS Power was very low, with only 4 sites expecting to be installed from the planning databases reviewed (total combined gross capacity of 6.41 MWe). See Table 14 below for a breakdown. These sites are expected to be commissioned between 2030-2035, given the fact that planning permission has been granted but no construction work has begun. The largest of which was the ‘Achnabreck’ site, which plans to gasify wood pellets, and has an estimated NETs potential of 0.088 MtCO2/year.
| Site | NET | Carbon capture potential (MtCO2/year) | Percentage of capture potential (sector specific) | Percentage of capture potential (total) |
|---|---|---|---|---|
| Achnabreck | BECCS Power ACT (CHP) | 0.09 | 94% | 2% |
| Co-Op, Polwarth Street - Biomass boilers | BECCS Power | 0.00 | 3.0% | ~0% |
| Hillhead Of Coldwells, Longhaven - Biomass Boilers | BECCS Power | 0.00 | 2% | ~0% |
| Little Broomfield - Biomass boiler | BECCS Power | 0.00 | 1% | ~0% |
3.4 Summary
The analysis described above (and as detailed in Appendix 2 of the technical appendices document) highlighted where the majority of the NETs potential in Scotland is expected to come from. The suite of existing, operational sites gives a mixture of potential NETs projects – predominantly focussed in BECCS Power & BECCS Industry. Sites that are not yet constructed offer a different range of NETs potential – focussed predominantly in BECCS EfW and a moderate contribution from the planned Storegga DACCS installation at St Fergus.
The analysis shows that the total CO2 available from existing biogenic sources in Scotland is around 3.3 Mt CO2/year. Not all of this CO2 can be a contributor to NETs targets and so the next section of the report will evaluate the economic feasibility of sites to evaluate this potential. Also, permanent storage of the CO2 captured is essential in order to ensure that a site contributes to NETs targets. This is discussed in more detail in Section 5.
Contact
Email: NETs@gov.scot