Negative Emissions Technologies (NETS): Feasibility Study
This study estimates the maximum Negative Emissions Technologies (NETs) potential achievable in Scotland, 2030 - 2050.
5. Pathway modelling
5.1 Pathways definition
Three pathways were evaluated in this study. For each of the pathways, the NETs potential and the associated CAPEX and OPEX were evaluated.
The pathways evaluated are:
- Pathway 1 – No Action
- This pathway assumes minimal action and policies are promoted by the Scottish and UK Governments to influence the development of NETs in Scotland, other than those that have already been confirmed or assumed.
- There is no negative emission credit trading mechanism in this pathway.
- This pathway assumes minimal action and policies are promoted by the Scottish and UK Governments to influence the development of NETs in Scotland, other than those that have already been confirmed or assumed.
- Pathway 2 – Scottish Government Action
- This pathway includes what has been considered to be the low hanging fruits (easiest to deploy) for NETs in Scotland. It represents a pathway that is made up of sites that could adopt NETs for a relatively low investment cost and at the lowest levelised cost of carbon. The pathway is bounded by specific policies as discussed in later sections.
- There is no negative emission credit trading mechanism in this pathway.
- This pathway includes what has been considered to be the low hanging fruits (easiest to deploy) for NETs in Scotland. It represents a pathway that is made up of sites that could adopt NETs for a relatively low investment cost and at the lowest levelised cost of carbon. The pathway is bounded by specific policies as discussed in later sections.
- Pathway 3 – UK and Scottish Government Action
- This pathway assumes high CCUS and NET deployment is possible with a suite of policies and mechanisms included to promote NETs in Scotland
- A negative emission credit trading mechanism is included in this pathway.
- This pathway assumes high CCUS and NET deployment is possible with a suite of policies and mechanisms included to promote NETs in Scotland
Common assumptions amongst all pathways are outlined in section 2.1. Pathway-specific assumptions are discussed in section 5.2.
An impact assessment looking at various policy and funding mechanisms is contained in section 5.3, page 61 .
5.2 Pathway-specific assumptions
5.2.1 No Action pathway
Under this pathway it is assumed that there will be no additional support for NETs from the Scottish Government and UK Government, beyond what had already been confirmed publicly at the outset of this study. Therefore, the sites that are included in this pathway have either:
- Already received funding or are committed to adopting NETs.
- Project dreamcatcher (DACCS) associated with the Acorn project.
- Some biomethane and fermentation sites associated with project NEXUS.
- Those that may be forced into adopting NETs through regulatory reasons.
- In particular this relates to potential EfW sites that are planned and would be expected to have to follow The National Planning Framework 4.[66]
5.2.2 Scottish Government (SG) Action pathway
Under this pathway, CCS will be installed onto existing ‘low-hanging fruit’ (LHF) sites to achieve quick, easy, and affordable negative emission gains. Any sites included in the ‘No Action’ pathway are also included in this pathway. Whilst no revenue from negative emissions trading was included in this pathway, the sites in this pathway all had low LCOC (i.e., a LCOC of £30-60/tCO2, as per the calculation in section 4.1). A relative profitability test was undertaken to check viability, which is outlined below.
- Sites were added into this pathway by means of applying various CAPEX funding mechanisms up to a value of £40M (note the value of this funding, and where it could be applied was tested in a sensitivity analysis).
5.2.2.1 Existing Sites
5.2.2.1.1 Relative Profitability Test for SG Action pathway
The relative profitability of a site that may implement a NET facility was tested in this pathway - it was assumed that there was no direct revenue from the CO2 captured and instead assessed what uplift to the “products” would need to increase by to remain profitable. This is a somewhat crude estimation, used to test the theory that certain industries are best placed to offer potential routes to increasing the NETs capacity in Scotland at lower overall costs. Note that some substantial assumptions were needed to be added in order for this test to be applied to our list of existing sites:
- The values of power and heat (for CHP sites) had to be consistent across all sites – in reality in a competitive market for electricity, the price of electricity sold to the market fluctuates and on the other side of the spectrum – sites also enter long-term contracts for selling power, which will mean that the profitability of their power sold will vary against the market price.
- The value of biomethane across all sites had to be kept consistent – similarly to the market for electricity, the profitability of biomethane is determined by the market price and contracts that each site has entered into – thus we kept this consistent across the different sites in the pathways.
- The value of whisky produced had to be kept consistent. Clearly the price paid for a bottle or cask of whisky will vary depending on manufacturer and maturation period (i.e., how long the whisky stays in cask prior to bottling). The price/value of whisky has by far the greatest variance between single malt/single grain/blended malts and blended grain sites and between manufacturers that provide these whiskies. As whisky is a high value product manufactured throughout Scotland at vast volumes, the impact of implementing NETs on the profitability of whisky was found to have the lowest impact.
- This test could not be applied to industrial sites as these all have a variety of products that will vary in both type and value, and it was not possible to create a communal product that would be applied to a BECCS Industry site. We assumed that BECCS Industry would operate similarly to BECCS Power and as such these sites would not then pass the revenue test.
The calculation was undertaken in the following manner:
- The annual LCOC costs were established (LCOC (£/tCO2 multiplied by NET potential (MtCO2/year)
- The volume of products being sold (power/heat/biomethane/whisky/beer) were calculated
- This was calculated for pre- and post-CCS
- Note in some cases the CCS does not affect the outputs (fermentation processes & biomethane sites)
- This was calculated for pre- and post-CCS
- The revenue from products being sold was then calculated
- This was then calculated for pre- and post-CCS
- The % increase in price was then calculated to maintain the same level of revenue
- A low % increase indicates that introducing CCS at the site could be implemented without having to increase the price of products substantially.
5.2.2.1.2 Pathway inclusion
For an existing site to be included in this pathway the following criteria was set that had to be met. Note that these criteria were able to be adjusted in the pathway analysis, based on the evidence reviewed and some sensitivities that were tested are included in section 5.6.
- Minimum negative capture potential had to be > 2,500 tCO2
- The transportation costs associated with the overall OPEX had to be <50% of the total OPEX
- This was again an arbitrary value that was used as a filter in this pathway – the impact of transportation costs on the OPEX then has a larger impact on more rural sites – often these rural sites have relatively low capture potential
- 20% was included as an arbitrary value and agreed with the initial iterations of the pathway.
- For BECCS Fermentation the increase on unit cost increased by 0.5 – 2%
- 20% was included as an arbitrary value and agreed with the initial iterations of the pathway.
- This was again an arbitrary value that was used as a filter in this pathway – the impact of transportation costs on the OPEX then has a larger impact on more rural sites – often these rural sites have relatively low capture potential
- It is assumed that profitability is only impacted by additional costs and that that there are no additional revenues as a result of the investment in CCS.
- Profitability test had to have an impact that was < 20%
- i.e., if the introduction of NETs to a site resulted in the “product” value needing to increase by more than 20% then it was not included.
- 20% was included as an arbitrary value and agreed with the initial iterations of the pathway.
- For BECCS Fermentation the increase on unit cost increased by 0.5 – 2%
- For BECCS Biomethane the increase on unit cost increased by 9 -14%
- For BECCS Power/EfW and by proxy, BECCS Industry – the price increases substantially to > 100% -- showing that NETs technologies in these industries cannot be expected to be implemented without additional external support or regulatory measures as would be expected.
- A maximum CAPEX value of £40M in government support was used to bound this pathway – this was again an arbitrary value and sensitivities on this value have been undertaken. This CAPEX funding was not sector specific but would apply to all technologies. When included with the sites with the lowest LCOC it resulted in BECCS fermentation and BECCS biomethane sites being included
- 20% was included as an arbitrary value and agreed with the initial iterations of the pathway.
- This was not an unexpected result, due to the high concentration of CO2 that is produced and the relatively low volumes meaning the overall CAPEX per site is low.
- i.e., if the introduction of NETs to a site resulted in the “product” value needing to increase by more than 20% then it was not included.
5.2.3 UK Government (UKG) & Scottish Government (SG) Action pathway
For a site to be included in this pathway the criteria requirements were reduced to produce a larger sub-set of potential sites that could contribute to the overall capacity of NET sites in Scotland. Various policy mechanisms were tested and, where possible, the impact of their inclusion was quantified, see Table 21, page 73. Note that these criteria can be flexed in the pathway analysis and some sensitivities that were tested are included in section 5.6.
- Minimum negative capture potential was dropped from 2,500 tCO2 / year to 1,000 tCO2 / year
- The transportation costs as a fraction of OPEX were removed – this ultimately led to an increase in rural BECCS biomethane and BECCS fermentation sites – but the impact this has on the overall NETs potential was relatively low.
- The Profitability test was included for this pathway due to the inclusion of NETs trading scheme revenues. However, it should be noted that under such a trading scheme, if the carbon price increases to a certain point, then sites with CCS can be more profitable than those without despite their higher costs.
- No upper boundary on CAPEX was placed. However, sensitivities around how much potential CO2 may be possible to capture and permanently store against sectors-specific funding was tested and is shown in the results section.
- A negative emission tariff was introduced in this pathway, see section 5.2.3.1 for more details.
- It is assumed that this is built upon the UK ETS trading scheme and importantly applies to all potential NETs (UK ETS is only currently applicable to power generation and the aviation industry).
5.2.3.1 Negative Emission Trading Scheme
In pathway 3, a demand-based mechanism was introduced. See section 1.3 of the technical appendices document for a variety of potential demand-based mechanisms that are potentially being developed for the UK and some that are currently being developed throughout the world.
Our LCOC values are graphed against the assumed £/tCO2 negative emission prices, starting at £80/tCO2 in 2025. Where the LCOC is lower than the £/tCO2 this indicates that the NET facility could be implemented and make a net-profit. This analysis was also used to determine the year of implementation.
Our base year £/tCO2 was £80/tCO2 in 2025. This is inflated by 3.5% through to 2045, giving a range of £/tCO2 over the course of the analysis.
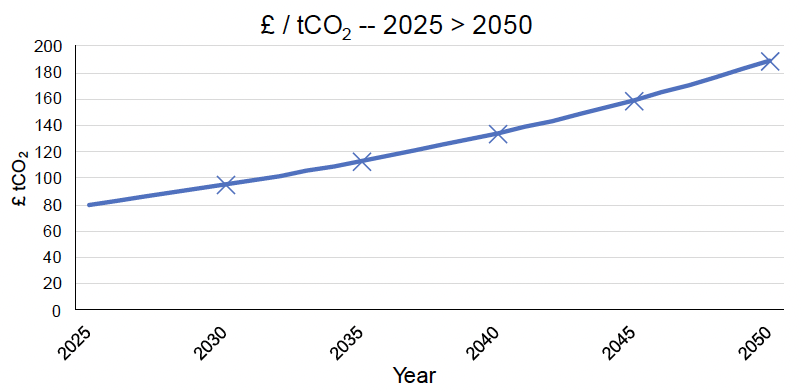
£/tCO2 prices:
- 2025 - £80
- 2030 - £95
- 2035 - £113
- 2040 - £134
- 2045 - £160
So, for example, if a site had an LCOC of £100 then it would have an implementation year of 2031-2032. Note that the LCOCs for each site are based on 2023 CAPEX rates and we have included learning rates for CAPEX which are calculated for each existing site based on a 2023 cost metric. The analysis does not vary the LCOC (which would reduce as CAPEX reduces over time – see below).
5.2.4 Future sites – all pathways
Future potential NETs sites (i.e., not those currently in planning) are complicated to estimate. Firstly, we evaluated the growth rates estimated across the specific industries, then we addressed the specific assumptions within each pathway as per the previous sections, lastly, we applied market penetration rates to get the best estimate of what could be a future NETs site. For example, simply using the biomethane growth rates required to meet the assumed biomethane percentage of gas on the grid would over-estimate the biomethane component as a) not all would necessarily come equipped with CCS equipment and b) not all captured carbon would end up being permanently stored.
Additionally, we cannot apply the locational element of the analysis to future sites as we do not know where these sites might be placed. However, we can apply the same locational element to suggest that island-based future sites would not be included in our list of future sites.
Island sites are unlikely to have the required infrastructure to transport captured CO2 at a cost-effective manner. This does not mean that an island site could not implement a CCS project, but the captured CO2 is more likely to be a) of lower volume and b) higher cost to transport over longer distances meaning that alternative uses for the captured CO2 are a more realistic assumption. The isle of Islay has 9 whisky distilleries, with an additional distillery on the adjacent isle of Jura. There could be a potential future NETs project that incorporates all of these distilleries - this would require agreement for communal transportation of captured CO2 between the distilleries in order to make this a potential future viable solution.
Ultimately, evaluating the potential future NETs sites was a difficult aspect of the analysis (compared to the existing site list where we know, or can evaluate all the parameters that make up our LCOC analysis). This component of the site-based analysis has the highest level of uncertainty.
Some of the high-level growth rates used in the modelling are outlined below:
- BECCS Biomethane
- CCC projections for biomethane sites in the UK were used and proportionately translated to a Scottish context. This represents growth of around 3.7 times based on 2020 > 2040 capacity in Scotland; Note that the majority of all biomethane production facilities in Scotland were driven by the RHI, with the current support scheme, the GGSS not resulting in any significant biomethane facilities being constructed. Therefore, a more conservative growth rate of 2 was used.
- This equates to an estimated maximum of up to 0.24 MtCO2 to 2045
- CCC projections for biomethane sites in the UK were used and proportionately translated to a Scottish context. This represents growth of around 3.7 times based on 2020 > 2040 capacity in Scotland; Note that the majority of all biomethane production facilities in Scotland were driven by the RHI, with the current support scheme, the GGSS not resulting in any significant biomethane facilities being constructed. Therefore, a more conservative growth rate of 2 was used.
- BECCS Fermentation
- We did not assume any new whisky or beer brewing sites in the pathways but do note that clearly any new facilities in this industry would likely need to be built to be at least low carbon if not carbon-neutral or carbon-negative.
- BECCS EfW
- Future list of EfW sites evaluated based on revised list presented in "Incineration and energy from waste” report by SPICe for the Scottish Government in 2022[67] – revised based on known modifications to this site list (some sites refused planning and others having had funding withdrawn).
- A total of 10 new EfW sites are included in the analysis.
- These equate to an estimated maximum of up to 1.88 MtCO2 by 2045
- A total of 10 new EfW sites are included in the analysis.
- Future list of EfW sites evaluated based on revised list presented in "Incineration and energy from waste” report by SPICe for the Scottish Government in 2022[67] – revised based on known modifications to this site list (some sites refused planning and others having had funding withdrawn).
BECCS Power, BECCS Industry, BECCS Hydrogen and biochar will all compete for the same available bioresources in the future, this is bounded by the analysis undertaken in the CXC report that estimates the future bioresources that are available and unused (see Table 6, page 26).
- BECCS Power
- Linked to the demand for future power requirements in Scotland.
- These equate to an estimated maximum of up to 1.62 MtCO2 in 2045 (based on 5 plants of 50 MWe).
- Linked to the demand for future power requirements in Scotland.
- BECCS Industry
- As “industry” is a wide term, future BECCS Industry sites are assumed to be linked to wood and wood production facilities, which are linked to the growth in the wood and timber in construction industries in particular. Future non-biogenic CO2 industrial sites that could in theory adopt a biogenic fuel source are not included.
- Note that “fuel-switching” to a biogenic fuel source requires a vast amount of capital and technological expertise to implement. Whilst there has been a historic shift from non-biogenic to biogenic fuels used in industry for heat and power applications over the past 10-15 years – this has typically been linked to subsidy schemes. Changing a gas boiler/gas CHP to one that is fuelled on a biogenic fuel is typically a very large project for the scale of sites that are considered in this report. In particular any site that uses natural gas in a gas turbine (which is compressed prior to combustion) cannot be replaced with a biomass fuelled alternative. On the contrary, gas CHP systems that use steam turbines to generate electricity could use biomass as a fuel source (biomass combustion to produce the steam which is then used in the turbine).
- This equates to a maximum of up to 0.32 MtCO2 in 2045
- Note that “fuel-switching” to a biogenic fuel source requires a vast amount of capital and technological expertise to implement. Whilst there has been a historic shift from non-biogenic to biogenic fuels used in industry for heat and power applications over the past 10-15 years – this has typically been linked to subsidy schemes. Changing a gas boiler/gas CHP to one that is fuelled on a biogenic fuel is typically a very large project for the scale of sites that are considered in this report. In particular any site that uses natural gas in a gas turbine (which is compressed prior to combustion) cannot be replaced with a biomass fuelled alternative. On the contrary, gas CHP systems that use steam turbines to generate electricity could use biomass as a fuel source (biomass combustion to produce the steam which is then used in the turbine).
- As “industry” is a wide term, future BECCS Industry sites are assumed to be linked to wood and wood production facilities, which are linked to the growth in the wood and timber in construction industries in particular. Future non-biogenic CO2 industrial sites that could in theory adopt a biogenic fuel source are not included.
- Biochar
- Several pilot biochar projects currently being developed in Scotland, growth rates derived from this and from internal and external stakeholder discussions.
- Total estimated NETs capacity of 0.018MtCO2/year used (2030) up to a maximum of 0.32 MtCO2/year in 2045.
- In order for biochar to expand as a carbon removal option, additional work needs to be done on MRV and certification procedures and recognising applications for biochar where the CO2 remains permanently trapped (e.g., soil re-construction, use in concrete blocks, etc.).
- Several pilot biochar projects currently being developed in Scotland, growth rates derived from this and from internal and external stakeholder discussions.
- BECCS Hydrogen
- Linked to the Hydrogen action plan[68] and estimated demand for BECCS Hydrogen. Note that bio-hydrogen is not touted frequently in the hydrogen action plan, with most future green hydrogen expected to come from electrolysis.
- This equates to a maximum of up to 0.04 MtCO2 in 2040.
- Linked to the Hydrogen action plan[68] and estimated demand for BECCS Hydrogen. Note that bio-hydrogen is not touted frequently in the hydrogen action plan, with most future green hydrogen expected to come from electrolysis.
5.2.5 Site inclusion in each pathway
Table 17 shows the different NETs that have been included in each pathway, split by existing sites, future sites and fuel switch sites[69].
| NET sectors | Pathway 1 - No action | Pathway 2 – SG Action | Pathway 3 – UKG Action | |
|---|---|---|---|---|
| Existing sites | BECCS Power | Not included | Not included | Included |
| BECCS Industry | Not included | Not included | Included | |
| BECCS EfW | Not included | Not included | Included | |
| BECCS Biomethane | Included | Included | Included | |
| BECCS Fermentation | Included | Included | Included | |
| Biochar | No existing sites | No existing sites | No existing sites | |
| BECCS Hydrogen | No existing sites | No existing sites | No existing sites | |
| DACCS | No existing sites | No existing sites | No existing sites | |
| New Sites | BECCS Power | Not included | Not included | Included |
| BECCS Industry | Not included | Not included | Included | |
| BECCS EfW | Included | Included | Included | |
| BECCS Biomethane | Not included | Included | Included | |
| BECCS Fermentation | Not included | Not included | Included | |
| Biochar | Included | Included | Included | |
| BECCS Hydrogen | Not included | Not included | Included | |
| DACCS | Included | Included | Included | |
| Fuel Switch | BECCS Power | Not included | Not included | Not included |
| BECCS Industry | Not included | Not included | Included | |
| BECCS EfW | Not included | Not included | Not included | |
| BECCS Biomethane | Not applicable | Not applicable | Not applicable | |
| BECCS Fermentation | Not applicable | Not applicable | Not applicable | |
| Biochar | Not applicable | Not applicable | Not applicable | |
| BECCS Hydrogen | Not applicable | Not applicable | Not applicable | |
| DACCS | Not applicable | Not applicable | Not applicable |
5.3 Policy & funding impact assessment
The analysis also involved an assessment of the impact of different policies on NETs potential and feasibility in Scotland. It should be noted that the impact of many of these policies was difficult to quantify due to lack of information on how NETs will be influenced by introducing them and so the results are discussed qualitatively where this has been the case. Where quantification was possible, a sensitivity analysis was also undertaken on some of the parameters to test policy impacts.
There are a number of policies that have been considered in each of the pathways that can influence the future of NETs in Scotland. The impact can either be:
(i) by increasing the volume of CO2 captured and permanently stored, or
(ii) by shifting the trajectory of when the option can be deployed (i.e., earlier timeline of deployment)
The policies and mechanisms have been split into those that:
(i) the Scottish Government have control over, and
(ii) those that are in the control of the UK Government.
These have been split into 3 broad categories, and a supplementary spreadsheet that outlines the inter-linking nature of the policies, their impact, and our assessment on quantifying the impact has been included, signpost here the categories are:
- General policies:
- Non-NETs specific policies that could impact the future of NETs.
- Fiscal policies:
- Policies that either offer direct or indirect financial support to NETs, these can be broad or sector specific.
- Technical policies:
- Policies that offer technical support to other related areas that could impact the development of NETs in Scotland
The range of policies and levers that have been assessed varies amongst the three pathways.
- For the ‘No Action’ pathway, it was assumed that there are no fiscal policies in support of NETs.
- For the ‘SG Action’ pathway, it was assumed that some fiscal policies were available, devised to incentivise the sites with the lowest LCOC to implement NETs, and,
- For the “UKG Action” pathway, it was assumed that there is a wider range of fiscal support (including the adoption of the negative emission revenue).
We undertook a RAG review of the suitable policy areas to outline whether or not this policy would positively impact NETs (Green), negatively impact (Red) or where the policy area was not well enough defined, or the impact that this could have on NETs could not be verified or confirmed.
5.3.1 General policies
There are a range of broader policies beyond those specifically addressing the deployment of, that if developed to support NETs, could impact the volume and trajectory of NETs in Scotland. In particular, the following policy areas were reviewed:
5.3.1.1 Policies ensuring Acorn deployment
All pathways have been developed based on an assumption that the Acorn storage facility is developed and is active by 2030. Thus, in all pathways there are no stored biogenic CO2 volumes until 2030. Realistically, sites (biomethane and distillery sites) in Scotland can start capturing CO2 before 2030 and either exporting it for permanent storage globally (e.g., The Northern Lights project) or for utilisation in industry (e.g., concrete curing or carbonation) where it remains permanently stored (this is possible as the NETs volumes involved at this early stage of deployment are low). This also requires that such emerging applications are recognised as permanent storage applications.
5.3.1.2 Biomass Strategy (both for Scotland and wider of the UK)
The UK Bioenergy Strategy was published in August 2023. The position of the UK government regarding imported biomass and support for specific biomass technologies will impact NETs deployment in Scotland. This will also be impacted by the position of the Scottish Government regarding the use of imported biomass. The detailed procedures regarding monitoring, reporting and verification of the source and sustainability of biomass will also have an impact on NET development. For this study, it was assumed that there are no biomass imports for NETs in all pathways. Drax power station current combusts around 7 million tonnes of pellets per year that are imported[70], this is roughly equivalent to 33.6 TWh (assuming 1 tonne of pellets is equivalent to ~4,800 kWh) – this far outweighs all bioenergy resources in Scotland. Whilst implementing a BECCS plant at the scale of Drax in Scotland is highly unlikely, allowing biomass imports could have a large impact on future BECCS developments in Scotland as the upper limit on availability for biomass for bioenergy would be removed.
5.3.1.3 Bioenergy Action Plan
Previous research has indicated that Scotland’s ability to increase biomass production from current levels is largely dependent on energy crops, miscanthus, and short rotation forestry. A greater emphasis on converting land to produce these resources would encourage greater feedstock production and allow deployment of BECCS technologies at a greater scale.
5.3.1.4 Statement of NETs targets
Any statement of future NETs targets is not itself a direct driver for NETs, but ultimately should have been formalised based on reports similar to this and other policy areas. The setting of NETs targets would send a signal to industries – but would need to be supported with some fiscal support mechanism to drive progress towards the target. Setting a target that is both ambitious and feasible will be challenging to achieve.
5.3.1.5 Economic licensing improvements
This could see projects/systems be more financially attractive, reducing overall LCOC with a reduction in transportation and storage licensing costs; this is currently being legislated by the UK Government.[71] This could in-theory increase the overall volume of CO2 that is diverted to permanent storage. A licence will determine the allowed revenue which a transport and/or storage operator may receive, which may in turn result in reduced operating costs that would not be passed on to producers of emissions.
5.3.1.6 Planning and consenting policies
A key barrier to deployment of CCS projects in general and NETs is the planning (from the local authority or council) and permitting (from SEPA) requirements. This is because experience with permitting CO2 capture projects is recent and so permitting takes a long time. One of the requirements of the permitting process is to prepare a detailed environmental impact assessment which needs to include air quality impact assessment. The understanding of air and water emissions associated with large scale CO2 capture systems is solvent-dependent (e.g., amines or potassium carbonate used for capturing the carbon dioxide) and is still developing. Also, most of the available guidance is on amine systems. Better understanding and improved guidance for different solvents will help speed the permitting process in the future.
An important consideration for the permitting of future UK NET sites is that they will be required to be carbon capture-ready. This means that they will need to do a feasibility study on carbon capture and to leave sufficient space to install CO2 capture when it becomes feasible to do so in the future. The Decarbonisation Readiness consultation in 2022 (for the whole of the UK) proposes to include biomass and EfW under this requirement and to remove the 300 MW threshold stated in the 2009 regulation. In order to speed up future permitting process, guidance on carbon capture-readiness needs to be clear. For example, this needs to include guidance on space requirements, and as biomass will be covered by the new rules, it also needs to include guidance on assessing the sustainability of the biomass, due to increase in demand as a result of adding carbon capture in the future. If the Scottish Government was to implement similar requirements this would support the wider NETs agenda.
The planning process could also be time consuming depending on the location of the site. The National Planning Framework 4 (NPF4) is the national spatial strategy for Scotland, setting out national planning policy, regional priorities, and spatial principles. Guidance on CCS and NETs could be included as part of the NPF4 to help simplify the process.
If the planning and permitting processes are improved, then this could lead to an advancement of getting NETs projects online and could result in a lower LCOC if administrative charges are reduced. It should be noted that this study did not include administrative charges in our LCOC analysis but appreciate that for larger sites/systems then this could represent a substantive capital outlay.
5.3.1.7 Supply chain and skills gaps
One key barrier to NET and CCS in general is related to the supply chain. Scotland has well-established expertise in engineering design, construction and commissioning. Manufacturing of carbon capture equipment mostly comes from outside Scotland (e.g., amine and potassium carbonate systems for CO2 capture). Detailed analysis is needed to identify gaps in the supply chain and in skill requirements which will be needed when wide scale deployment of NETs will happen (for example the need for process engineers with specific expertise). Policies needs to be established to help address gaps in the supply chain and training of new skills to prepare for this.
5.3.1.8 Public awareness campaigns
No direct impact on timescale or volume of NETs but could in theory incentivise other developers to implement in Scotland (if the campaign is positive and successful). A successful campaign would ensure the merit of BECCS, biochar and DACCS are outlined in relation to Scotland’s communities, existing net-zero commitments, specific industry net-zero targets and should incorporate life-cycle analysis. This could also incorporate analysis on the bioresources that are involved in the various NETs – linking to the demand on bioenergy and impact on domestic forestry activities and imports (or lack thereof). Quantifying the impact that this may have on the demand for NETs in Scotland is difficult to do, however a positive campaign focussing on the need for NETs in-line with the current climate crisis could minimise objections to future site development.
5.3.1.9 Road improvement strategies
Road improvements could reduce the transportation cost component of overall OPEX, reducing the overall LCOC for the site. Several of the potential NETs sites are rural, meaning that transportation costs often represent the highest proportion of the total OPEX. Road improvement works such as dualling the A9 and the A96 would result in faster, more cost-effective road transport to either Peterhead or the grid injection points at Garlogie or Kirriemuir for some parts of the proposed routes. Ensuring roads remain open throughout winter via improvement management and gritting will ultimately help to keep all vehicles on the Scottish road infrastructure for longer periods. Large vehicle movement on smaller A or B roads can impact both the condition of the road surface significantly and in some cases the road width may be a limiting factor on the size of vehicle that is capable of using the road.
5.3.2 Financial policies
5.3.2.1 Sector-specific CAPEX funding
The impact that sector specific CAPEX funding could have on existing sites in Scotland is shown in Table 18 below. Note we have not assumed any sector-specific CAPEX funding is available in the ‘No Action Pathway’ and the SG Action pathway’. The figures presented in Table 18 are based on selected sites contained within the analysis.
| Sector-specific funding for existing sites | MtCO2/year | CAPEX needed to achieve estimated CO2 capture | ||
|---|---|---|---|---|
| Low value | High value | Low value | High value | |
| BECCS Power | 0.20 | 0.80 | £93M | £300M |
| BECCS Industry | 0.10 | 0.55 | £45M | £131M |
| BECCS EfW | 0.20 | 0.40 | £160M | £333M |
| BECCS Biomethane | 0.05 | 0.10 | £4M | £15M |
| BECCS Fermentation | 0.02 | 0.04 | £16M | £56M |
| Total | 0.57 | 1.89 | £318M | £835M |
Table 18 shows that both the BECCS Biomethane and BECCS Fermentation sites, whilst representing the lowest CO2 capture potential, are also the cheapest to implement. This pertains to these sites having the lowest LCOC (though is clearly not the only factor of the LCOC calculation). Both BECCS Power and in particular BECCS EfW require significant capital to achieve moderate to high CO2 capture potential. If sector specific funding was provided by either the Scottish or UK Governments, then substantively different amounts of capital could be diverted to different sectors or technologies, resulting in a wide range of potential captured CO2.
5.3.2.2 Other broad funding schemes (for all NETs technologies)
There are a variety of funding schemes that could be developed by both the Scottish and UK Governments. In pathways 2 & 3 we have used a funding pot of £40M being made available to support NETs in Scotland which is not specifically linked to a NETs sector. Note however, that significant funding is required in Power, Industry or EFW which would likely only advance a handful of potential sites. No external funding from the Scottish Government or the UK Government has been allocated in the No Action pathway.
5.3.2.3 Business model support
Business model support could push implementation of a NETs project forward, allowing for more certainty in project viability throughout the development stage. Business model support that advances NETs capacity prior to 2030 when the Acorn project is active could result in an increase in emissions being utilised rather than stored unless alternative storage facilities are present (East Coast Cluster or HyNET).
Our analysis showed that transporting to other UK clusters increased the transportation element of the LCOC calculation considerably, making this generally an unfeasible option for the majority of Scottish sites.
5.3.2.4 ETS Expansion (including NETs trading scheme revenues for UK Government Action pathway)
As outlined in 5.2.3.1, the expansion of the UK ETS to include a NETs trading scheme revenue is included in the UKG & SG Action pathway as a demand-based intervention has a significant impact on the results of the NETs modelling (see results in section 5.4, page 66).
5.3.3 Technical policies
5.3.3.1 CCUS cluster deployment
This is not a pre-requisite for specific sites to develop NETs technologies – but rather a requirement for any CCUS project in Scotland and the UK to develop and have permanent storage. In Scotland, the industrial cluster operating between Grangemouth and the north-east is being developed and is central to all CCUS and future NETs projects in Scotland. If this was not developed, then the impact would be felt on the Acorn project and ultimately any CCUS/NETs project in Scotland.
5.3.3.2 CCUS/GGR targets
Non-NETs targets for CCUS or GGRs will not lead to a direct impact on NETs in Scotland but would be considered to be a catalyst and could indirectly increase the development of NETs in Scotland. The CCUS/GGR targets would themselves need to be aligned with other developmental aspects of wider CCUS in order to be achieved. One key element, which we have included in our assumptions, is the use of the Feeder 10 pipeline for transportation of captured CO2 to Acorn – this clearly would not be developed based on NETs alone.
5.3.4 Potential future policies and funding mechanisms that could be deployed to support NETs
A high-level summary of the potential future mechanisms that could be deployed to support NETs is shown below. More details are provided in section 1.3 of the technical appendices document.
- Expansion of the existing GGR removal programmes.
- To further develop field experiments, pilots, and demonstration and commercialisation projects.
- Expansion of the CfD programme.
- Expand to target BECCS specifically.
- Expansion of the UK ETS.
- Allow offsets from NETs to be traded.
- GGR Obligation Scheme.
- Alternative to expanding UK ETS.
- GGR tax credit/carbon levy.
- energy intensive industries receive a reduction in tax if they adopt GGRs and/or CCS.
- Monitoring, verification and reporting (MVR).
- Robust protocol that could be developed and implemented to ensure (amongst other things) that BECCS or biochar uses low carbon, locally sourced feedstocks.
- Other GGR subsidies.
- To potentially incentivise a range of developers to develop NETs projects with up-front grants and sector-specific funding.
5.3.5 Existing International policies
In recent years, there have also been several global advancements in incentives that have been developed to promote the accelerated deployment of NETs. NETs policy support to date has predominantly focused on direct grant support. There are BECCS reverse auctions planned in Sweden; a NETs tariff planned for Luxembourg; front-end engineering design studies for DACCS in the USA and Bipartisan Infrastructure Law (BIL) (also in the USA) aimed to commercialise carbon management, industrial decarbonisation technologies – with specific regional support for DACCS. More detail is contained within section 1.3 of the technical appendices document.
5.4 Policy quantification
Various policies and strategies were evaluated in a qualitative manner, where possible the impact was assessed qualitatively. The results and analysis from this process are provided below.
Key
- Red - Policy does not support the NETs pathway, modelled to not have a positive impact on the NET potential
- Amber - Policy area may impact the NETs pathway in a positive way – the impact will depend on the policy specifics
- Green - Policy has a positive impact on the pathway, increasing then NET potential
- X - Policy could have an impact
5.4.1 Pathway 1 – No Action Pathway
| Policy lead | Policy | Policy Area | R/A/G | Impact | Can it be quantified | Could the policy change the implementation period of a NETs project | Mt CO2 estimate - note these impacts are not cumulative | Year the policy impacts the pathway | |||
|---|---|---|---|---|---|---|---|---|---|---|---|
| 2030 | 2035 | 2040 | 2045 | ||||||||
| UKG | Scottish Cluster active by 2030 | General | Green | Link to Acorn/wider CCUS - so imperative to all scenarios - a requirement for CCUS & NETs | Yes | Yes - timelines of NETs deployment are tied to Acorn, so delaying/accelerating Acorn will delay/accelerate NETs deployment. | Linking to Acorn could result ~0.5 Mt CO2 NETs potential | X | X | X | X |
| UKG | ETS Expansion (with no negative emissions credits for engineered GGRs) | Fiscal | Amber | Without Negative emission credits, the expansion of UK ETS unlikely to have positive impact. | No | No | |||||
| UKG | UKG DAC competition proceeds as planned. No spill-overs to Scotland from UK projects. Scottish projects anchored to Acorn timings and do not proceed beyond Phase 2 | Fiscal | Red | Competition also supports biochar and BECCS but only supports R&D currently and real project implementation | No | Yes | |||||
| UKG | Biomass Strategy in 2023 (sets out criteria that applies to all biomass) | General | Amber | Entirely depends on what is contained in the strategy. Suggest that if this outlines an increase in biomass thinnings/brash for use then this may increase this utilisation. This will need to include a positive approach to SRF & miscanthus so that available bioresources in for future bioenergy projects can be realised | No | No | |||||
| UKG | CCUS Business models for transport & storage, industrial carbon capture, waste ICC and dispatchable power (link) support for Track-1 and Track-2 (as per current levels of funding set out in Budget 2023 of up to £20 billion “for early deployment”) | General & Fiscal | Amber | Interlinked with overall CCUS strategy -- T&S improvements / funding key to future sites being cost-effective and transition to NETs | No | Yes | |||||
| UKG | Business models for BECCS, Power BECCS and DACCS as per UKG policy documents (support is limited and late) | General & Fiscal | Green | Limit on support the limiting factor to how impactful this could be. Business models could result in storage permits being granted earlier than anticipated. | No | Yes | Well-developed business models could encourage additional projects to develop in addition to the Storegga Acorn project. This can be up to 0.1 Mt CO2/year of NETs capacity. | X | X | ||
| SG | No explicit NETs target | General | Red | Could disincentivise industry | No | No | |||||
| SG | Existing pots of unallocated funding used predominantly for CCUS associated with Track-2 projects rather than NETs projects | Fiscal | Red | Whilst still advances CCUS, the impact on NETs industry is limited | No | No | |||||
| SG | Baseline advances in capture rates to be compared to a high threshold in planning decisions under NPF 4 (link) for Industrial Green Transition Zones | Technological | Amber | Fully operational capture rates for all technologies already estimated at 90-95% (depending on the technology) - if planning requirements place too high an initial capture on sites, then this could disincentivise. | No | No | |||||
| SG | No pro-NETs social campaigning (so current attitudes towards NETs either persist or worsen in the face of anti-carbon capture campaigning). | General | Red | Disincentivise industry (lack of incentive, relative disincentive, same for below entries) | No | No | |||||
| SG | No financial grants towards research and development | Fiscal | Red | Disincentivise industry from developing NETs projects. | No | No | |||||
| SG | No expansion of offshore skills passport to onshore energy sector | General | Red | Disincentivise industry | No | No | |||||
| SG | Poor or no enforcement of monitoring, verification and reporting standards for biomass sources (especially from beyond the UK) | General | Red | Disincentivise industry | No | No | |||||
5.4.2 Pathway 2 – Scottish Government Action
| Policy lead | Policy | Policy Area | R/A/G | Impact | Can it be quantified | Could the policy change the implementation period of a NETs project | Mt CO2 estimate - note these impacts are not cumulative | Year the policy impacts the pathway | |||
|---|---|---|---|---|---|---|---|---|---|---|---|
| 2030 | 2035 | 2040 | 2045 | ||||||||
| UKG | Scottish Cluster active by 2030 | General | Green | Link to Acorn/wider CCUS - so imperative to all scenarios | Yes | Yes - timelines of NETs deployment are tied to Acorn, so delaying/accelerating Acorn will delay/accelerate NETs deployment. | Linking to Acorn will encourage additional NETs capacity under the LHF pathway in the form of biomethane / distillery and EfW BECCS capacity. Approx 1.3 Mt CO2/year | ||||
| UKG | ETS Expansion (with no negative emissions credits for engineered GGRs) | Fiscal | Amber | Without NETs credits, the expansion of UK ETS unlikely to have positive impact. | No | No | |||||
| UKG | UKG DAC competition proceeds as planned. No spill-overs to Scotland from UK projects. Scottish projects anchored to Acorn timings and do not proceed beyond Phase 2 | Fiscal | Red | Competition also supports biochar and BECCS but only supports R&D currently and real project implementation | No | No | |||||
| UKG | Biomass Strategy in 2023 | General | Amber | Entirely depends on what is contained in the strategy. If this outlines an increase in biomass thinnings/brash for use, then this may increase this utilisation. This will need to include a positive approach to SRF & miscanthus so that available bioresources in for future bioenergy projects can be realised | No | No | |||||
| UKG | Business model support (moderate, by 2032) | General & Fiscal | Green | Limit on support the limiting factor to how impactful this could be. Business models could result in storage permits being granted earlier than anticipated - but as we have the start year set for 2030 then the policy can't shift this any earlier due to technical storage reasons. | Yes | Yes | Well-developed business models could encourage additional projects to develop. This is likely to lead to around 0.05 Mt CO2/year of biomethane / distillery NETs capacity | ||||
| UKG | Two non-Scottish CCUS clusters active by 2030 (HyNET and East Coast) | General | Red | Would advance entire industry throughout the UK - could be a storage location for some sites in the south of Scotland - though transportation and distances currently rule this out | No | No | |||||
| SG | Statement of NETs targets, beginning in 2032, based on latest gap identified in TIMES modelling (plus margin) for Climate Change Plan | General | Red | No | Yes - target could shift sites to adopt earlier | ||||||
| SG | Sector specific CAPEX funding | Fiscal | Green | Impact will be linked to the value of the CAPEX - would be a sliding scale -- if more ££ available then this could have a bigger impact | Yes | Yes - depends on when the funding is available | Biomethane / distillery sites require low levels of CapEx support while EfW BECCS requires much higher CapEx support. Impact is expected to be around 0.5 Mt CO2/year | ||||
| SG | Additional Funding Streams (aka NETs fund) | Fiscal | Amber | As CAPEX: impact would be linked directly to how much funding is made available. Assumed to be only moderate | No | Yes - depends on when the funding is available | up to 0.1 Mt CO2 | ||||
| SG | "SIETF – Low Carbon Manufacturing Challenge Fund un-paused with £1 million allocated for NETs R&D; £1 million of support towards studies into specific deployment of NETs for energy efficiency and/or deeper decarbonisation projects in industry. £1 million to help establish accounting standards for life cycle emissions assessment of DAC and BECCS in Scotland | Fiscal | Green | All will have positive impacts on NETs in Scotland and heighten the overall understanding around the current state of affairs | Yes | Yes - depends on when the funding is available | up to 0.1 Mt CO2 | ||||
| SG | Just Transition Fund – Skills Passport, £1 million extra award to expand the programme to include energy workers looking to transition to onshore CCUS or NETs | Fiscal | Red | Indirect impact on whole industry | |||||||
| SG | Emerging Energies Technology Fund – 50% of the £80 million funding pot goes towards capex support for NETs | Fiscal | Green | Yes | Yes - depends on when the funding is available | This level of funding will lead to an increase of 0.5-0.7 Mt CO2/year | |||||
| SG | Planning and Consenting policy supportive of NETs | General | Amber | Would shorten the planning process and in theory cost less for a prospective site to implement - reducing overall LCOC | No | Yes | |||||
| SG | Bioenergy Action Plan supportive of NETs | General | Amber | as with the biomass strategy > could incentivise more tech providers to implement in Scotland | No | Yes | |||||
| SG | Pro-NETs public awareness campaign as part of Climate Change Plan, Energy Strategy and Just Transition Plan | Red | Campaigning alone not modelled to have impact -- clearly there is a large cross-over with other policy levers | No | Yes | ||||||
| SG | Planned road improvements/expansions to trunk roads and A-roads incorporate NETs requirements to bring down journey times for road transport from dispersed sites | General | Amber | Reduced journey times and costs would reduce LCOC, unlikely to push more marginal sites into implementation alone. | No | Yes | |||||
| SG | Programme of co-ordination and work with enterprise agencies and industry bodies to help raise line of sight on prospective NETs projects to the supply chain | General | Amber | Increase awareness and overall perception - especially with potential installers | No | Yes | |||||
5.4.3 Pathway 3 – UK Government & Scottish Government Action
| Policy lead | Policy | Policy Area | R/A/G | Impact | Can it be quantified | Could the policy change the implementation period of a NETs project | Mt CO2 estimate - note these impacts are not cumulative | Year the policy impacts the pathway | |||
|---|---|---|---|---|---|---|---|---|---|---|---|
| 2030 | 2035 | 2040 | 2045 | ||||||||
| UKG | Scottish Cluster active by 2030 | General | Green | Link to Acorn/wider CCUS - so imperative to all scenarios | Yes | Yes - timelines of NETs deployment are tied to Acorn, so delaying/accelerating Acorn will delay/accelerate NETs deployment. | Linking to Acorn will encourage additional NETs capacity under the Max pathway including additional EfW and power BECCS capacity, leading up to 6.8 Mt CO2 by 2045. | X | X | X | X |
| UKG | ETS Expansion - include NETs trading scheme | Fiscal | Green | Modelled as having a very large impact. Will depend on what areas it expands into. Currently only power & aviation >> would need to cover all other areas where NETs could be installed (biomethane / industry / waste etc) | Yes | Yes | Expanding the ETS to include a tariff for NETs is expected to be a main driver for developing NETs in Scotland. This leads to an additional NETs of capacity in the range ~ 5-7 Mt CO2/year | X | X | X | X |
| UKG | Biomass strategy in 2023 | General | Amber | Entirely depends on what is contained in the strategy. Suggest that if this outlines an increase in biomass thinnings/brash for use then this may increase this utilisation. This will need to include a positive approach to SRF & miscanthus so that available bioresources in for future bioenergy projects can be realised | No | No | |||||
| UKG | Business model support (Maximum, supports can stack – i.e., bioenergy + CCUS + GGR etc) by 2030 | Fiscal | Green | May bring forward implementation to late 2020s but with storage unavailable until 2030, this isn't seen as having a large impact | Yes | Yes | Well-developed business models could encourage additional projects to develop. This is likely to lead to around 0.1 Mt CO2 by 2030 under the Max pathway | X | X | X | |
| UKG | Three Non-Scottish CCUS clusters active by 2030 (Hynet and East Coast?) | General | Red | Would advance entire industry throughout the UK - could be a storage location for some sites in the south of Scotland - though transportation and distances currently rule this out | No | No | |||||
| UKG | Innovation Funding (similar to CCUS?) | Fiscal | Amber | Depends on the available capital to fund projects - could have a significant impact if there is a lot of capital available. | No | Yes | Depending on what types of sites are funded and whether it would be solely for new or used for both new and existing sites, this policy could lead to additional NETs capacity of around 3-4 Mt CO2 /year. | ||||
| UKG | High GGR targets set UK wide | General | Amber | Incentivise technology suppliers to implement in the UK (and Scotland) | No | Yes | Higher GGR targets could lead to additional NETs capacity but depending on the magnitude of the target and interlinking with other policies (e.g., development of business models, financial incentives, etc.). 1-1.5 MtCO2/year additional NETs have been assumed to be possible. | ||||
| UKG | Economic licensing process simple and sped up | General | Red | Reduce overall upfront costs and reduces LCOC | No | Yes - could cut several years off licensing process | |||||
| SG | Large NETs targets, beginning in 2032 | General | Amber | Incentivise technology suppliers to implement in Scotland specifically | Yes | Yes | This significantly depends on interlinking with other policies. A range of 1-1.5 Mt CO2 is reasonable. | ||||
| SG | Sector specific CAPEX funding | Fiscal | Green | Impact will be linked to the value of the CAPEX - would be a sliding scale -- if more ££ available then this could have a bigger impact | Yes | Yes - depends on when funding is made available | CAPEX funding may choose to incentivise specific sites where the capture costs are comparatively low (e.g., biomethane / distillery BECCS) or where large volumes of NETs can be achieved (e.g., EfW / power BECCS) or where CCS is almost the only solution (e.g., EfW sites not receiving permitting without CCS). This is policy impact is expected to be approximately 2 MtCO2 (existing sites only) for approximately between £15M - £333M depending on the industry selected for priority funding. | X | X | ||
| SG | Additional Funding Streams (aka NETs fund) | Fiscal | Green | As CAPEX: impact would be linked directly to how much funding is made available. Assumed to be only moderate. To be discussed qualitive in the report | Yes | Yes - depends on when funding is made available | Up to around 2 MtCO2 for £800M (note all financial support mechanisms clash with one another -- there is an upper limit on the CO2 that can be captured and stored and also an expected upper limit on how much funding either the SG or UKG can provide. Thus, we wouldn't expect high levels of sector specific funding and high communal pots of money provided by SG and UKG all at the same time. | X | X | ||
| SG | Planning and Consenting policy supportive of NETs | General | Amber | Reduce overall LCOC - This will lead to storage permits being granted and earlier deployment of projects | No | Yes | |||||
| SG | Bioenergy Action Plan supportive of NETs | General | Amber | Could incentivise technology suppliers to implement in Scotland specifically | No | Yes | |||||
| SG | Statement of NETs targets, beginning in 2032, based on latest gap identified in TIMES modelling (plus margin) for Climate Change Plan | General | Amber | Incentivise technology suppliers to implement in Scotland specifically | No | Yes | |||||
| SG | SIETF – Low Carbon Manufacturing Challenge Fund un-paused with £1 million allocated for NETs R&D; £1 million of support towards studies into specific deployment of NETs for energy efficiency and/or deeper decarbonisation projects in industry; £1 million to help establish accounting standards for life cycle emissions assessment of DAC and BECCS in Scotland | Fiscal | Green | All will have positive impacts on NETs in Scotland and heighten the overall understanding around the current state of affairs | Yes | Yes - depends on when funding is made available | |||||
| SG | Just Transition Fund – Skills Passport, £1 million extra award to expand the programme to include energy workers looking to transition to onshore CCUS or NETs | Fiscal | Red | Indirect impact on whole industry | No | No | |||||
| SG | Emerging Energies Technology Fund – 50% of the £80 million funding pot goes towards capex support for NETs | Fiscal | Green | Impact depends on value of fund – sensitivities have been run. | Yes | Yes - depends on when funding is made available | As per other financial policies, there is potential for overlap (also depends on where the communal funds are spent) - £40M could achieve 0.5-0.7 MtCO2 | X | X | ||
| SG | Pro-NETs public awareness campaign as part of Climate Change Plan, Energy Strategy and Just Transition Plan | General | Amber | Increase public awareness and acceptance. Could in turn reduce the number of objections to planning process? | No | No | |||||
| SG | Planned road improvements/expansions to trunk roads and A-roads incorporate NETs requirements to bring down journey times for road transport from dispersed sites | General | Amber | Reduced journey times and costs would reduce LCOC, unlikely to push more marginal sites into implementation alone. | No | Yes | |||||
| SG | Programme of co-ordination and work with enterprise agencies and industry bodies to help raise line of sight on prospective NETs projects to the supply chain | General & Technological | Amber | Increase awareness and overall perception - especially with potential installers | No | No | |||||
5.5 Pathway results
5.5.1 Summary of results
The MtCO2 results for the three pathways is shown in Figure 1 – note that sections 5.5.2 through to 5.5.4 show this in more detail and provide some sensitivity analysis around the central estimates.
Note this is replicated from the executive summary
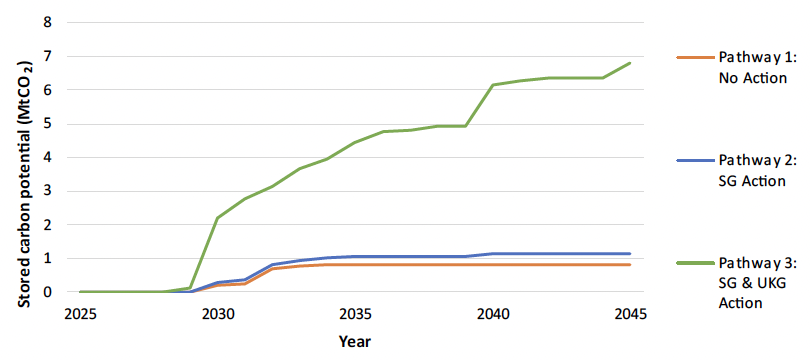
Figure 1 shows that without sustained support for NETs through a variety of policies and fiscal incentives, the total MtCO2 for pathways 1 & 2 stabilize between 2030 and 2035, at moderately low volumes. Pathway 3 sees continued growth as a multitude of supportive policies in particular the NETs trading scheme revenue means that this continues to grow to around 6.8 MtCO2 by 2045. The jump in 2040 is attributed mainly to additional DACCS projects.
Figure 1 shows that the potential CO2 via NETs is significantly lower than the stated NETs targets presented in the CCPu of up to 5.7 MtCO2/year by 2032.
Table 2 shows the yearly stored MtCO2 per pathway up to 2045.
Note this is replicated from the executive summary
| Pathway | Annual stored Carbon, MtCO2 | Cumulative Stored Carbon MtCO2 | |||
|---|---|---|---|---|---|
| 2030 | 2035 | 2040 | 2045 | ||
| 1 - No Action | 0.6 | 0.8 | 0.8 | 0.8 | 16 |
| 2 – SG Action | 0.8 | 1.2 | 1.3 | 1.3 | 25 |
| 3 – UKG & SG Action | 2.2 | 4.5 | 6.1 | 6.8 | 112 |
Table 3 shows the CAPEX per pathway in 5-year increments. The figures are shown as cumulative CAPEX (£M), this is replicated in Figure 8.
Note this is replicated from the executive summary
| Pathway | Annual CAPEX (£M) | Lifetime CAPEX (£M) | |||
|---|---|---|---|---|---|
| 2030 | 2035 | 2040 | 2045 | ||
| 1 - No Action | 702 | - | - | - | 708 |
| 2 – SG Action | 823 | - | 1 | - | 824 |
| 3 – UKG & SG Action | 1,314 | 292 | 1,568 | 157 | 4,320 |
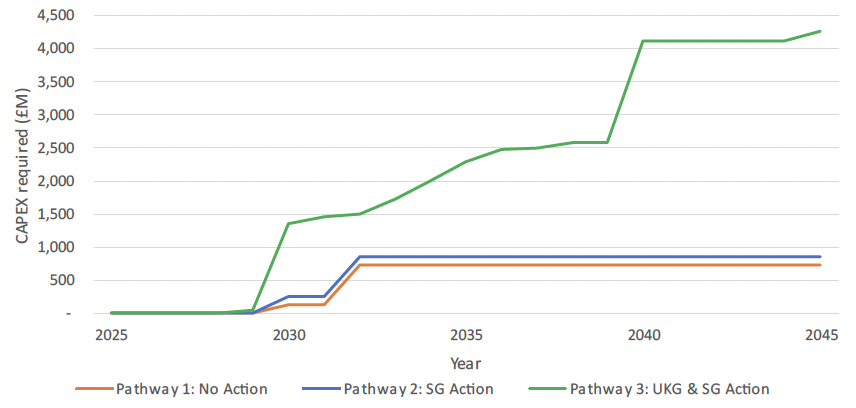
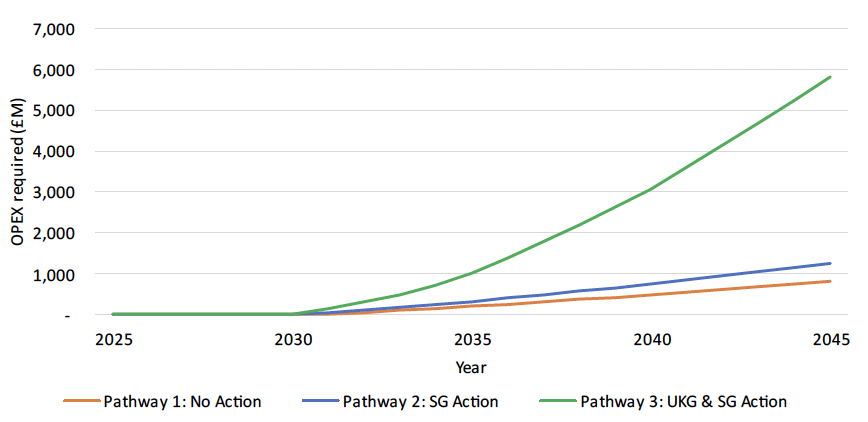
Table 22 shows the OPEX per pathway for operating a NETs facility. The figures presented in this table are annual, with the lifetime/cumulative total for 2045 also included. These are important to the overall narrative of NETs and indeed CCUS in general – none of the fiscal support policies that were evaluated and introduced across the pathways were strictly related to ongoing operation of a NETs site. Where revenue from a NETs tariff is included (pathway 3) it is assumed that this revenue would be used to cover the OPEX of the site (as with the revenue included the sites associated had negative LCOC (i.e., were sites that could implement NETs without being financially penalised. However, in pathways 2 & 3, these OPEX costs would be met by the site operator, and it is likely that this would lead to an increase in product costs irrespective of the technology.
| Pathway | Annual OPEX (£M) | Lifetime OPEX (£M) | |||
|---|---|---|---|---|---|
| 2030 | 2035 | 2040 | 2045 | ||
| 1 - No Action | - | 53 | 60 | 68 | 854 |
| 2 – SG Action | - | 78 | 89 | 105 | 1,294 |
| 3 – UKG & SG Action | 12 | 317 | 444 | 576 | 5,812 |
5.5.2 Pathway 1 – No Action
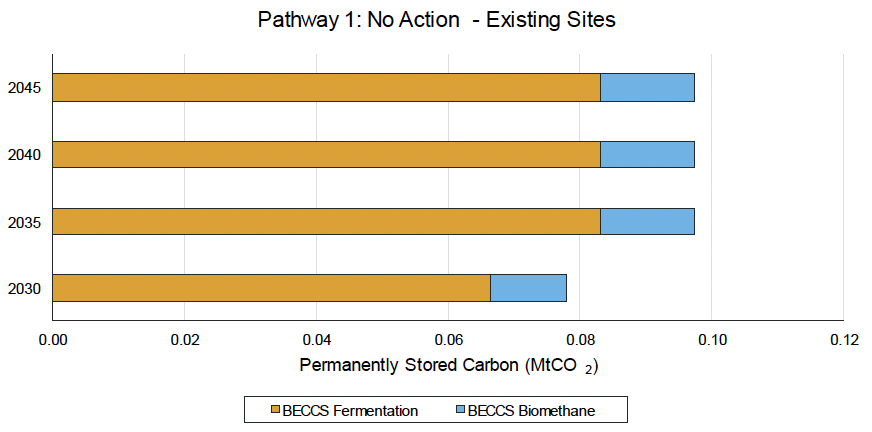
The No Action pathway for existing sites is dominated by those that already have funding and a potential pathway to NETs – predominantly dominated by sites on project NEXUS. Note that due to confidentiality agreements, there have only been a select few sites that have confirmed they are part of project NEXUS, but conversations with the developer during the stakeholder engagement process outlined that there are several others signed on to the project that have yet to be named. Therefore, the sites are made up of those that have confirmed, and others that represent sites of an average tCO2 output from our base list of sites.
Table 23 shows the existing sites that were contained in this pathway:
| NETs sector | Number of sites | CAPEX (£M) | Annual OPEX (£M) (year 1) |
|---|---|---|---|
| BECCS Fermentation | 7 | 9.2 | 1.4 |
| BECCS Biomethane | 3 | 3.6 | 0.4 |
| Total | 10 | 12.8 | 1.8 |
It must be noted that whilst project NEXUS has received funding and will go ahead, whether or not these negative emissions will be stored permanently or utilised in other industries is not confirmed. This is partly due to the uncertainty over the permanent storage solutions on offer, and, perhaps more pertinently, the other uses for the captured CO2 can go to (see section 2.1). Discussions with a current biomethane site in Scotland which is not part of project NEXUS indicated that if they were to implement NETs at their site (a real consideration with proposals having been drawn up and decisions to be made in the coming years), the likely use of the stored CO2 would be in food and drinks industries that are local. Thus, whilst there may be many more sites associated with project NEXUS coming forward in the interim years through to 2030, whether or not these are permanently stored emissions remains to be seen.
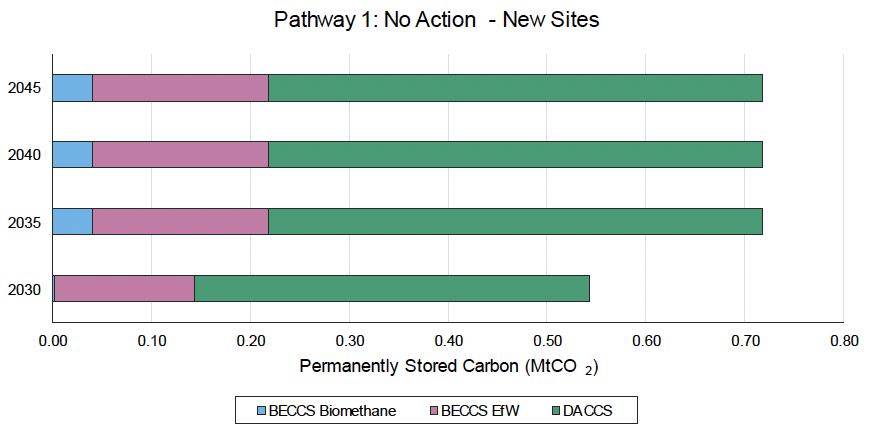
New sites in pathway 1 (and new sites in pathway 2 (Figure 14)) are dominated by the Storrega project dreamcatcher DACCS plant planned for deployment along with the Acorn project coming on-line at the end of the 2020s into 2030. This is assumed to capture and permanently store 0.5 MtCO2/year in all pathways – this is a conservative assumption based on Storrega’s public expectations. The sensitivity for DACCS ranges from 0.4 MtCO2 (i.e. -20%) to 1.0 MtCO2. This higher figure for the DACCS sensitivity relates to the potential maximum capture of the Storrega plant, which is stated as 1.0 MtCO2.
The other CO2 is derived from biomethane sites, linked to the future demand for green gas on the network and includes a single EfW site. A single EfW site was included as there are several in planning and our understanding is that rigid requirements on future EfW sites will be placed, one of these being carbon capture. The number of EfW sites included in the other pathways is increased, to test this assumption on future CCS-ready EfW sites.
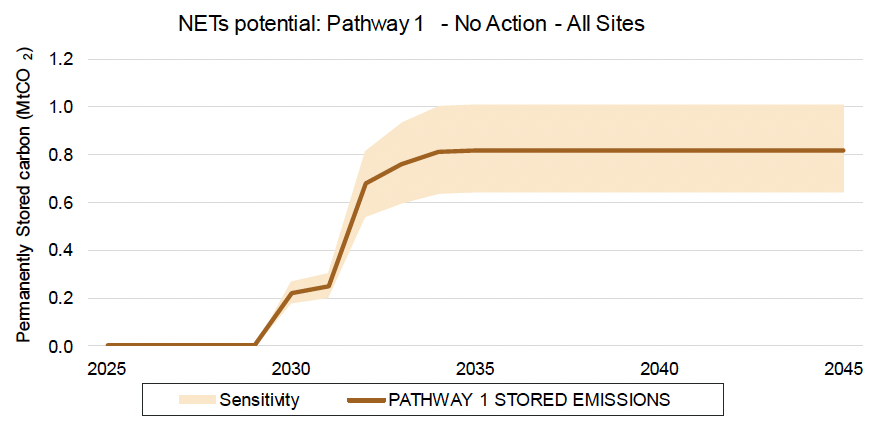
Figure 12 shows the combination of existing and new sites into the pathway, resulting in a NETs potential of around 0.2 MtCO2 in 2030 rising to approximately 0.8 MtCO2 in 2035, where this then stabilises.
| NETs sector | 2030 MtCO2 | 2035 MtCO2 | 2040 MtCO2 | 2045 MtCO2 |
|---|---|---|---|---|
| BECCS Power | - | - | - | - |
| BECCS Industry | - | - | - | - |
| BECCS Fermentation | 0.07 | 0.08 | 0.08 | 0.08 |
| BECCS Biomethane | 0.01 | 0.05 | 0.05 | 0.05 |
| BECCS EfW | 0.14 | 0.18 | 0.18 | 0.18 |
| DACCS | 0.40 | 0.50 | 0.50 | 0.50 |
| Biochar | - | - | - | - |
| BECCS Hydrogen | - | - | - | - |
| Total | 0.62 | 0.82 | 0.82 | 0.82 |
| NETs sector | 2030 | 2035 | 2040 | 2045 |
|---|---|---|---|---|
| BECCS Power | 0% | 0% | 0% | 0% |
| BECCS Industry | 0% | 0% | 0% | 0% |
| BECCS Fermentation | 11% | 10% | 10% | 10% |
| BECCS Biomethane | 2% | 7% | 7% | 7% |
| BECCS EfW | 23% | 22% | 22% | 22% |
| DACCS | 64% | 61% | 61% | 61% |
| Biochar | 0% | 0% | 0% | 0% |
| BECCS Hydrogen | 0% | 0% | 0% | 0% |
| Total | 100% | 100% | 100% | 100% |
5.5.3 Pathway 2 – Scottish Government Action
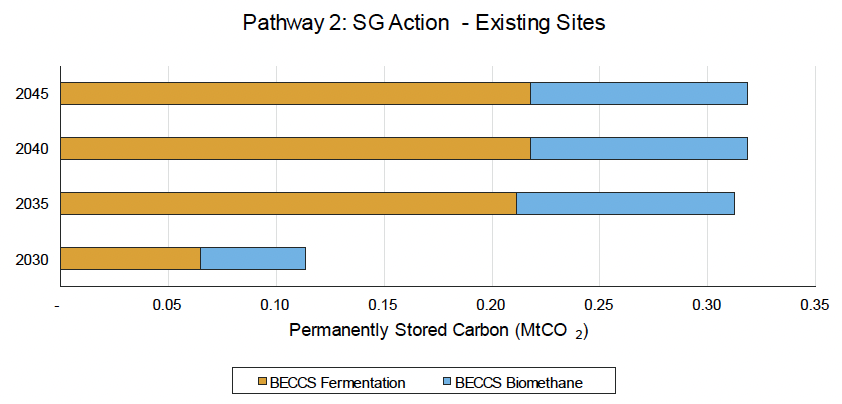
The Scottish Government Action pathway for existing sites is built up from , similar Pathway 1, sites that already have funding and a potential pathway to NETs – predominantly dominated by sites on project NEXUS – and then future sites that have been established based on our assumption of available CAPEX funding (non-sector specific but aimed at the lowest LCOC so this means that it ultimately is focussed on biomethane and fermentation sites) being made available in this pathway (£40M).
| NETs sector | Number of sites | CAPEX (£M) | Annual OPEX (£M) (year 1) |
|---|---|---|---|
| BECCS Fermentation | 21 | 24.6 | 8.0 |
| BECCS Biomethane | 14 | 15.3 | 3.6 |
| Total | 35 | 39.9 | 11.6 |
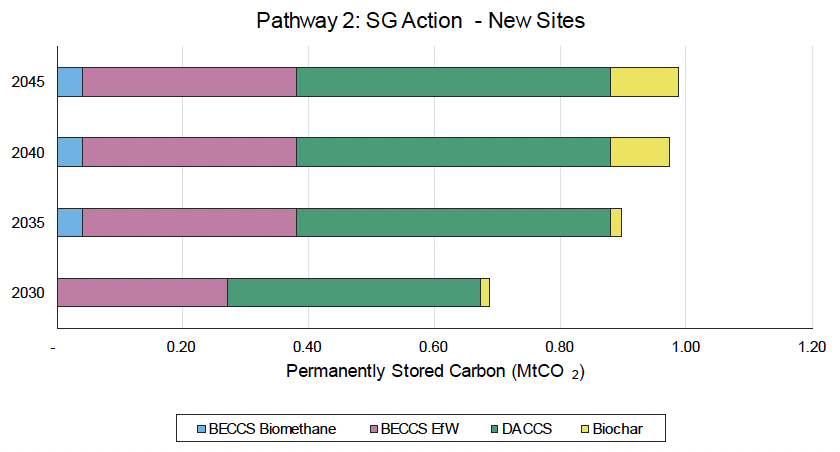
Similar to pathway 1, the future sites are made up from biomethane sites, the planned Storrega DACCS plant, two EfW sites and also two large scale biochar plants. Ultimately the capacity of biochar plants that could be implemented will depend on the available bioresources and how the current trial plants operate over the next 2-3 years.
| 2030 MtCO2 | 2035 MtCO2 | 2040 MtCO2 | 2045 MtCO2 | |
|---|---|---|---|---|
| BECCS Power | - | - | - | - |
| BECCS Industry | - | - | - | - |
| BECCS Fermentation | 0.06 | 0.21 | 0.22 | 0.22 |
| BECCS Biomethane | 0.05 | 0.14 | 0.14 | 0.14 |
| BECCS EfW | 0.27 | 0.34 | 0.34 | 0.34 |
| DACCS | 0.40 | 0.50 | 0.50 | 0.50 |
| Biochar | 0.01 | 0.02 | 0.09 | 0.11 |
| BECCS Hydrogen | - | - | - | - |
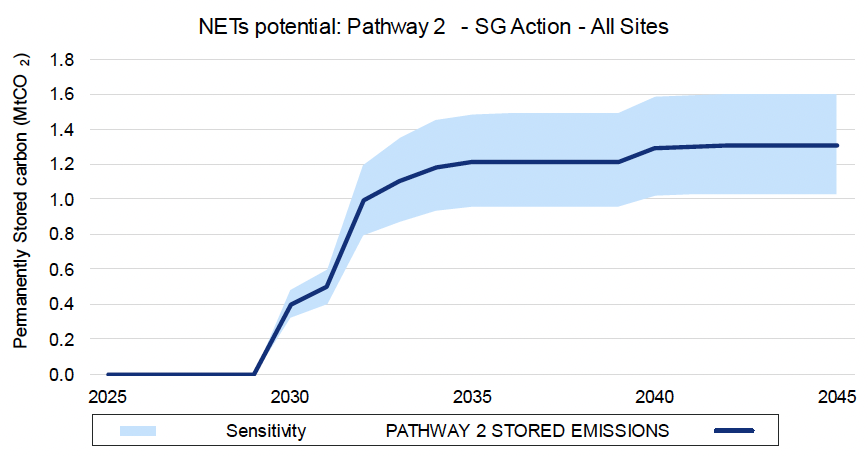
| Total | 0.80 | 1.21 | 1.29 | 1.31 |
| 2030 | 2035 | 2040 | 2045 | |
|---|---|---|---|---|
| BECCS Power | 0% | 0% | 0% | 0% |
| BECCS Industry | 0% | 0% | 0% | 0% |
| BECCS Fermentation | 8% | 18% | 17% | 17% |
| BECCS Biomethane | 6% | 12% | 11% | 11% |
| BECCS EfW | 34% | 28% | 26% | 26% |
| DACCS | 50% | 41% | 39% | 38% |
| Biochar | 2% | 1% | 7% | 8% |
| BECCS Hydrogen | 0% | 0% | 0% | 0% |
| Total | 100% | 100% | 100% | 100% |
5.5.4 Pathway 3 – UKG & SG Action
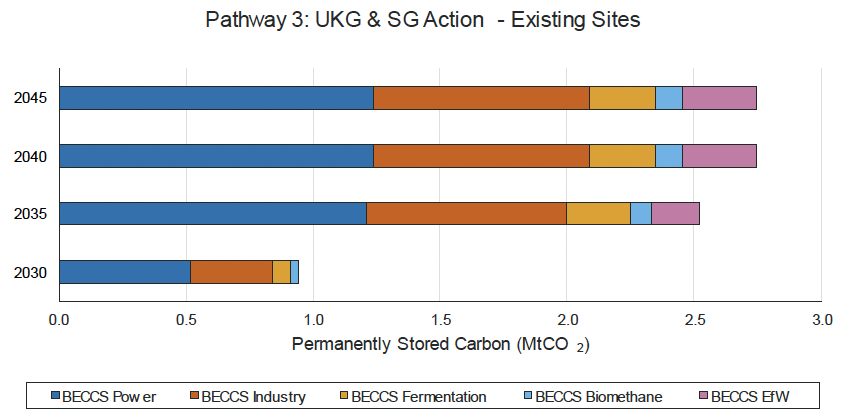
Pathway 3 is very differently constructed to pathways 1 & 2 with a significant increase in both existing and new sites being included in the pathway. The LCOC analysis outlined in sections 2.1 and 4.1 and the inclusion of the NETs trading scheme has meant that where the previous pathways were focussed on the maximum deployable NETs without UK Government intervention (which result in low CO2 capture volumes), pathway 3 includes several BECCS Power, BECCS Industry and BECCS EfW sites, as these now meet the LCOC criteria required with the inclusion of the revenue from the NET tariff. This means that a substantially higher NET potential can be achieved, but ultimately this will come at significant cost both in terms of any up-front capital that may be supported (as either a sector specific or less-focussed funding mechanism) by either the Scottish or UK Governments – but also has high on-going cost through the credit revenue stream (this ultimately would be indirectly part-funded through government funds.)
Table 29 shows the existing sites that were contained in this pathway:
| NETs sector | Number of sites | CAPEX (£M) | Annual OPEX (£M) (year 1) |
|---|---|---|---|
| BECCS Power | 5 | 354.1 | 94.1 |
| BECCS Industry | 5 | 377.3 | 102.5 |
| BECCS EFW | 3 | 290.6 | 47.0 |
| BECCS Biomethane | 15 | 20.1 | 3.8 |
| BECCS Fermentation | 37 | 41.8 | 9.1 |
| DACCS | 0 | 0.0 | 0.0 |
| Biochar | 0 | 0.0 | 0.0 |
| BECCS Hydrogen | 0 | 0.0 | 0.0 |
| Total | 65 | 856.0 | 256.6 |
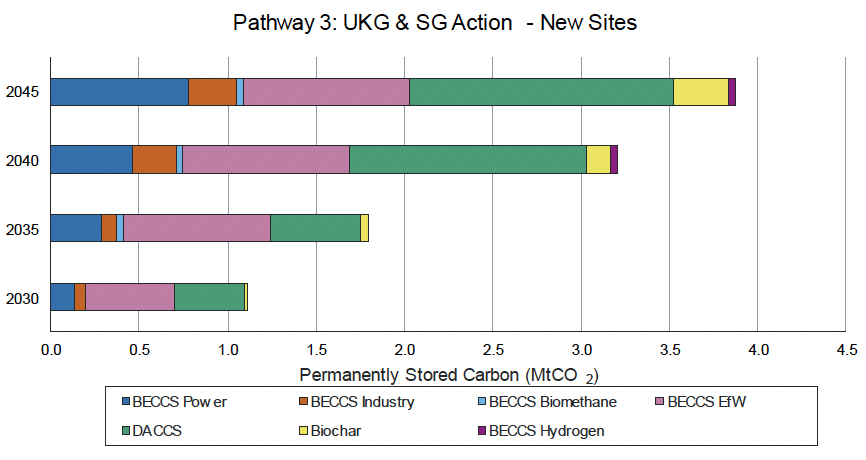
New sites are no longer dominated by those that could implement NETs at the very lowest cost. BECCS Power, BECCS Industry, BECCS EfW and BECCS Hydrogen are all included in this pathway and are ultimately competing for the same bioresources. This means that a boundary can be placed on the “future” sites that may not have been considered if using at top-down approach to meeting net-zero targets.
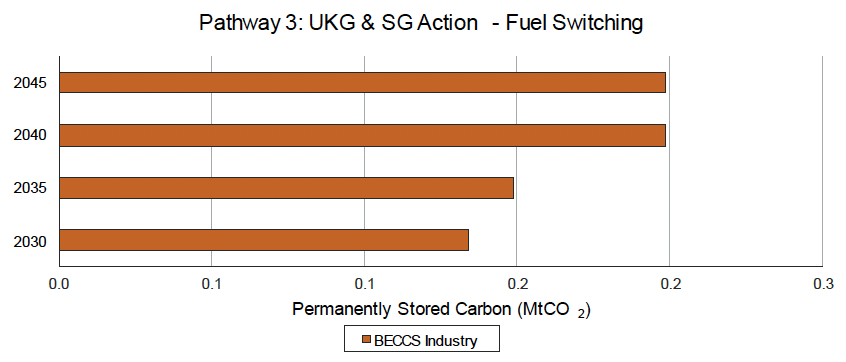
Some fuel switching sites have been included in this pathway. It is assumed that these sites would be those that have a ready source of cheap biomass fuels - and are thus expected to be within the wood industry shifting from any residual conventional power/heat systems that may be installed at these sites. Fuel-switching is inherently difficult to estimate – there was no indication from any of the stakeholders approached during this project that they would consider moving to a biogenic fuel source unless there was some incentive there to do so.
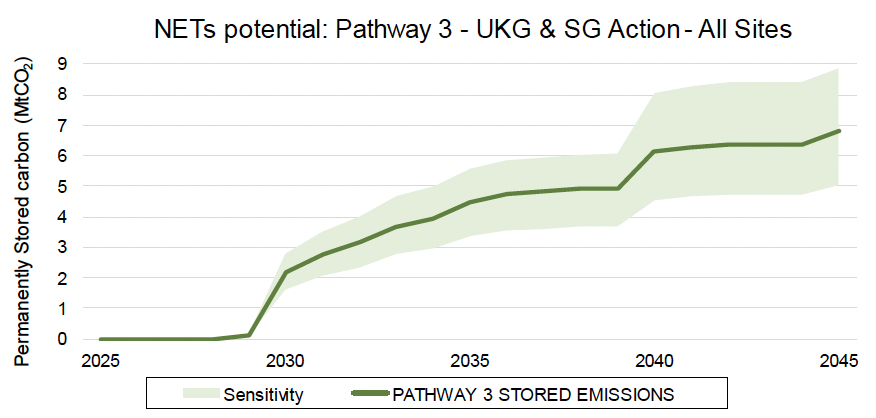
6.8 MtCO2 is estimated as being captured and permanently stored in this pathway, some high-level sensitivity shows that this could rise to ~8.5 MtCO2.
| 2030 MtCO2 | 2035 MtCO2 | 2040 MtCO2 | 2045 MtCO2 | |
|---|---|---|---|---|
| BECCS Power | 0.6 | 1.5 | 1.7 | 2.0 |
| BECCS Industry | 0.5 | 1.0 | 1.2 | 1.2 |
| BECCS Fermentation | 0.1 | 0.2 | 0.3 | 0.3 |
| BECCS Biomethane | 0.0 | 0.2 | 0.2 | 0.2 |
| BECCS EfW | 0.5 | 1.0 | 1.2 | 1.2 |
| DACCS | 0.4 | 0.5 | 1.4 | 1.5 |
| Biochar | 0.0 | 0.0 | 0.1 | 0.3 |
| BECCS Hydrogen | - | - | 0.0 | 0.0 |
| Total | 2.2 | 4.5 | 6.1 | 6.8 |
| 2030 | 2035 | 2040 | 2045 | |
|---|---|---|---|---|
| BECCS Power | 29% | 33% | 28% | 30% |
| BECCS Industry | 24% | 22% | 20% | 18% |
| BECCS Fermentation | 3% | 5% | 4% | 4% |
| BECCS Biomethane | 1% | 4% | 4% | 3% |
| BECCS EfW | 23% | 23% | 20% | 18% |
| DACCS | 18% | 11% | 22% | 22% |
| Biochar | 1% | 1% | 2% | 5% |
| BECCS Hydrogen | 0% | 0% | 1% | 1% |
| Total | 100% | 100% | 100% | 100% |
5.6 Sensitivity analysis
A sensitivity analysis was conducted to test the impact that certain parameters have on NETs potential and respective investment costs. Table 32 below provides a summary of the parameters tested and the resulting impact on NETs potential and associated costs.
| Sensitivity | NETs Potential impact (MtCO2/year) | CAPEX impact (£M) | ||
|---|---|---|---|---|
| Pathway 2 | Pathway 3 | Pathway 2 | Pathway 3 | |
| Reduction in capture potential threshold from 2,500 tCO2/year to 1,000 t/year | 0.08 | 0 | 19.8 | 0 |
| Remove threshold for transportation costs as a fraction of OPEX criteria | 0.03 | N/A | 6.24 | N/A |
| Increase CAPEX funding pool from £40M to £100M | 0.82 | 0.27 | 135 100 from funding pool 35 separately funded (to fully convert the Markinch Biomass CHP Plant) | 153 (100 from funding pool) 53 separately funded (to fully convert the Levenseat EfW plant) |
5.6.1 Sensitivity 1: Minimum negative capture potential
The assumed lower bound criterion of a NET site requiring to provide at least 2,500 tCO2 of negative emissions per year was tested. This analysis was applied to pathway 2 as the minimum threshold was already reduced for pathway 3.
Result: The reduction in the negative emission threshold led to 44 additional sites being considered within Pathway 2 – an almost doubling in sample size. These additional sites were categorised as one BECCS Biomethane and 43 BECCS Fermentation sites, where the negative emission potential increased from 0.36 MtCO2/year to 0.44 MtCO2/year at an investment cost of £19.8M.
5.6.2 Sensitivity 2: Transportation costs as a fraction of OPEX
The criterion of a NET site not being able to have a CO2 transportation cost that is greater than 50% variable OPEX was challenged. This criterion was removed, which was tested for Pathway 2.
Result: The disregard of transportation costs as a criterion led to 11 additional sites being considered under Pathway 2. These additional sites were categorised as two BECCS Biomethane and 9 BECCS Fermentation sites, resulting in a small negative emission increase from 2.74 MtCO2/year to 2.77 MtCO2/year at an investment cost of £6.2M.
5.6.3 Sensitivity 3: Profitability test
The profitability test was removed once the NETs trading scheme revenue was included. The results of this sensitivity analysis are already considered within the LCOC results of Section 5.5.
5.6.4 Sensitivity 4: CAPEX boundary and sectors-specific funding
Under this sensitivity analysis, the upper boundary on CAPEX was removed and the assumed funding pool available to convert potential sites to NETs, which didn't meet the pathway criteria, was increased from £40M to £100M. The process behind allocating this funding was on a LCOC basis, with sites having the lowest LCOC being prioritised.
Result: Pathway 2
Initially, 48 existing sites met the criteria to be considered in Pathway 2. The pool funding increase to £100M enabled an additional 85 sites to be installed. The additional sites included were:
- x2 BECCS Biomethane sites (utilising £1.4M of the funding)
- x82 BECCS Fermentation sites (utilising £31.4M of the funding)
- x1 BECCS Power site (utilising £67.2M of the funding)
- The site would need to have additional funding of £35M in order to cover the entire investment cost of CCS (the site chosen was Markinch Biomass CHP Plant).
The resulting increase in sites being considered led to the negative emission potential increasing considerably from 0.4 MtCO2/year to 1.2 MtCO2/year. This came at the cost of £135.M, where £100M was dedicated to the funding pool and £35.M dedicated to fully converting the Markinch Biomass CHP Plant using additional funds.
Result: Pathway 3
Initially, 65 existing sites met the criteria to be considered in Pathway 3. The pool funding increase to £100M enabled an additional 90 sites to be considered.
- x4 BECCS Biomethane sites (utilising ~£3.1M of the funding)
- x84 BECCS Fermentation sites (utilising ~£29M of the funding)
- x2 BECCS EfW sites (utilising ~£67.9M of the funding.)
- The Levenseat EfW site would need to self-fund £51.98M in order to cover the entire CCS investment cost).
- The site would need to have additional funding of £52M in order to cover the entire investment cost of CCS (the site chosen was Levenseat EfW)
The resulting increase in sites being considered led to the negative emission potential increasing slightly from 2.7 MtCO2/year to 3.0 MtCO2/year. This came at the cost of £153.6M, where £100M was dedicated to the funding pool and £53.6M dedicated to fully converting the Levenseat EfW plant using additional funds. The reason behind the negative emission potential, despite the large investment required, is because the EfW sites are combusting/gasifying waste that has a biogenic content of 17-50% by weight.
5.6.5 Sensitivity 5: Introduction of a negative emission credit
This sensitivity analysis has already been considered within the LCOC results analysis. See Section 5.5 for the impact of including a negative emission price to all NETs.
5.6.6 Sensitivity 6: Improved future deployment rates of CCS in power / CHP BECCS and EfW sectors
This sensitivity tested the increase of CCS penetration rates for future biomass power and CHP and EfW sites from 50% to 100%. Currently it is expected that such sites will be required to be carbon capture ready from the start (in order to receive planning and permitting). However, whether such sites go ahead and install CCS will depend on whether this becomes economically feasible in the future. The analysis used penetration rates of 50% based on the fact that half of the sites will have their LCOC lowered (whether by reducing CapEx based on new learning, improving capture rates or reducing OpEx, etc.) to below the carbon price (which is also expected to rise in the future). This sensitivity assumes that the LCOC reduces further making it feasible for all future sites to install CCS and thus become NET contributors or carbon removals.
Adjusting the penetration rates of BECCS Power, BECCS Industry & BECCS EfW to 100% would increase the 2045 NET potential to 8.7 Mt CO2.
Contact
Email: NETs@gov.scot