Publication - Research and analysis
Monthly economic brief: February 2023
The monthly economic brief provides a summary of latest key economic statistics, forecasts and analysis on the Scottish economy.
Consumption
Consumer sentiment fell to a time series low in the final quarter of 2022.
Consumer sentiment
- Consumer sentiment indicators continue to highlight the pressures that households and consumers face from the sharp rise in inflation and cost of living.
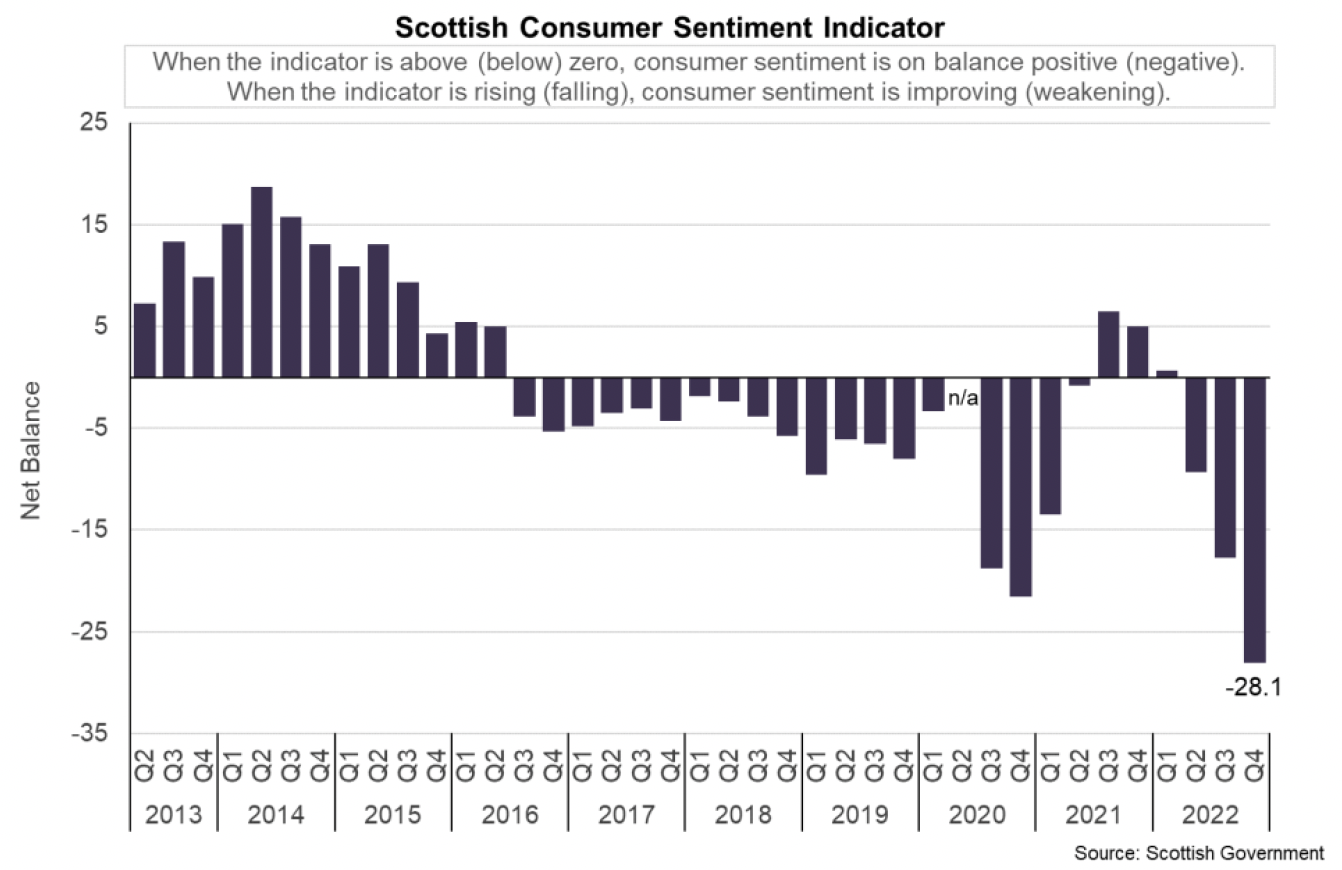
- These challenges intensified over 2022 which has been reflected in a sharp drop off in the Scottish Consumer Sentiment Indicator. In the final quarter of 2022, the composite indicator fell to its lowest level in the time series, with all 5 sub-indicators falling across the quarter and the indicators for household financial security and attitudes to spending in particular falling to their lowest levels since the series began.[14]
- In Q4 2022, the Scottish Consumer Sentiment Indicator stood at -28.1, decreasing by 10.4 points since Q3, implying a significant weakening in sentiment over the period.
- On a monthly basis during the fourth quarter, data show consumer sentiment was lowest in October (-29.4 points), before improving marginally in November (-28.8) and December (-26.1). However, sentiment remains significantly negative overall, having fallen 33.4 points since the start of the year.
- The weakness in sentiment has been broad based regarding the economy, security of household finances and relaxedness about spending money.
- On the economy, respondents on balance consider current economic circumstances to be worse than last year (-34.0, down from -22.8 in Q3) and expect the economy to deteriorate over the coming year relative to the current situation (-3.8, down from 7.5 in Q3).
- Following a positive score in Q1 2022 (1.3), the current economy indicator has decreased sharply since then (by 35.3 points) to its lowest level since Q2 2021 while the expected economy indicator has entered negative territory for the first time since Q2 2020.
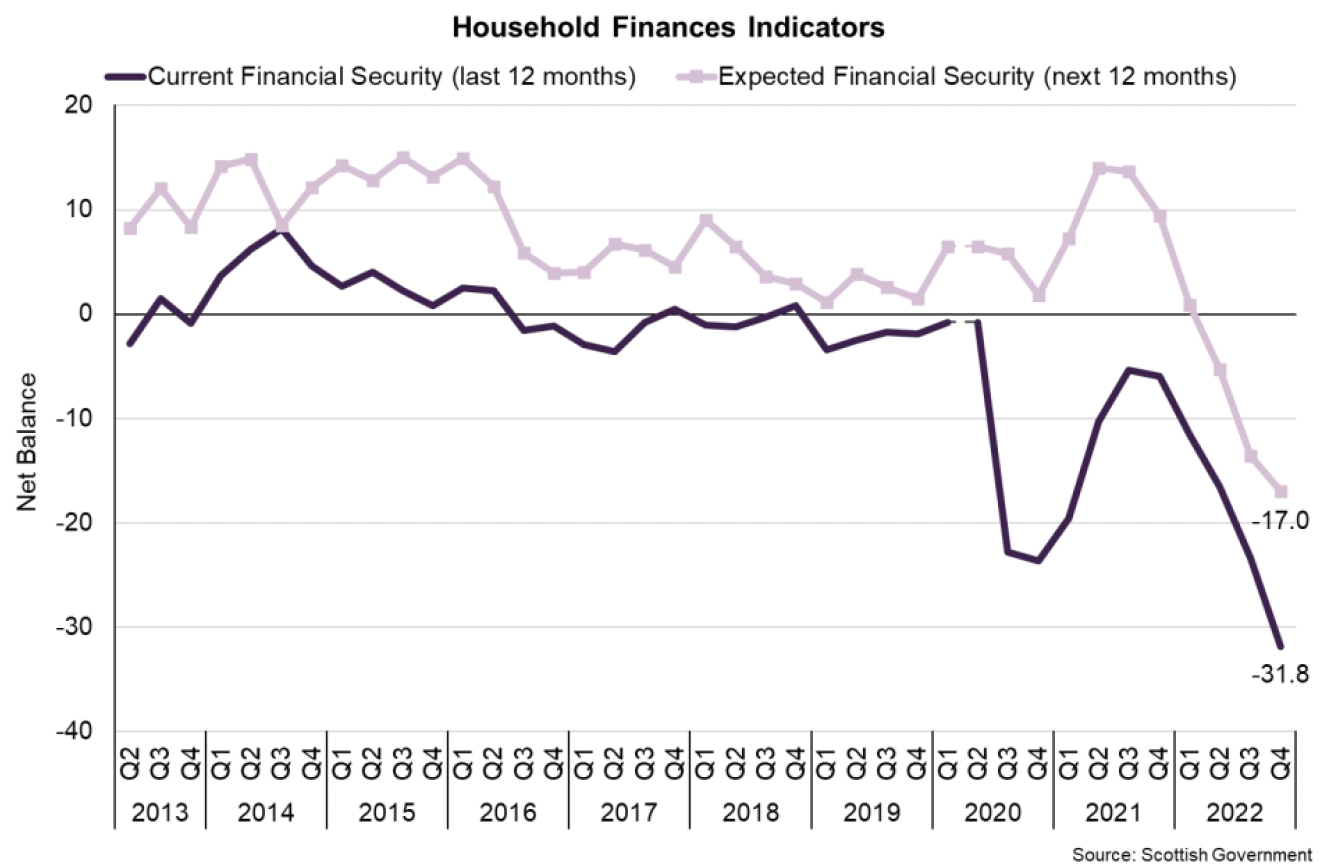
- In terms of households personal finances, respondents on balance continued to report that their household finances are less secure than 12 months ago (-31.8, down from -23.5 in Q3). Furthermore, looking ahead, respondents continue to expect their financial security to fall over the coming year (-17.0, down from -13.6 in Q3), with both indicators falling to their lowest levels in the time series.
- Furthermore, since the beginning of the year, households have been increasingly uneasy about spending money as inflationary and cost of living pressures have increased. In Q4, the spending indicator reached its lowest level in the time series (-53.8, down from -36.1 in Q3).
- The weakening in sentiment towards spending is consistent with the fall in sentiment regarding the economy and security of household finances and reflects the challenging economic and financial environment households are facing and the risks to consumption growth over the months ahead.
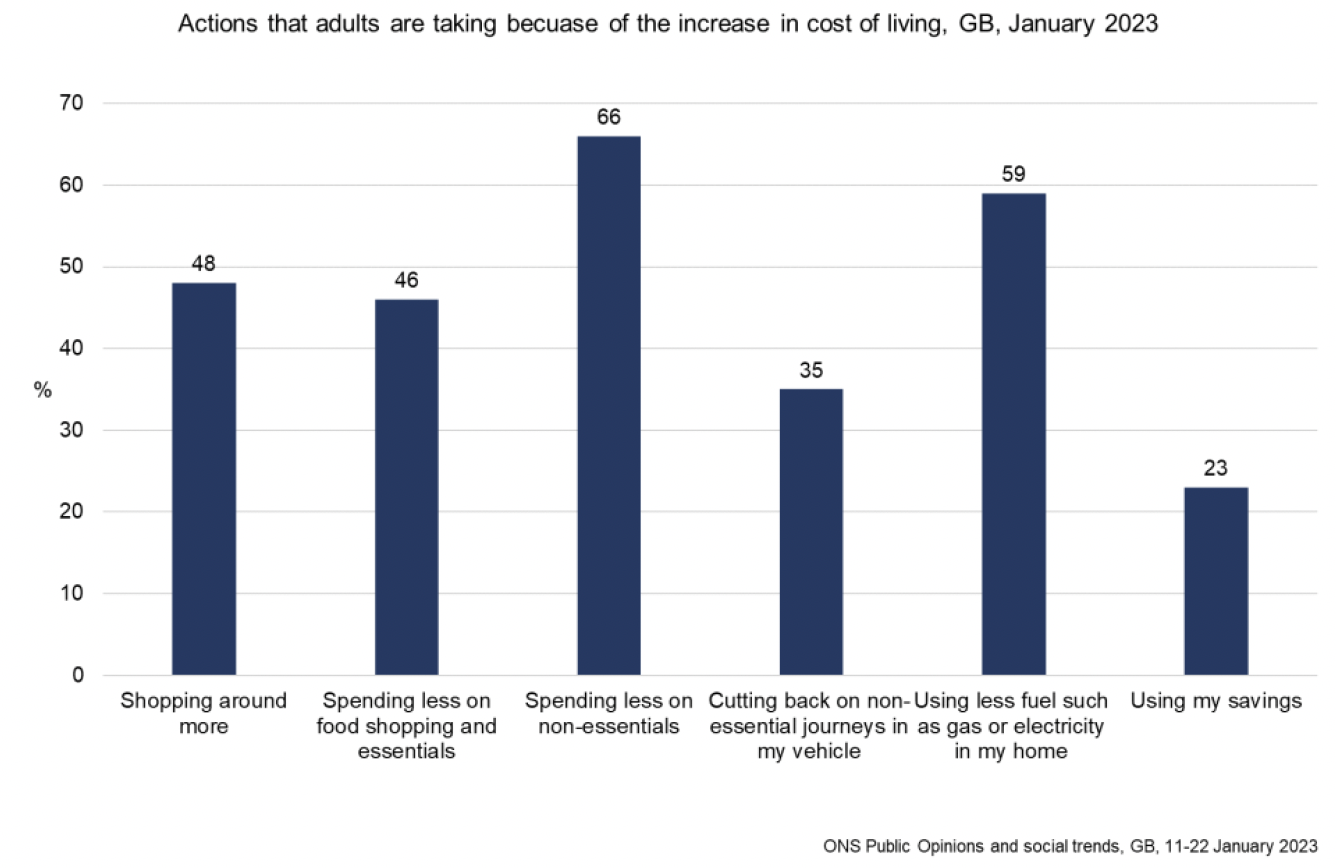
- This is seen in other household surveys. At a GB level, the ONS Public Opinions and Social Trends survey for January showed that 92% of adults reported an increase in the cost of living compared with a year ago and 67% reported an increase compared to the previous month.[15] The reasons for the increase in the cost of living remain unchanged compared to the end of 2022: (i) price of food shopping (94%); (ii) gas or electric bills (74%); (iii) price of fuel (41%).
- The most common actions reported were spending less on non-essentials (66%) and using less fuel such as gas or electricity in their home (59%). This is a similar response to the previous period (65% and 59%, respectively)). In January, more adults reported shopping around more (48%) and spending less on food shopping and essentials (46%) than in the previous period (44% and 41% respectively).
Retail Sales
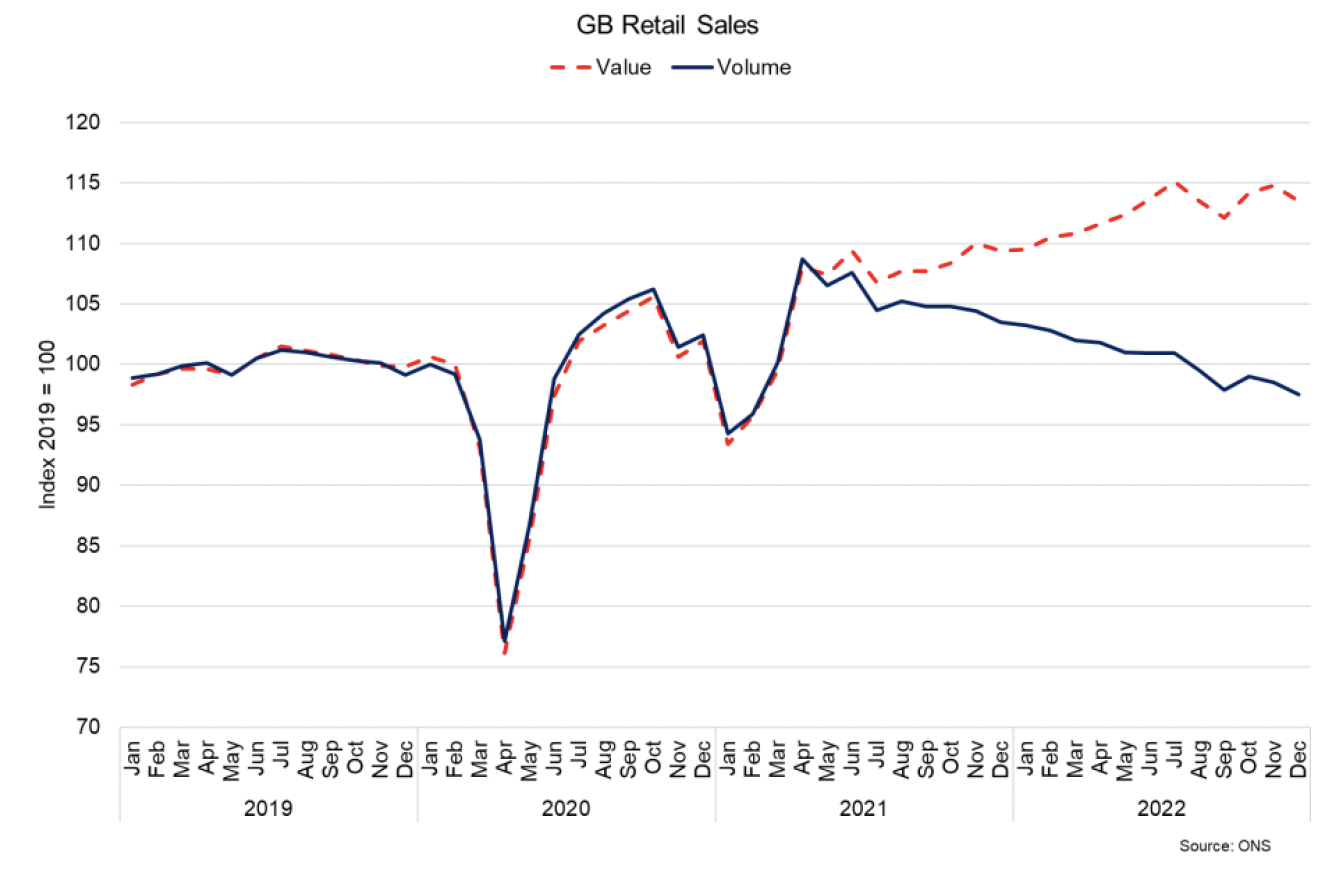
- GB retail sales volumes fell 1% in December 2022, with a 2.1% fall in non-food store sales and 0.3% in food store sales. This continues the downward trend in retail sales volumes since summer 2021.[16]
- Overall compared to December 2021, sales volumes decreased 5.7% as the lifting of restrictions on hospitality enabled a return to eating out, and more recently rising prices and the cost of living affected sales volumes.
- The value of retail sales increased by 4.5% over this period, reflecting the increase in prices and fall in purchasing power that consumers are facing illustrated in the chart below by the widening gap between GB retail sales value and volume sold.
Contact
Email: OCEABusiness@gov.scot