Justice Social Work Statistics in Scotland: 2021-22
This publication presents national-level information on justice social work activity in Scotland. It includes data on justice social work services and social work orders, as well as characteristics of the individuals involved.
Part of
5.3 Drug treatment and testing orders
(Tables 2 & 18 to 22 and Charts 6 & 7)
5.3.1 The drug treatment and testing order (DTTO) is available to courts (excluding justice of the peace courts). It is an intensive disposal for people with substance-related offending who might otherwise get a custodial sentence. The less intensive DTTO II is available to courts in City of Edinburgh, East Lothian, Midlothian and Highland. DTTO IIs accounted for around 13 per cent of the DTTOs in these areas in 2021-22 (see paragraph B.7 in Annex B).
Chart 6 Drug treatment and testing order commencements, terminations and completions/discharges: 2012-13 to 2021-22
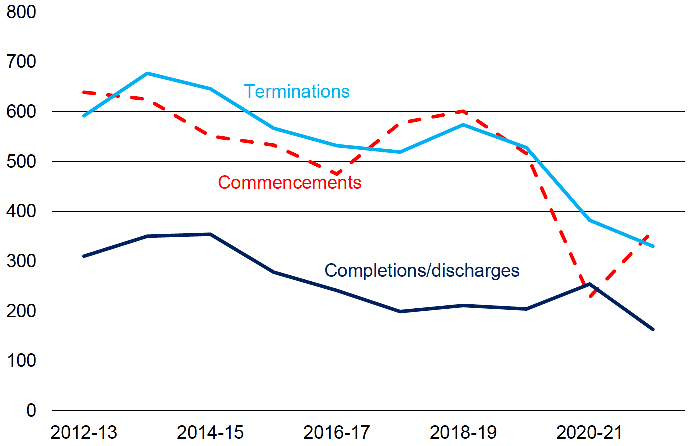
5.3.2 The COVID-19 pandemic meant a large number of court cases could not be conducted. As a result, the number of DTTOs commenced fell to 230 in 2020-21, the lowest level in the last decade (Chart 6). While numbers rose to by 58 per cent in 2021-22 to 360, this was still a very low level, with numbers for the five years before 2020-21 averaging 540.
5.3.3 Over the last five years, people aged 31 to 40 have been the most likely to receive a DTTO. In relation to Scotland's population, two people per 10,000 for this age range got a DTTO in 2021-22. Compared to the other age ranges, those aged 25 and under and over 40 were the least likely to receive a DTTO (both 0.6 people per 10,000 population in 2021-22).
5.3.4 The proportion of orders issued to males has been around 80 per cent over the last five years. A very high proportion, generally around 90 per cent, of those receiving a DTTO are unemployed or economically inactive.
5.3.5 The average length of a DTTO was generally around 17 or 18 months in the last five years.
5.3.6 There were 450 DTTOs in existence on 31 March 2022. This was seven per cent higher than in 2020-21 but 21 per cent lower than in 2019-20.
Timescales for implementation
(Table 19)
5.3.7 In 2021-22, for DTTOs where first direct contact was known, 64 per cent had contact within one working day of the order being imposed. In 13 per cent of cases, it took longer than five working days for first direct contact to take place.
5.3.8 Where known, the first case management meeting took place within five working days in 2021-22 for 83 per cent of orders. In eight per cent of these cases, it took longer than ten working days for the first meeting to take place.
5.3.9 These proportions can fluctuate from year to year due to the small number of orders involved. The figures for 2020-21 and 2021-22 are broadly similar to previous years. Therefore, while implementation may have been affected by the COVID-19 pandemic, the trends have remained stable.
Terminations
(Tables 2 & 20 and Chart 7)
5.3.10 The percentage of orders successfully completed tends to be lower for DTTOs than for other social work orders. This is due, in part, to the complex needs of those involved and the intensity of the supervision involved in a DTTO.
5.3.11 The completion rate for DTTOs terminated in 2020-21 was 67 per cent. This was substantially higher than at any point in the last ten years. This rate was, however, likely to have been influenced by the impact of the coronavirus pandemic. Particular factors may be the type of cases where it had been possible for the order to finish and the fact that, over some periods, it was not possible to conduct testing. The completion rate then fell to 50 per cent in 2021-22. In previous years, the rate rose to 55 per cent in 2014-15 before falling to 39 per cent in 2019-20. Caution is advised in drawing any conclusions on completion rates over time.
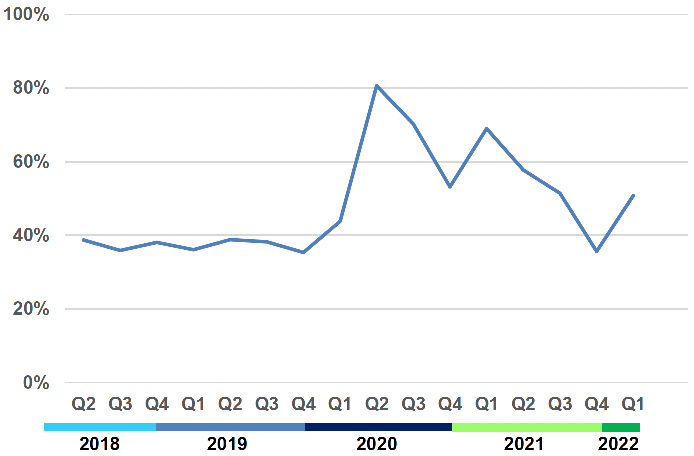
5.3.12 Chart 7 shows how successful completion rates each quarter have changed over the last four years. Prior to the pandemic, rates were consistently just under 40 per cent. There was a slight rise during the first quarter of 2020 before the rate rose sharply to 81 per cent in the second quarter. Since then, rates have been on a general downward trend, with the exception being the first quarters of both 2021 and 2022. The higher levels are likely to reflect the COVID-19 restrictions in place during those periods which impacted on the supervision of orders. Figures should therefore be treated with caution.
5.3.13 The proportion of orders revoked due to review and due to breach in 2021-22 were 32 and 9 per cent respectively. A custodial sentence was imposed in 46 per cent of revoked cases in 2021-22.
5.3.14 Seventy-eight per cent of orders terminated without breach applications in 2021-22. Almost all (98 per cent) of breach applications were lodged with the court within five working days of the decision being made to make an application (see the additional datasets which accompany this publication).
Contact
Email: justice_analysts@gov.scot