Improving Our Understanding of Seabird Behaviour at Sea

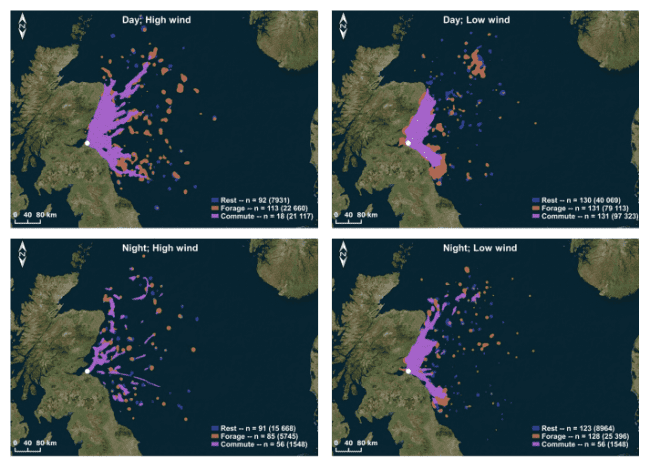
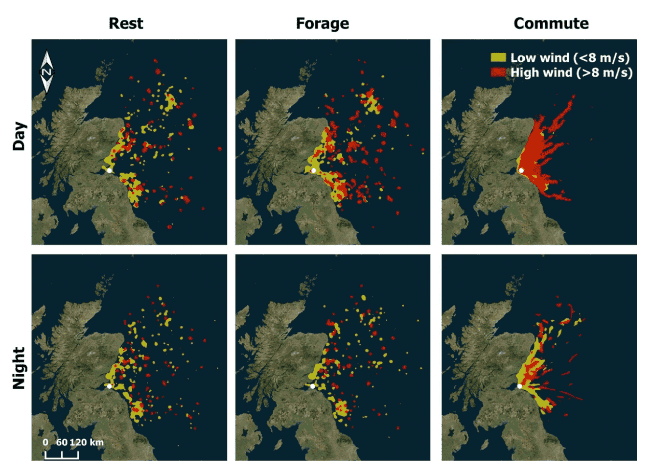
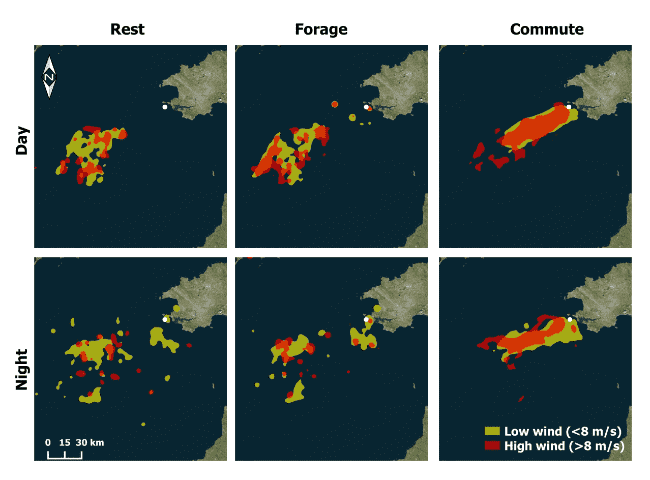
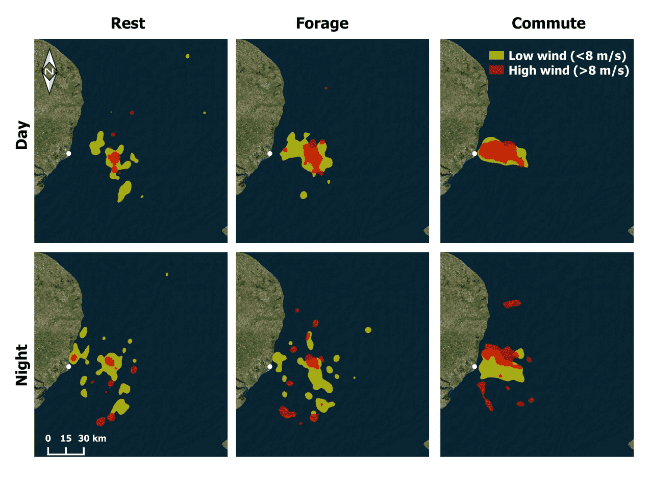
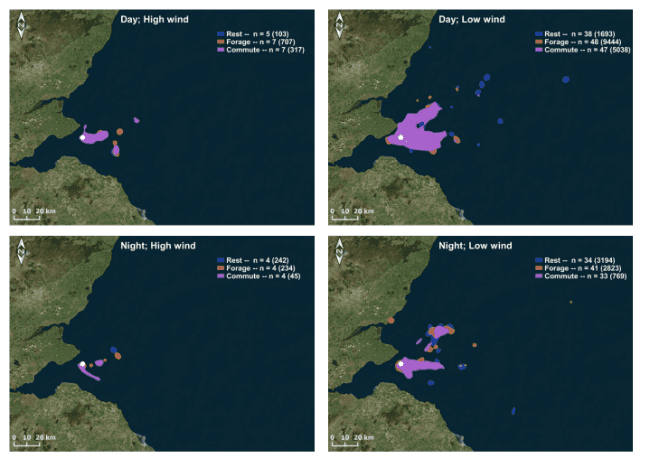
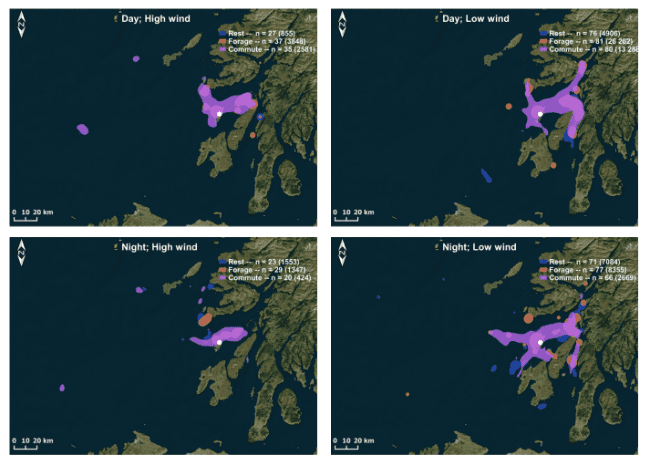
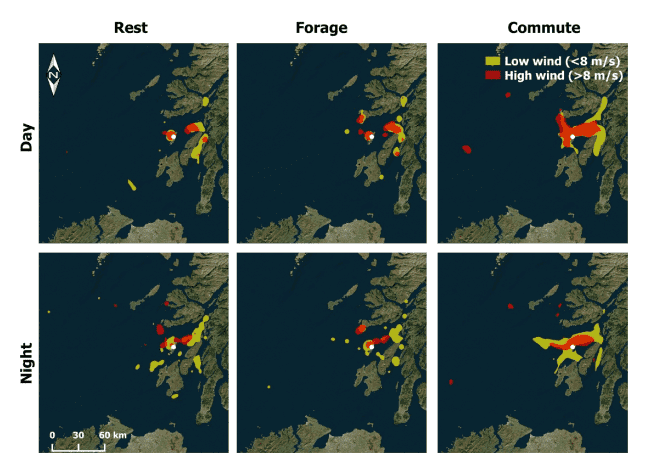
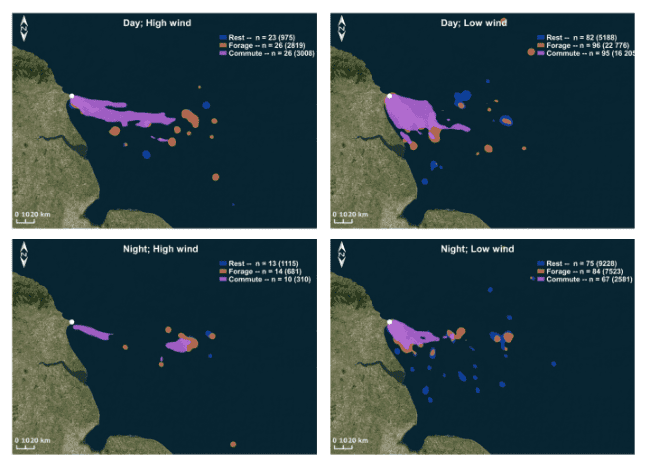
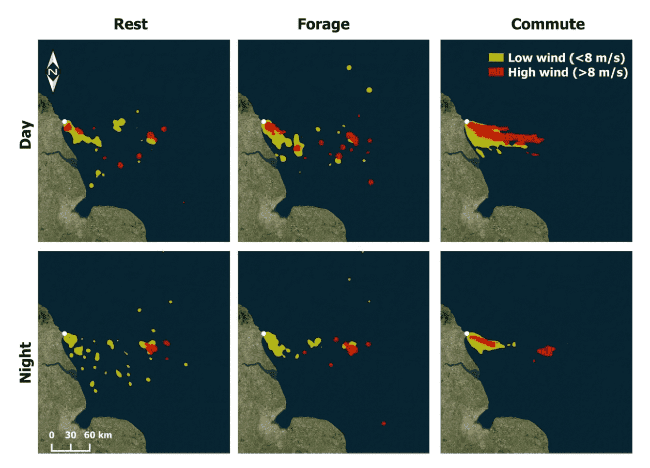
This project collated tracking data from five seabird species thought to be vulnerable to offshore wind farms. These data were analysed to understand whether seabird distribution data, usually undertaken in daytime, good weather conditions, were representative of behaviour in other conditions.

This document is part of a collection


7.9 Appendix AI: Overlap Indices

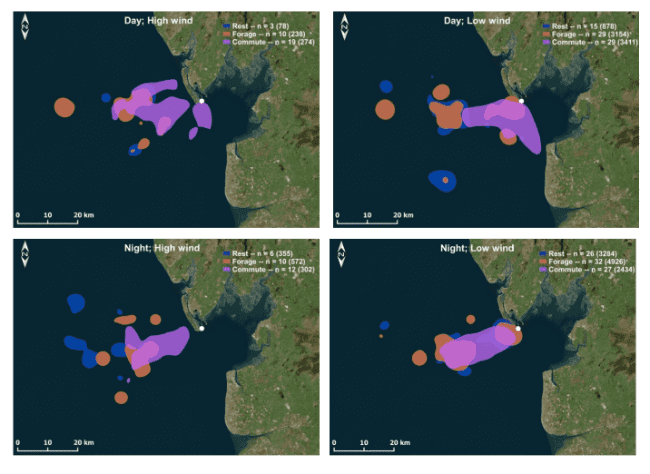
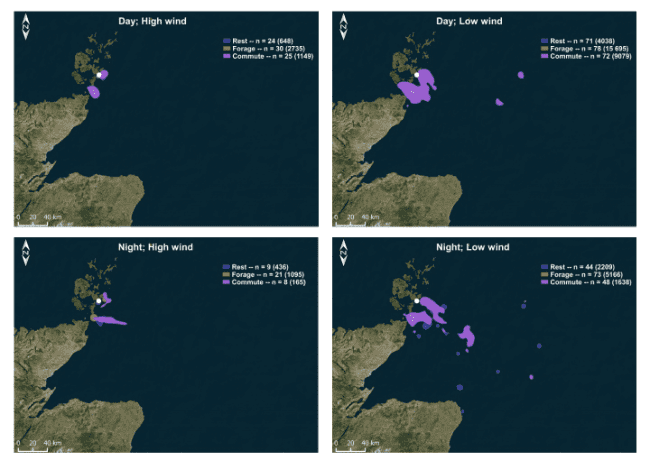
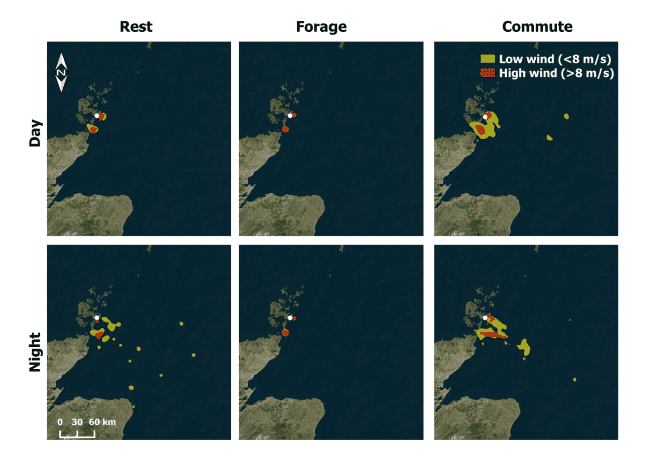
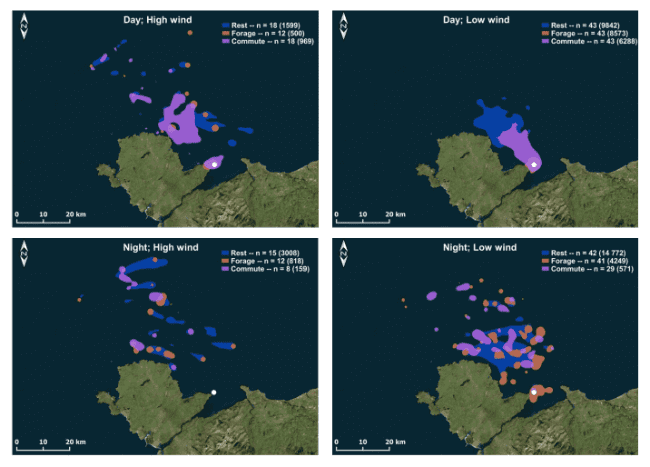
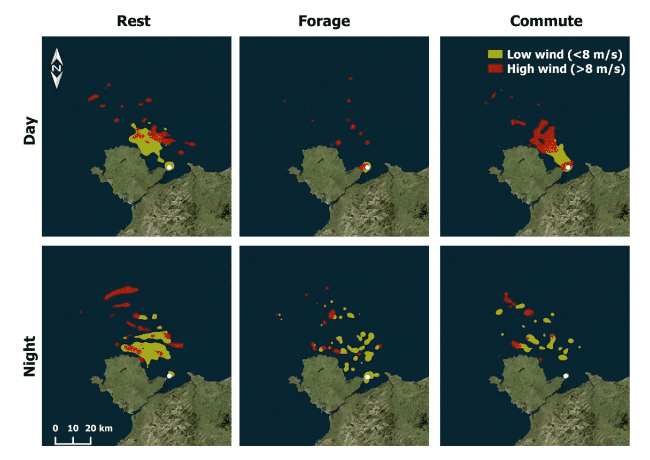
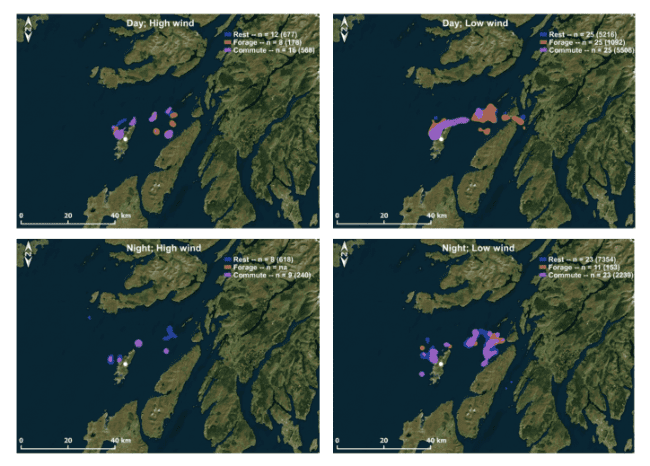
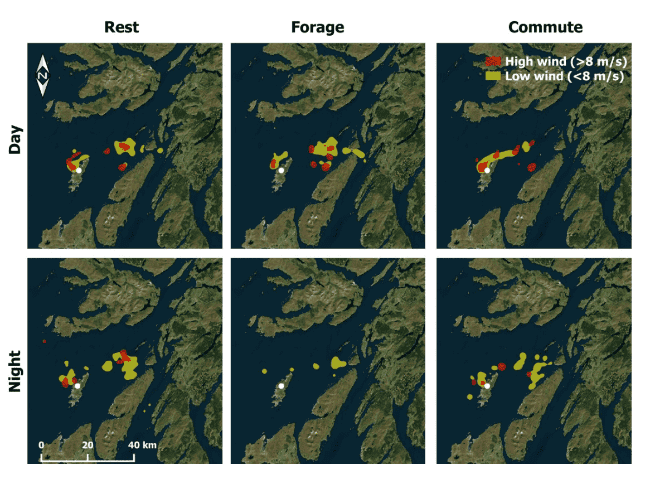
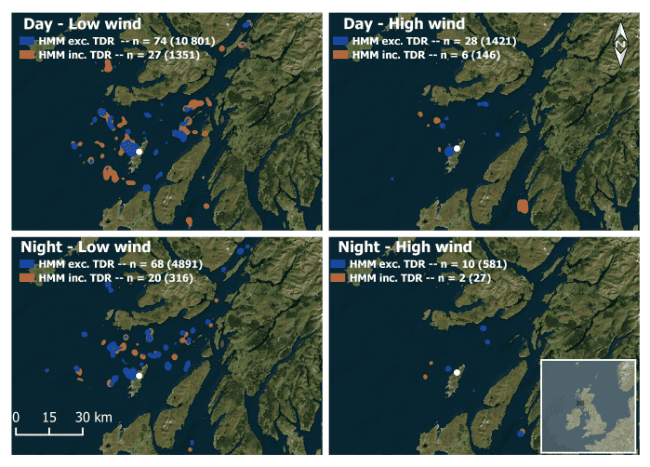
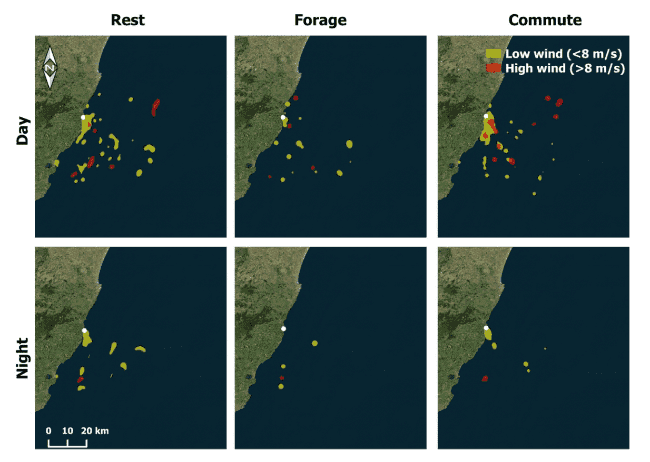
7.9.1 Northern Gannet

Figure A111: For Gannet, visualisations of overlaps of 50% KDEs between states for across delineations of day and night (sunrise and sunset) and wind speed (threshold of 8 m/s) at Alderney.
described in body of report
Figure A112: For Gannet, visualisations of overlaps of 50% KDEs between states for across delineations of day and night (sunrise and sunset) and wind speed (threshold of 8 m/s) at Bass Rock.
described in body of report
Figure A113: For Gannet, visualisations of overlaps of 50% KDEs between delineations of day and night (sunrise and sunset) and wind speed (threshold of 8 m/s) for different individual states at Alderney.
described in body of report
Figure A114: For Gannet, visualisations of overlaps of 50% KDEs between delineations of day and night (sunrise and sunset) and wind speed (threshold of 8 m/s) for different individual states at Bass Rock.
described in body of report

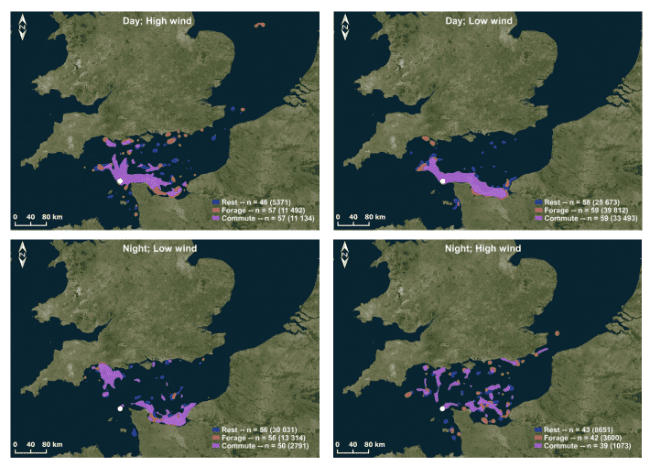
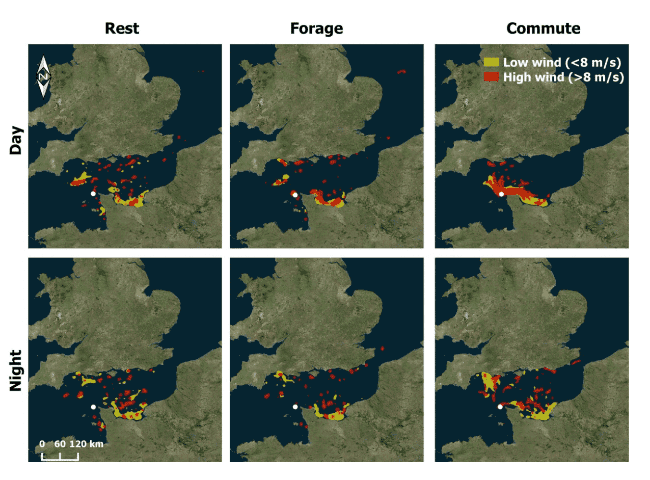
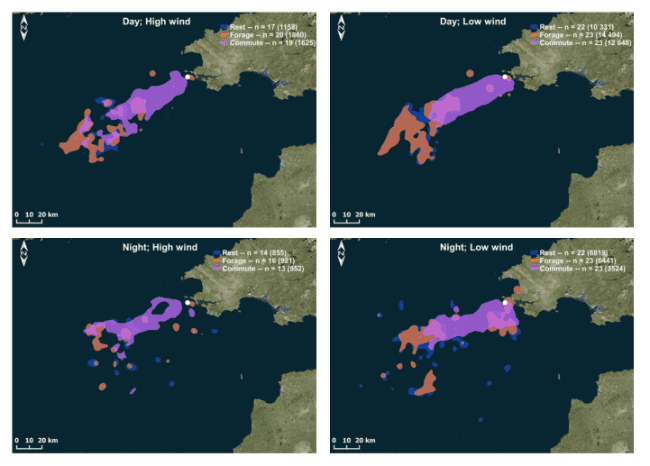
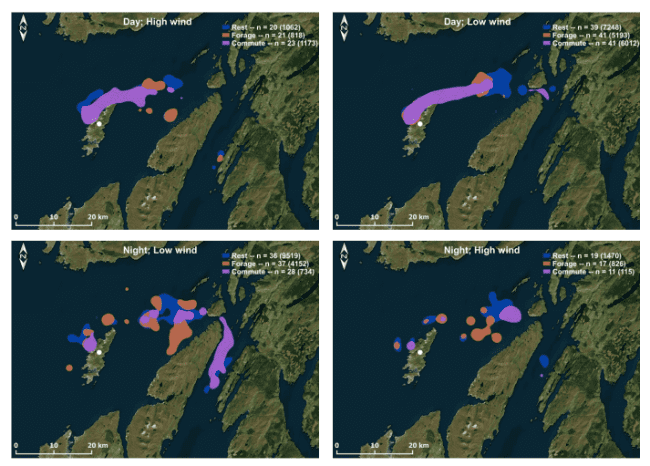
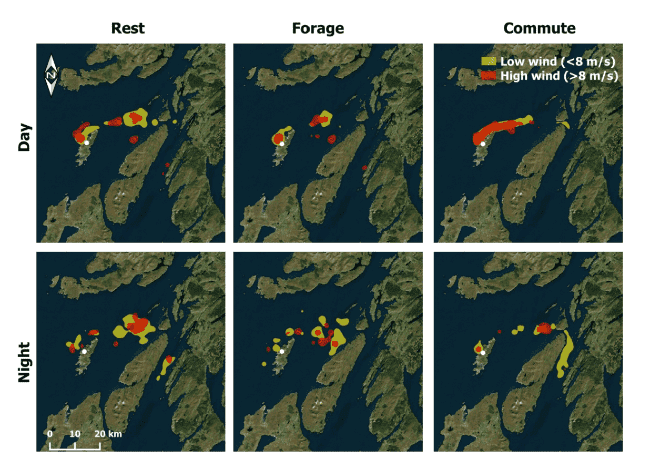
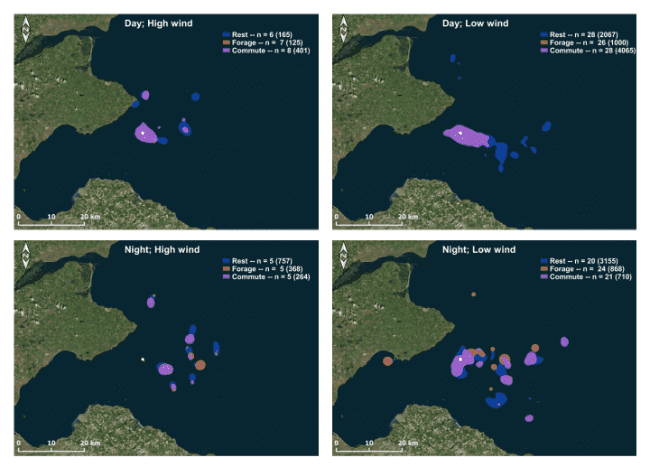
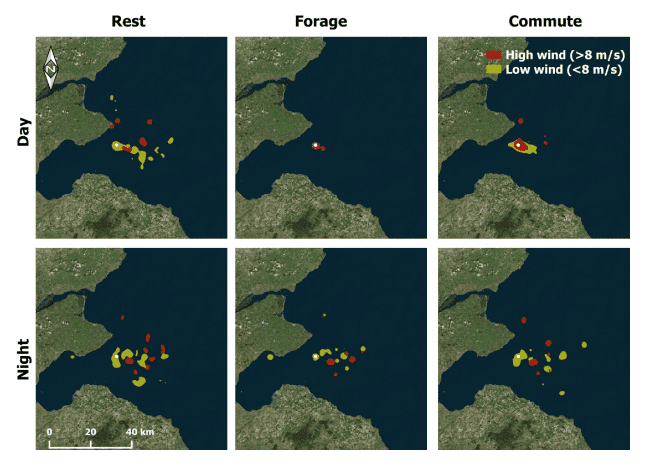
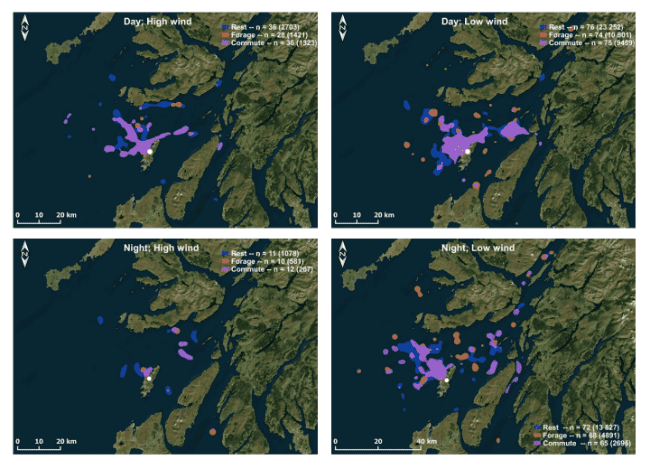
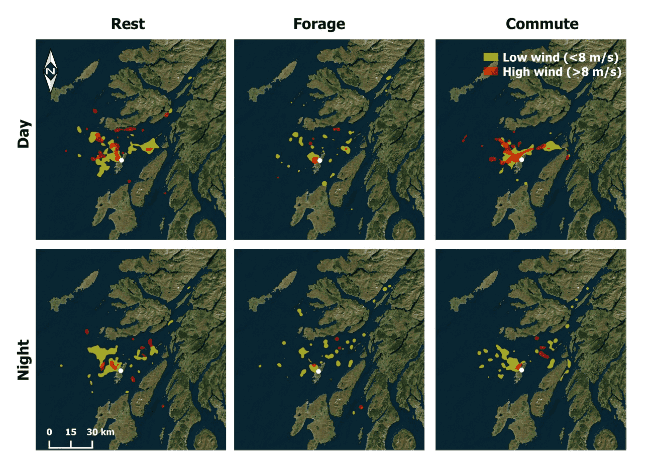
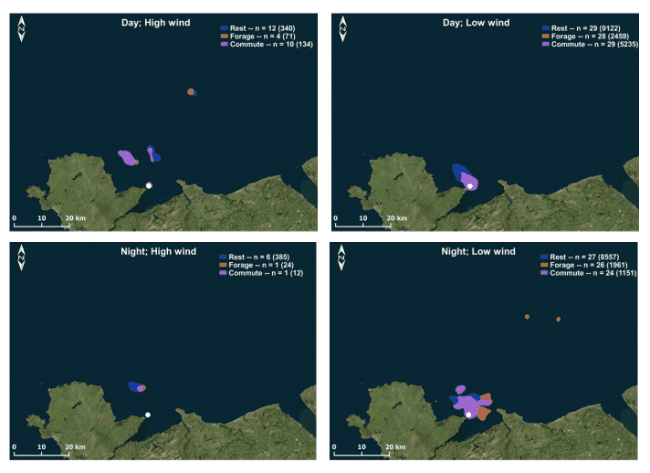
7.9.2 Lesser Black-backed Gull

Figure A115: For Lesser Black-backed Gull, visualisations of overlaps of 50% KDEs between states for across delineations of day and night (sunrise and sunset) and wind speed (threshold of 8 m/s) at Walney.
described in body of report
Figure A116: For Lesser Black-backed Gull, visualisations of overlaps of 50% KDEs between states for across delineations of day and night (sunrise and sunset) and wind speed (threshold of 8 m/s) at Skokholm.
described in body of report
Figure A117: For Lesser Black-backed Gull, visualisations of overlaps of 50% KDEs between states for across delineations of day and night (sunrise and sunset) and wind speed (threshold of 8 m/s) at Orford Ness note for the floating state for daytime high wind, less than 50 fixes were obtained, from only two birds, hence confidence in distribution comparisons is considered low.
described in body of report
Figure A118: For Lesser Black-backed Gull, visualisations of overlaps of 50% KDEs between delineations of day and night (sunrise and sunset) and wind speed (threshold of 8 m/s) for different individual states at Walney.
described in body of report
Figure A119: For Lesser Black-backed Gull, visualisations of overlaps of 50% KDEs between delineations of day and night (sunrise and sunset) and wind speed (threshold of 8 m/s) for different individual states at Skokholm.
described in body of report
Figure A120: For Lesser Black-backed Gull, visualisations of overlaps of 50% KDEs between delineations of day and night (sunrise and sunset) and wind speed (threshold of 8 m/s) for different individual states at Orford Ness.
described in body of report

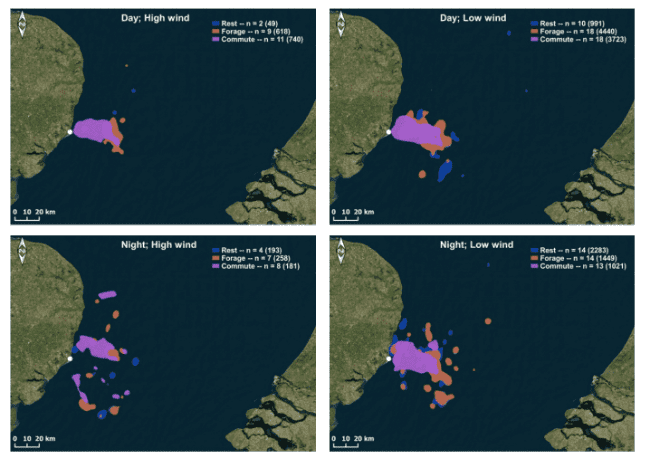
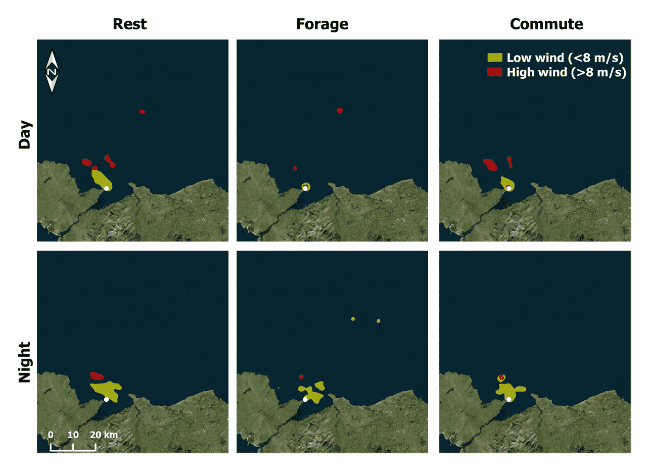
7.9.3 Black-legged Kittiwake
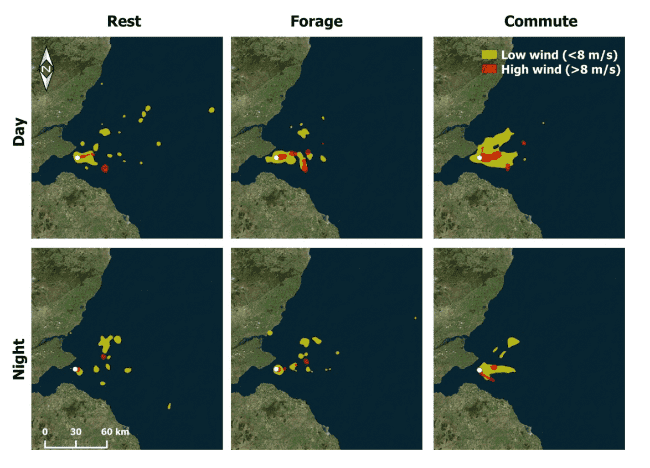
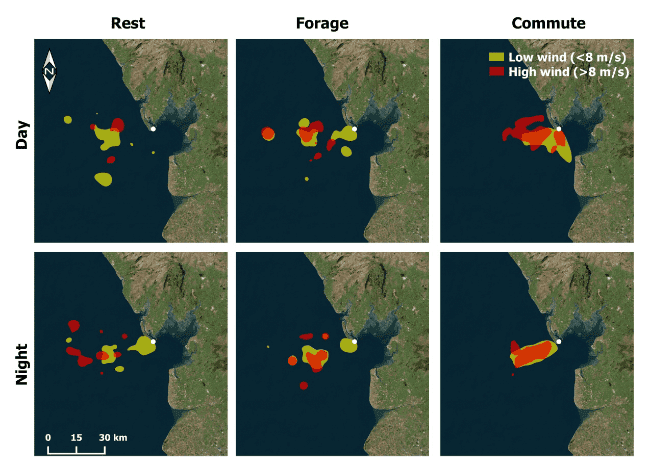
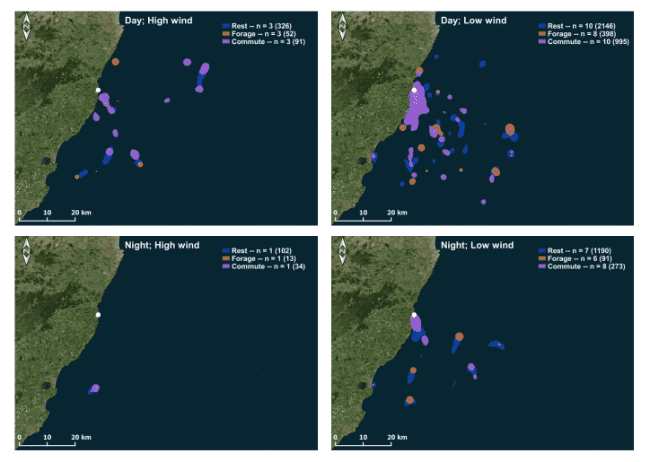
Figure A121: For Kittiwake, visualisations of overlaps of 50% KDEs between states for across delineations of day and night (sunrise and sunset) and wind speed (threshold of 8 m/s) at the Isle of May.
described in body of report
Figure A122: For Kittiwake, visualisations of overlaps of 50% KDEs between delineations of day and night (sunrise and sunset) and wind speed (threshold of 8 m/s) for different individual states at the Isle of May.
described in body of report
Figure A123: For Kittiwake, visualisations of overlaps of 50% KDEs between states for across delineations of day and night (sunrise and sunset) and wind speed (threshold of 8 m/s) at Colonsay.
described in body of report
Figure A124: For Kittiwake, visualisations of overlaps of 50% KDEs between delineations of day and night (sunrise and sunset) and wind speed (threshold of 8 m/s) for different individual states at Colonsay.
described in body of report
Figure A125: For Kittiwake, visualisations of overlaps of 50% KDEs between states for across delineations of day and night (sunrise and sunset) and wind speed (threshold of 8 m/s) at Bempton Clilffs.
described in body of report
Figure A126: For Kittiwake, visualisations of overlaps of 50% KDEs between delineations of day and night (sunrise and sunset) and wind speed (threshold of 8 m/s) for different individual states at the Bempton Clilffs.
described in body of report
Figure A127: For Kittiwake, visualisations of overlaps of 50% KDEs between states for across delineations of day and night (sunrise and sunset) and wind speed (threshold of 8 m/s) at Orkney.
described in body of report
Figure A128: For Kittiwake, visualisations of overlaps of 50% KDEs between delineations of day and night (sunrise and sunset) and wind speed (threshold of 8 m/s) for different individual states at Orkney.
described in body of report

7.9.4 Razorbill

Figure A129: For Razorbill, visualisations of overlaps of 50% KDEs between states for across delineations of day and night (sunrise and sunset) and wind speed (threshold of 8 m/s) at Colonsay.
described in body of report
Figure A130: For Razorbill, visualisations of overlaps of 50% KDEs between delineations of day and night (sunrise and sunset) and wind speed (threshold of 8 m/s) for different individual states at Colonsay.
described in body of report
Figure A131: For Razorbill, visualisations of overlaps of 50% KDEs between states for across delineations of day and night (sunrise and sunset) and wind speed (threshold of 8 m/s) at Puffin Island.
described in body of report
Figure A132: For Razorbill, visualisations of overlaps of 50% KDEs between delineations of day and night (sunrise and sunset) and wind speed (threshold of 8 m/s) for different individual states at Puffin Island.
described in body of report
Figure A133: For Razorbill, visualisations of overlaps of 50% KDEs between states for across delineations of day and night (sunrise and sunset) and wind speed (threshold of 8 m/s) at Isle of May.
described in body of report
Figure A134: For Razorbill, visualisations of overlaps of 50% KDEs between delineations of day and night (sunrise and sunset) and wind speed (threshold of 8 m/s) for different individual states at Isle of May.
described in body of report
Figure A135: For Razorbill, visualisations of overlaps of 50% KDEs between states for across delineations of day and night (sunrise and sunset) and wind speed (threshold of 8 m/s) at Colonsay, based on HMMs using TDR data.
described in body of report
Figure A136: For Razorbill, visualisations of overlaps of 50% KDEs between delineations of day and night (sunrise and sunset) and wind speed (threshold of 8 m/s) for different individual states at Colonsay, based on HMMs using TDR data.
described in body of report

7.9.5 Common Guillemot

Figure A137: For Guillemot, visualisations of overlaps of 50% KDEs between states for across delineations of day and night (sunrise and sunset) and wind speed (threshold of 8 m/s) at the Colonsay.
described in body of report
Figure A138: For Guillemot, visualisations of overlaps of 50% KDEs between delineations of day and night (sunrise and sunset) and wind speed (threshold of 8 m/s) for different individual states at the Colonsay.
described in body of report
Figure A139: For Guillemot, visualisations of overlaps of 50% KDEs between models incorporating TDR and excluding TDR data, delineated by day and night (sunrise and sunset) and wind speed (threshold of 8 m/s) for the state of foraging/searching (State 3) at Colonsay.
described in body of report
Figure A140: For Guillemot, visualisations of overlaps of 50% KDEs between states for across delineations of day and night (sunrise and sunset) and wind speed (threshold of 8 m/s) at Puffin Island.
described in body of report
Figure A141: For Guillemot, visualisations of overlaps of 50% KDEs between delineations of day and night (sunrise and sunset) and wind speed (threshold of 8 m/s) for different individual states at Puffin Island.
described in body of report
Figure A142: For Guillemot, visualisations of overlaps of 50% KDEs between states for across delineations of day and night (sunrise and sunset) and wind speed (threshold of 8 m/s) at Fowlsheugh.
described in body of report
Figure A143: For Guillemot, visualisations of overlaps of 50% KDEs between delineations of day and night (sunrise and sunset) and wind speed (threshold of 8 m/s) for different individual states at the Fowlsheugh.
described in body of report
Figure A144: For Guillemot, visualisations of overlaps of 50% KDEs between models incorporating TDR and excluding TDR data, delineated by day and night (sunrise and sunset) and wind speed (threshold of 8 m/s) for the state of foraging/searching (State 3) at Fowlsheugh.
described in body of report
Figure A145: For Guillemot, visualisations of overlaps of 50% KDEs between states for across delineations of day and night (sunrise and sunset) and wind speed (threshold of 8 m/s) at Isle of May.
described in body of report
Figure A146: For Guillemot, visualisations of overlaps of 50% KDEs between delineations of day and night (sunrise and sunset) and wind speed (threshold of 8 m/s) for different individual states at the Isle of May.
described in body of report

Contact

Email: ScotMER@gov.scot

Back to top