Improving Our Understanding of Seabird Behaviour at Sea

This project collated tracking data from five seabird species thought to be vulnerable to offshore wind farms. These data were analysed to understand whether seabird distribution data, usually undertaken in daytime, good weather conditions, were representative of behaviour in other conditions.

This document is part of a collection


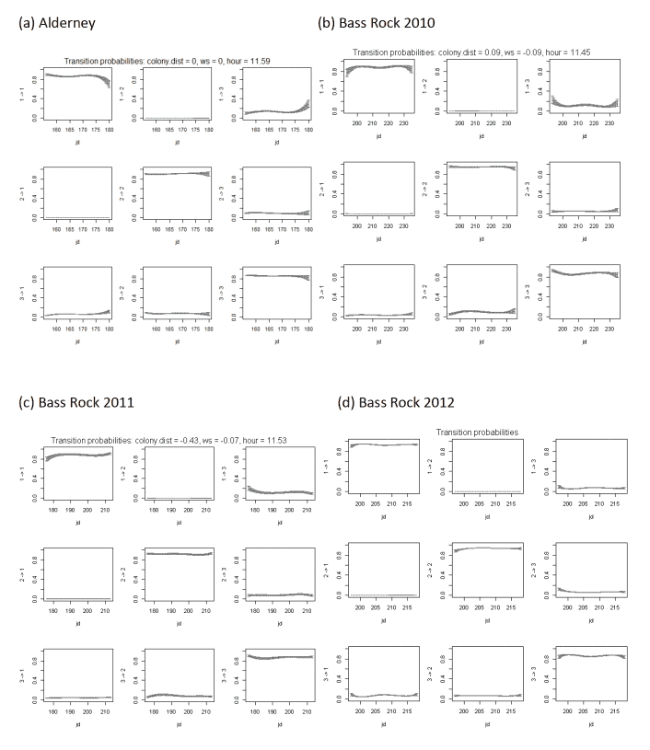
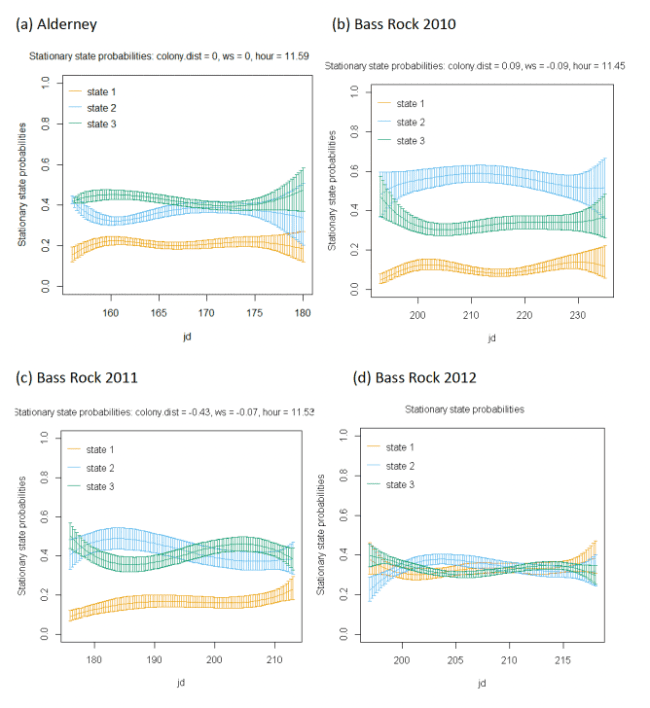
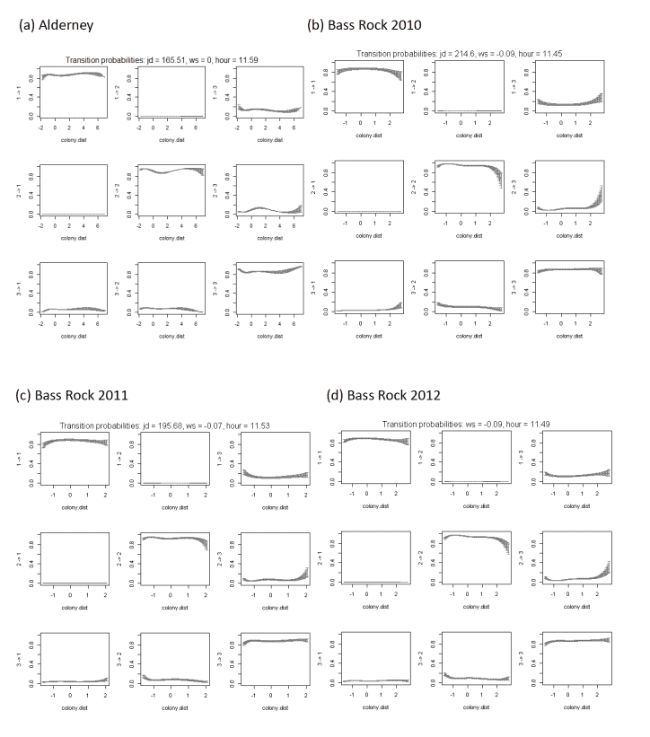
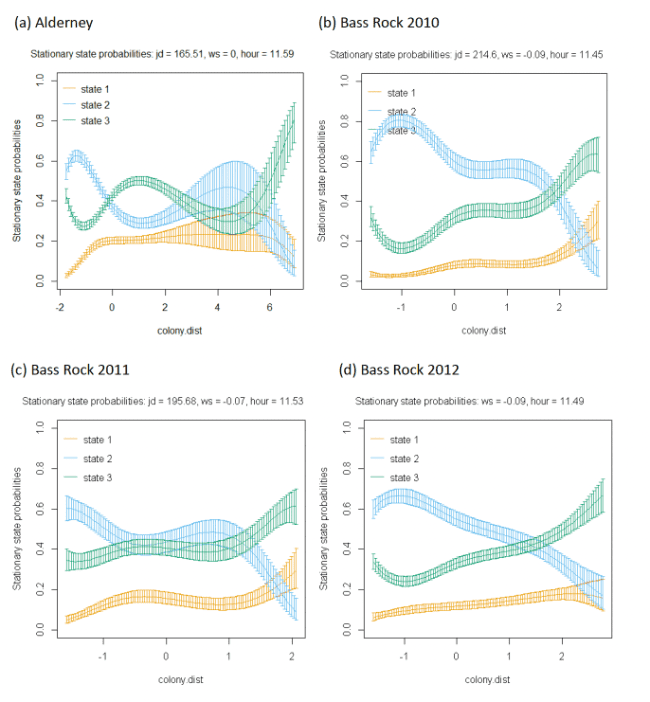
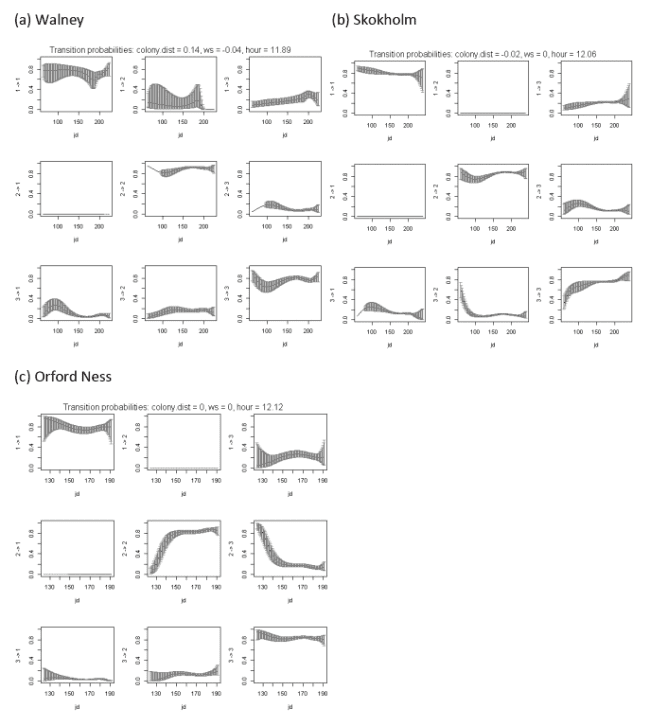
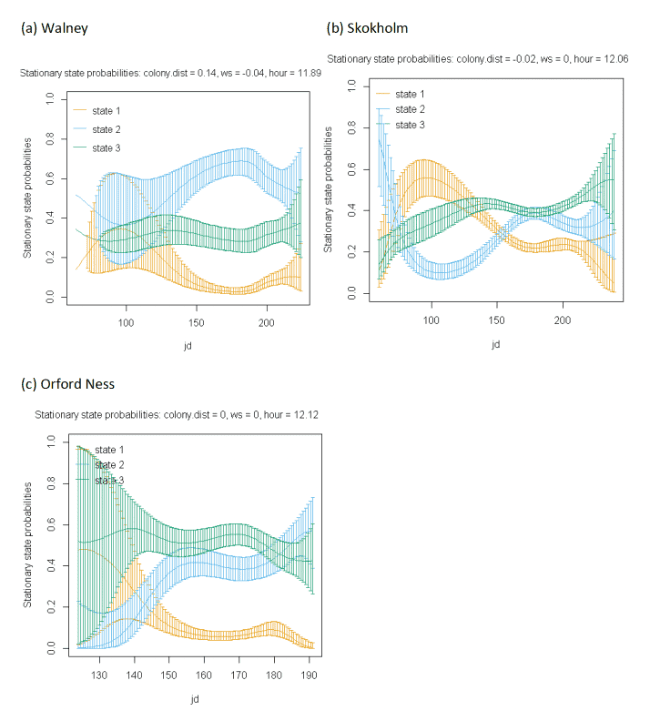
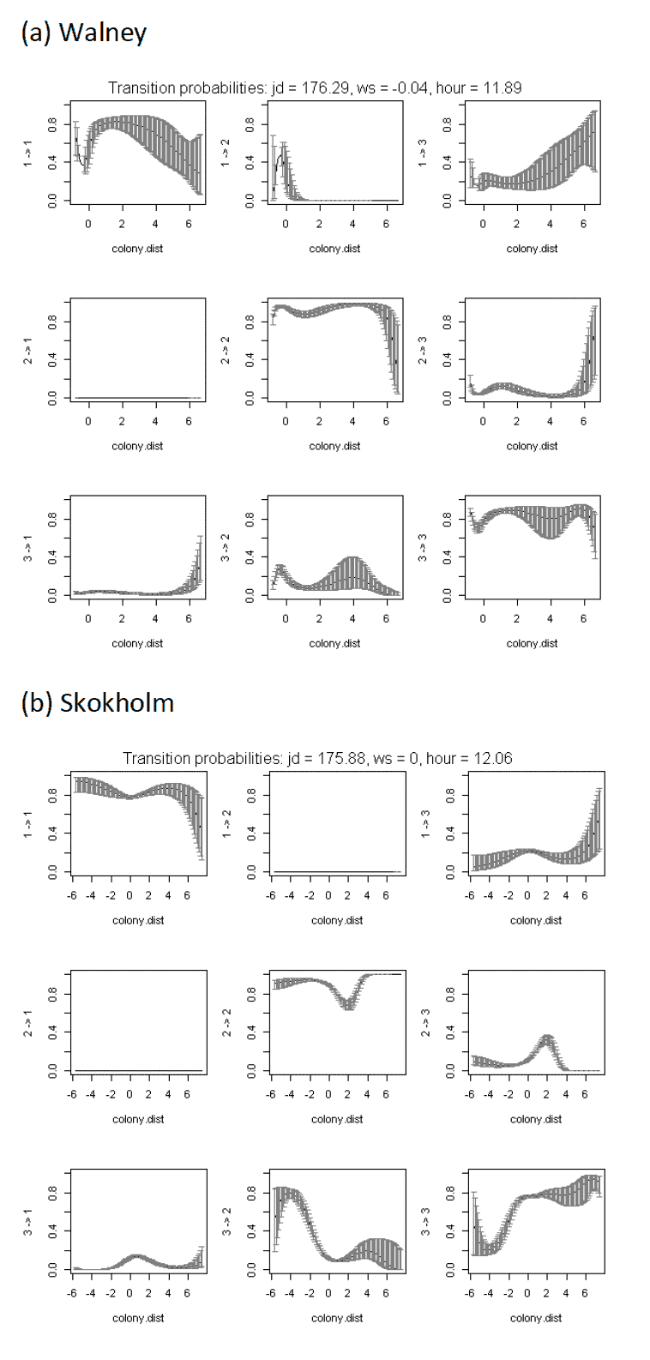
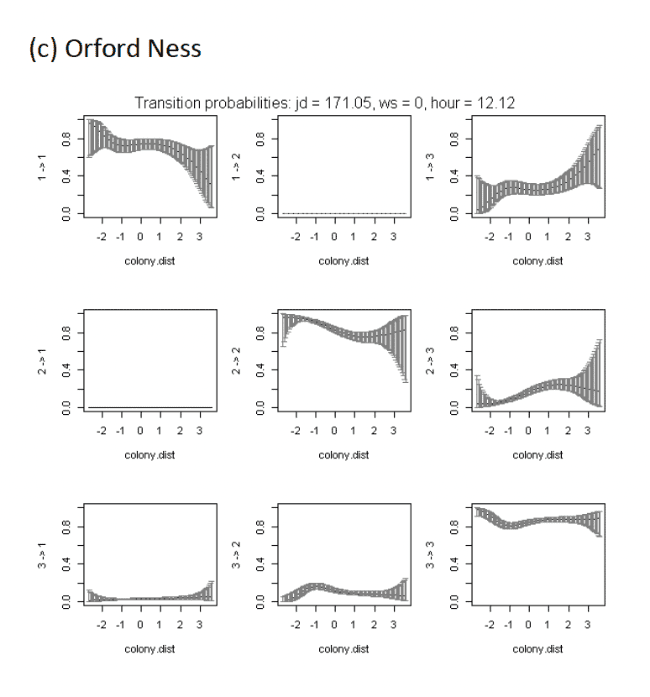
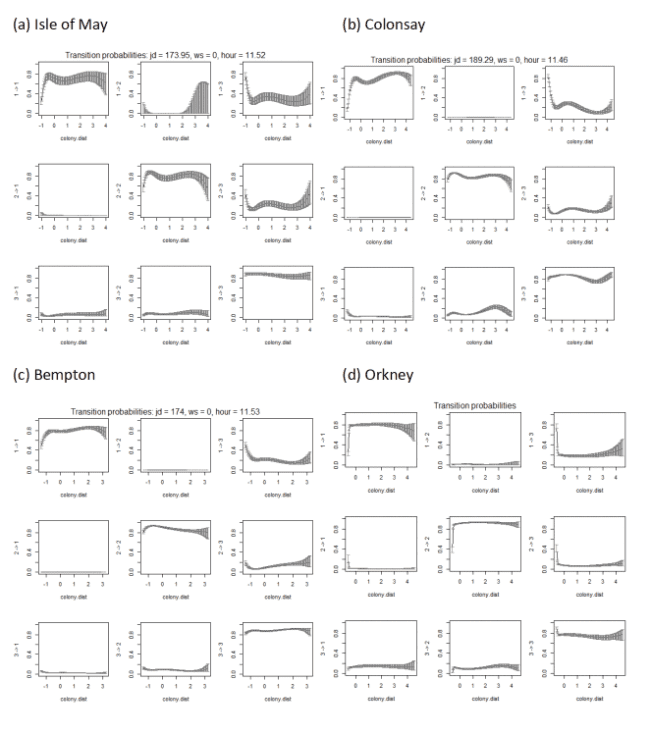
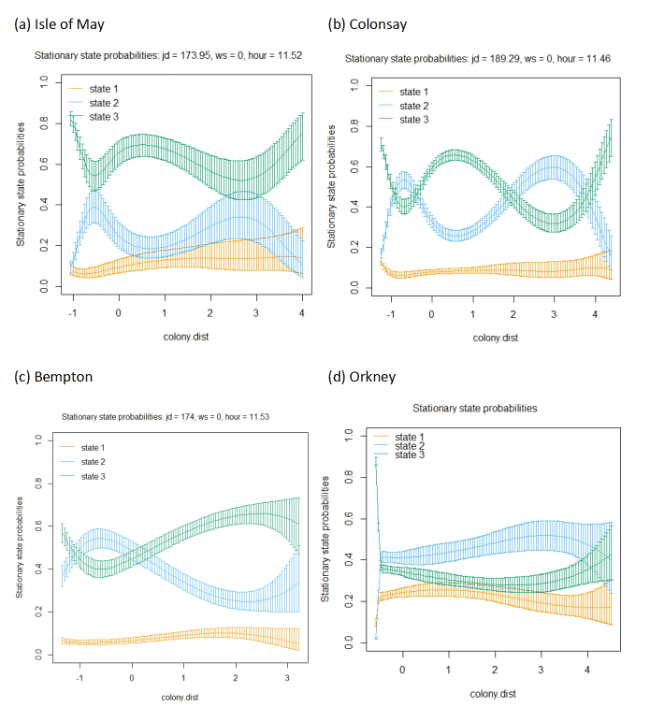
7.7 Appendix AG: Relationships between transition probability and additional variables of colony distance and Julian date

7.7.1 Northern Gannet

Figure A82: For Gannet, transition probabilities and stationary state probabilities for the variable of Julian date. Note, trends are plotted at the mean of other covariates. States: 1. floating, 2. commuting, 3. foraging/searching
described in body of report
Figure A83: For Gannet, stationary state probabilities for the variable of Julian date for states 1, 2 and 3 (floating, commuting and foraging/searching). Note, trends are plotted at the mean of other covariates.
described in body of report
Figure A84: For Gannet, transition probabilities and stationary state probabilities for the variable of colony distance. Note, trends are plotted at the mean of other covariates. States: 1. floating, 2. commuting, 3. foraging/searching.
described in body of report
Figure A85: For Gannet, stationary state probabilities and stationary state probabilities for the variable of colony distance for states 1, 2 and 3 (floating, commuting and foraging/searching). Note, trends are plotted at the mean of other covariates.
described in body of report

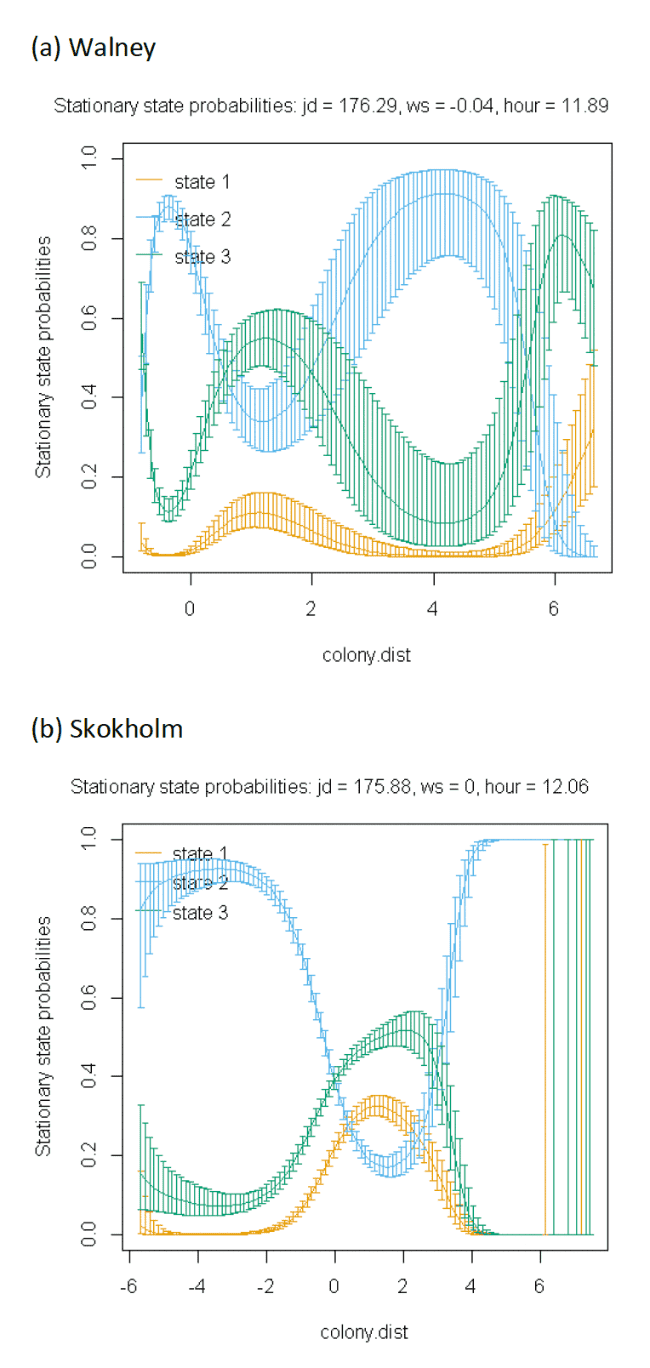
7.7.2 Lesser Black-backed Gull

Figure A86: For Lesser Black-backed Gull, transition probabilities and stationary state probabilities for the variable of Julian date. Note, trends are plotted at the mean of other covariates. States: 1. floating, 2. commuting, 3. foraging/searching.
described in body of report
Figure A87: For Lesser Black-backed Gull, stationary state probabilities for the variable of Julian date for states 1, 2 and 3 (floating, commuting and foraging/searching). Note, trends are plotted at the mean of other covariates.
described in body of report
Figure A88: For Lesser Black-backed Gull, transition probabilities for the variable of distance to colony, fitted as a standardised variable. Note, trends are plotted at the mean of other covariates.
described in body of report
Figure A89: For Lesser Black-backed Gull, stationary state probabilities for the variable of distance to colony, fitted as a standardised variable for states 1, 2 and 3 (floating, commuting and foraging/searching)
described in body of report

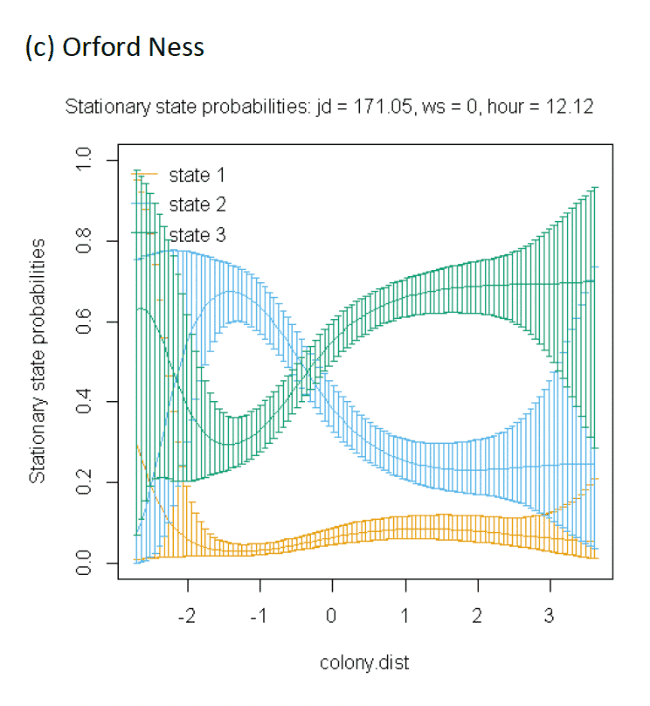
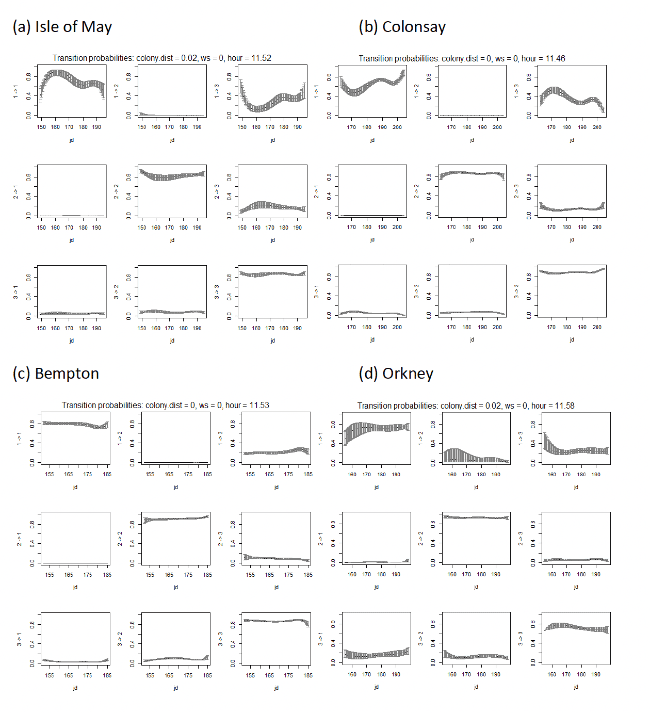
7.7.3 Black-legged Kittiwake

Figure A90: For kittiwake, transition probabilities and stationary state probabilities for the variable of Julian date. Note, trends are plotted at the mean of other covariates. States: 1. floating, 2. commuting, 3. foraging/searching.
described in body of report
Figure A91: For Kittiwake, stationary state probabilities for the variable of Julian date for states 1, 2 and 3 (floating, commuting and foraging/searching). Note, trends are plotted at the mean of other covariates.
described in body of report
Figure A92: For Kittiwake, transition probabilities for the variable of distance to colony, fitted as a standardised variable. Note, trends are plotted at the mean of other covariates.
described in body of report
Figure A93: For Kittiwake, stationary state probabilities for the variable of distance to colony, fitted as a standardised variable for states 1, 2 and 3 (floating, commuting and foraging/searching) Note, trends are plotted at the mean of other covariates.
described in body of report

Contact

Email: ScotMER@gov.scot

Back to top