Potentially hazardous agents in land-applied sewage sludge: human health risk assessment
This report on the risks to human health is part of the research project undertaken by the James Hutton Institute on the impacts on human health and environment arising from the spreading of sewage sludge to land (CR/2016/23).
3.5. Microplastics and fibres
3.5.1. Background
Microplastics are a heterogeneous mixture of differently shaped materials referred to as fragments, fibres, spheroids, granules, pellets, flakes or beads. There is no internationally recognised definition, with microplastics and related fibres most-commonly defined as synthetic polymers measuring less than 5 mm in diameter (i.e. largest dimension); while definitions vary, the majority do not include a lower size limit. They are derived from a wide range of sources including; synthetic fibres from clothing (Browne et al., 2011; Astrom, 2016), polymer manufacturing and processing industries (Lechner & Ramler, 2015) and personal care products (Fendall & Sewell, 2009). A distinction can be made between primary and secondary microplastics. Primary microplastics are plastics that were originally manufactured to be that size (for specific purposes e.g. use in cosmetic products) while secondary microplastics originate from fragmentation of larger items, e.g. plastic debris (Wright et al., 2013). Microplastics can arise from direct sources, such as industrial accident spillages or release of microbeads from cosmetics through wastewaters.
Fibres are examples of secondary microplastics. The majority of our clothing and textile goods contain synthetic textiles such as polyester, polylactide, olefin, spandex, nylon, lyocell, Lurex, Ingeo, acrylics, aramids, Tencel, acetate, rayon and polypropylene (Carr, 2017). These synthetic textile materials shed microfibres (threadlike residues which are invisible to the naked eye and are usually persistent being made of non-biodegradable materials), as they are worn, handled and exposed to the elements. Washing machines can produce secondary microplastics fibres that can enter into the environment through sewage wastewaters (Cauwenberghe et al., 2013). Given the volume of synthetic fibres manufactured and used throughout the world it is suspected that microfibre contamination of the environment is even higher than that of particulate plastics (Carr, 2017).
Microplastics and fibres have the potential to adsorb organic contaminants (Engler, 2012; Teuten et al., 2009) and [priority] metals (Brennecke et al., 2016; Rochman et al., 2014; Holmes et al., 2012; Nakashima et al., 2012; Ashton et al., 2010) from the surrounding environment. These may be released upon digestion by biota or through environmental degradation, leading to possible impacts to human health and ecosystems (Bouwmeester et al., 2015; Andrady, 2011; Cooper & Corcoran, 2010).
Over the last ten years, many studies have investigated the distribution and effects of microplastics and (to a lesser extent) fibres within the marine (e.g. Watts et al., 2016; Remy et al., 2015; Cole et al., 2013; von Moos et al., 2012) and freshwater (e.g. Horton, 2017) environments. It was estimated in 2014 that there were 250,000 tons of plastic particles afloat in the world's oceans (Eriksen et al., 2014). Microplastics have been found in Polar Regions (Lusher et al., 2014) and in a range of freshwater environments worldwide (Castañeda et al., 2014; Free et al., 2014; McCormick et al., 2014; Eriksen et al., 2013). Overall, the literature on plastic pollution in the marine environment is extensive and includes some very comprehensive reviews (e.g. Bosker et al., 2017; Duis & Coors, 2016; Eriksen et al., 2014). Despite this, very few studies have sought to determine land-based sources of microplastics and fibres. Therefore, in this assessment, we have attempted to draw inferences relevant to sewage sludge recycling from those reported in the vast aquatic literature.
Wastewater treatment plants (WWTPs) have been identified as receptors of microplastic pollution and are effective in capturing the majority of microplastics and fibres during the sludge settlement process (Carr et al., 2016). Almost 120,000 tonnes ds of sewage sludge were produced by waste water treatment plants in the UK (Eurostat, 2016). As approximately 99% of microplastics and fibres are retained in sewage sludge (Mahon et al., 2017; Magnusson & Norén, 2014), there is a strong possibility that land applied sludge, even having undergone treatment, could be a significant source of microplastics pollution. Estimates of the contribution of various sources of microplastics to the environmental pool have been derived. However, such estimates are subject to considerable uncertainty due to the complexity of the sources, the lack of quantitative data on transport and fate of microplastics, and the high geographic variability of the relevance of different sources and introduction routes (often caused by differences in sewerage infrastructure; Duis & Coors, 2016). A first estimate of the relative contribution of microplastics from personal care products to the plastic debris in the North Sea has been provided by Gourin et al. (2015) who assumed that 6 % of liquid skin cleansing products contained 10 % microplastics, equating to 2300 t yr-1 of microplastic particles derived from the countries in the watershed of the North Sea (UK, Norway, Denmark, Germany, Belgium, The Netherlands, France, Switzerland, and Czech Republic) via WWTPs. For the UK alone, the estimate was 680 t microplastic beads yr-1 (30 mg beads capita-1 day-1). As Gourin et al. (2015) assume a 90 % removal rate of microplastics during waste water treatment (likely to be closer to 99 % (Magnusson & Norén, 2014)); this suggests an annual loading in sewage sludge of 612 - 673 t microplastics from the UK (equates to roughly ~0.2 – 0.3 % of the global microplastics burden being generated by ~0.9% of the global population – remembering that this is just for microplastics from personal care products). Due to current EU and UK practice, it is highly likely that the majority of these microplastics will be spread to agricultural land.
3.5.2. Levels of microplastics in sewage sludge
The majority of microplastics literature has focussed on detection and quantification of plastic particles in the aquatic environment, with the literature pertaining to sources of microplastics being somewhat limited. A few studies have been undertaken during the last 5 years investigating levels of microplastics at different points in the waste water treatment process, and even fewer studies from countries of relevance to Scotland; these data are summarised in Figure 3‑15. One of the main limitations is that waste water composition, as well as associated treatment processes, is extremely variable and there is little way of knowing how representative the available data on microplastics are. Also, the available data do not cover the full range of treatment processes commonly used in Scotland. Therefore, while there is no doubt that microplastics are found in waste water, the quality of the available data mean that it is only possible to draw one or two firm inferences. The first one is the observation that levels of microplastics in any influent, effluent or biosolids are very variable. The second observation is that the presence of microplastics is most strongly associated with solid fractions. The majority of microplastics within waste water are retained in the biosolids (Leslie et al., 2017; Mahon et al., 2017; Carr et al., 2016), but also in grit and grease (Carr et al., 2016; Murphey et al., 2016), as well as being associated with surface scums (Carr et al., 2016). Final effluent tends to have much reduced concentrations of microplastics (Leslie et al., 2017; Carr et al., 2016; Murphey et al., 2016). The inference therefore is that the main route of microplastics from waste water to the environment is through the recycling of sewage sludge [to land]. However, it is worth bearing in mind that all data have been reported in terms of concentration (numbers of individual microplastic particles or fibres per unit volume or per unit mass) rather than mass of plastics. The volumes of liquids and solids being handled by the treatment process will influence the total flux of plastics to the environment via effluent compared to sewage sludge.
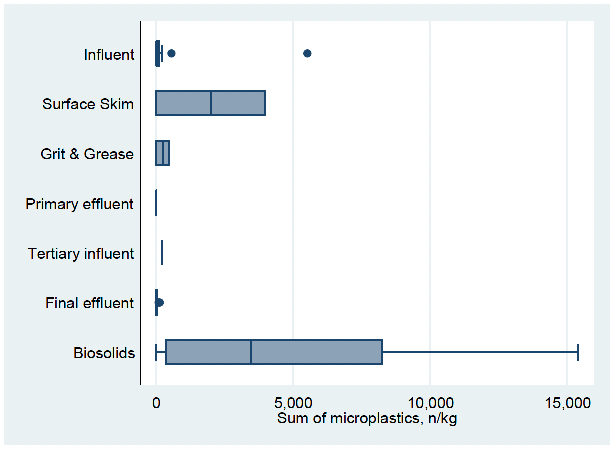
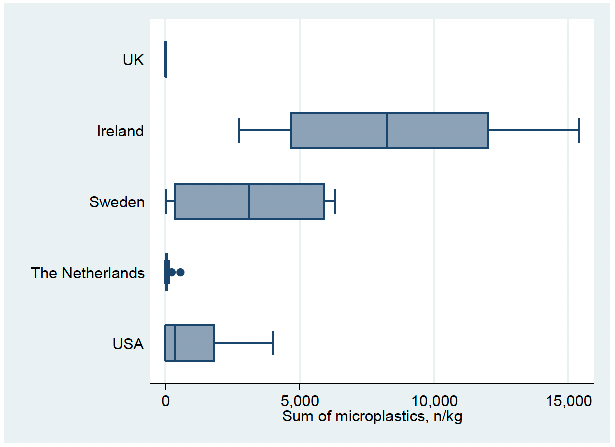
Grouping the available data for sewage sludge by country also suggests significant within- and between-country variation (Figure 3‑16). The available data suggest that the UK and The Netherlands have the lowest levels of micoplastics (in terms of numbers of particles/fibres per unit mass) associated with waste water treatment; however, there are so few studies in these two countries that these figures cannot support such a generalisation. The countries that display the widest variation, e.g. Ireland, are also those that have the largest numbers of studies published and simply reflect the sheer variation in waste water quality and treatment technologies employed within any one jurisdiction.
In terms of fibres, Habib et al. (1998) found elevated levels of synthetic fibres in harbour sediments close to a sewage treatment plant outfall in New York State and Talvitie et al. (2015) found that fibres (and microplastics) were present in the treated effluent from a WWTP in Finland. Similarly, Dris et al. (2015) found high levels of fibres in Parisian wastewater (260–320×103 particles m–3) but less in treated effluent (14–50×103 particles m–3). The partitioning of microplastics and fibres via settlement processes during wastewater treatments results in the majority becoming entrained in the sewage sludge (Talvitie et al., 2015, Mahon et al., 2017). Verschoor et al. (2014) reported that 90% of microplastics were removed during wastewater treatment. Similarly, Leslie et al. (2017) reported that the mean microplastic retention efficiency in the sludge for Dutch WWTPs was 72%, but this varied widely (standard deviation 61%). However, in there is very little published information on typical levels of fibres in sewage sludge applied to agricultural land.
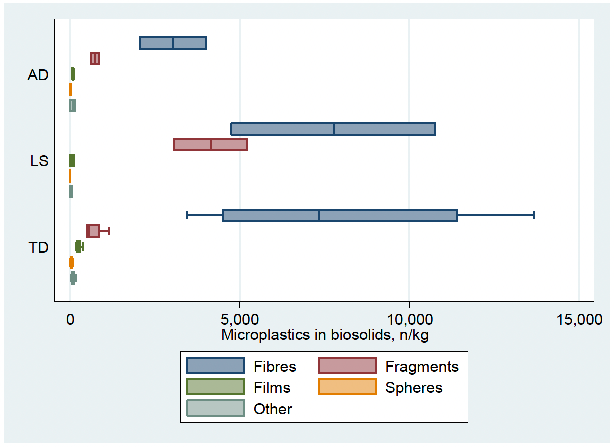
One study, Mahon et al. (2017), investigated the effect of treatment processes (anaerobic digestion (AD), lime stabilisation (LS), thermal drying (TD)) on concentrations of microplastics in sewage sludge. While it may seem biased to place so much emphasis on this single study, it should be noted that this is the only study of its type currently available that has investigated the implications of water treatment processes on levels of microplastics in sewage sludge. Mahon et al. suggested that AD might reduce concentration of microplastics, and more importantly reduce the concentrations of the smaller size fractions of microplastics that have been most strongly associated with adverse outcomes in toxicological studies (see Section 3.6.3); Figure 3‑17. It is noteworthy that fibres were the most commonly measured microplastic (in terms of count of numbers of plastic particles per unit mass) in this study. As with all of the microplastic studies discussed in this section, these data have been reported as concentrations. If the same data were expressed as fluxes of plastic, the inferences drawn from the study might well be different.
3.5.3. Impacts/Toxicology of microplastics
Impacts of microplastics tend to be categorised either as:
- Direct physical impact (i.e. the ability of a small particle to block ducts or damage tissues, see e.g. Wright et al., 2013);
- Direct chemical impact (i.e. degradation of plastic particles resulting in the release of potentially toxic chemicals, see Fries et al., 2013);
- Indirect chemical impacts (i.e. potentially toxic chemicals become adsorbed onto microplastic particles that are then transported along with the microplastic before being released under different chemical conditions such as those found inside an animal's stomach, see Koelmans et al., 2016).
Adsorbed chemical pollutants are either derived from additives used during the polymer synthesis process, or adsorbed directly from the environment (Engler, 2012; Teuten, et al., 2009; Rios, et al., 2007). The hydrophobicity of organic xenobiotics and the large surface area of plastic polymers facilitate the adsorption of these chemicals on microplastics at concentrations orders of magnitude higher than those detected in the surrounding environment (Ogata et al., 2009). The possibility for plastic particles to adsorb chemical pollutants from the surrounding environment has also been explored under laboratory conditions. Different particles polymers, like polyvinyl chloride, polyethylene, polypropylene and polystyrene, were shown to have high sorption capacity for dichlorodiphenyltrichloroethanes (DDTs), polycyclic aromatic hydrocarbons (PAHs), hexachlorocyclohexanes and chlorinated benzenes (Lee et al., 2014; Bakir et al., 2012). Consistent with these studies, several persistent organic pollutants (POPs), polychlorinated biphenyls (PCBs), organohalogenated pesticides, nonylphenol, PAHs and dioxins have been detected in plastic pellets washed up on different beaches around the world (Heskett et al., 2012; Hirai et al., 2011; Ogata et al., 2009; Endo et al., 2005).
With respect to sewage sludge, the inference must be that microplastics present in wastewater are able to adsorb and concentrate hydrophobic chemicals also present in waste water (such as those assessed in Section 3.4). These pollutants would then likely be delivered to agricultural land when sewage sludge is applied. Similarly, there is therefore potential for microplastics present in agricultural soils to adsorb and concentrate hydrophobic chemicals present in this environment such as various agri-chemicals.
Microplastic uptake has been reported in a wide range of animals including mammals and invertebrates (Cole et al., 2015; Cole et al., 2013; Lee et al., 2013; Von Moos et al., 2012; Wegner et al., 2012; Browne et al., 2008). Specifically, microplastic uptake has been investigated in plankton (Cole et al., 2015; Cole et al., 2013; Lee et al., 2013), the blue mussel (Von Moos et al., 2012; Wegner et al., 2012; Browne et al., 2008) and the lugworm (Besseling et al., 2013). In laboratory conditions, microplastics have been shown to be ingested (among others) by amphipods, barnacles, and lugworms (Thompson et al., 2004). However, the fate of microplastics after ingestion is still largely unknown. For instance, it remains an outstanding question whether ingested microplastics can translocate into other organs via the circulatory system. However, the accumulation of ingested microplastics in various organs has been reported. For example, in mussels plastic particles (3.0 – 9.6 m) were shown to have accumulated in digestive tissues and translocated to the haemolymph (Browne et al., 2008). In the same organisms, the uptake of microplastics caused notable histological changes in digestive cells with string inflammatory responses, formation of granulocytomas and lysosomal destabilisation which increased with exposure time (Von Moos et al., 2012). It has been shown that microplastics exhibit reasonably strong size-dependent toxicity (e.g. Jeong et al., 2016). Therefore, it is likely that any impacts associated with microplastics will be heightened as particle size decreases. Thus potential toxicity of microplastic particles could be treated in a similar way to airborne dusts (with current air quality standards based around particle size).
With respect to the transfer of microplastics up the [human] food-chain, there is some evidence related to the food industry. However, the focus is on consumption of fish and seafood (although honey and beer have also been looked at) and the assumption has been made (in the absence of other data) that these are the primary sources of microplastics in the [human] food-chain. This seems naïve, given what we know about sewage sludge being a significant source of microplastics.
There is a lack of information on the fate of microplastics in the [human] GI tract. The available data on toxicokinetics only include absorption and distribution, whereas no information is available on metabolism and excretion. This is primarily because microparticles have been investigated for their drug delivery potential, rather than from an exposure or toxicological perspective. Only microplastics smaller than 150 m may translocate across the gut epithelium causing systemic exposure (reported in Hussain et al., 2001). The absorption of these microplastics is expected to be limited (≤ 0.3%; Carr et al., 2012). Only the smallest fraction (size < 1.5 m) may penetrate deeply into organs (Yoo et al., 2011). There is a lack of knowledge about the local effects of microplastics in the GI tract, including microbiota. Toxicological data on the effects of microplastics as such are essentially lacking for human risk assessment (EFSA, 2016).
No studies have been identified that address the potential human health effects of microplastics ingested by humans through the food chain. In an investigation of the effects of coarse bran on small bowel transit time in adults, microplastic beads (barium-labelled polyethylene (PE)) were used as a control. A single dose of 15 g PE in rice pudding hastened the arrival of the label at the colon to the same degree as course bran (McIntyre et al., 1997). Although this is a pronounced effect, the dose is highly unrealistic in terms of human exposure through the food chain (EFSA, 2016).
While there are potentially serious impacts associated with exposure to microplastics, there is currently no knowledge regarding exposure to microplastics incorporated into sewage sludge and applied to agricultural land. The focus of research has been almost exclusively on the marine environment, but there is no knowledge regarding the proportion of the marine microplastic burden that can be attributed to sewage sludge. Similarly there is no information regarding the potential uptake of microplastics by food crops or grazing animals, hence limited inferences can be made regarding potential uptake of plastics from land-applied sewage sludge and into the human foodchain.
3.5.4. Risk assessment
Due to the limited quantitative information available on microplastics in the terrestrial environment, the risk assessment was attempted using the Bayesian network approach (Section 2.2.1).
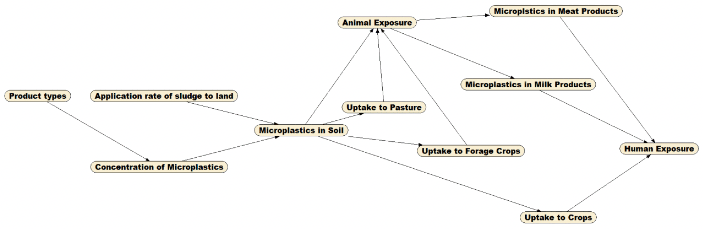
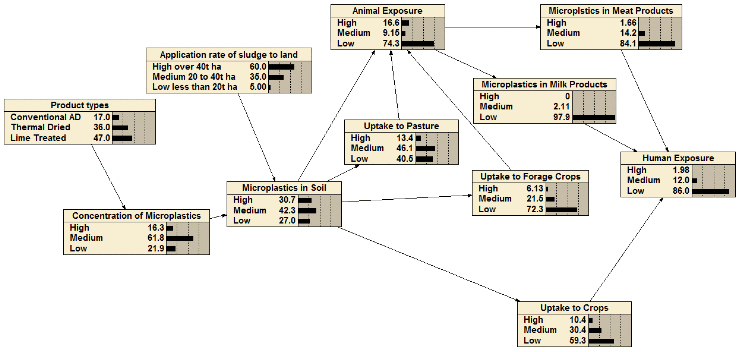
The BBN model described here was developed using Netica™ version 3.25 by Norsys Systems Corp. In line with the guidance from Marcot et al (2006), the development of a BBN for this paper started with the creation of a conceptual model of the relationships (influence) diagram using data on sewage sludge production and application, information from studies linking exposure to microplastics and (primarily toxicological) outcomes, as well as expert knowledge and experience of sludge handling (Figure 3‑18). The final outcome node is Human exposure [to microplastics and fibres].
The diagram represents key drivers (in nodes) of human exposure to microplastics and fibres due to sewage sludge application in Scotland. In the next phase each factor (node) was allocated values. In accordance with the considerable uncertainty in the data, all values were discretised into a number of categories or states. The number of states per node was kept to a minimum, and where possible Boolean values were adopted.
Model structure
The model structure (Figure 3‑18) was broadly based around three main drivers of microplatic exposure; namely consumption of crops (this includes leafy vegetables, root vegetables, and cereals grown in soil amended with sewage sludge), consumption of milk products (milk, cheese, etc. sourced from cattle grazed on land amended with sewage sludge or cattle fed fodder crops grown on land amended with sewage sludge), and consumption of meat products (e.g. beef, lamb, pork etc. sourced from animals grazed on land amended with sewage sludge or animals fed fodder crops grown on land amended with sewage sludge). These groupings are based on a synthesis of the available literature and there is either implicit or explicit evidence that they contribute to exposure to microplastics either in isolation or more often in combination.
Parameter learning
The current model (Figure 3‑17) consists of 11 nodes and 14 links. The outcome node, Human Exposure, considers the process by which a particular receptor, given various dietary combinations and sources of food products, may become exposed to microplastics. The relationships between the different nodes are represented in conditional probability tables (CPTs). Parameter learning determines the prior CPT of each node of the network, given the link structures and available data. A CPT P(A|B1…Bn) was attached to each variable A with parents B1…Bn. If A had no parents (e.g. Product types in Figure 3‑18), the table was reduced to unconditional probabilities i.e. P(A). To illustrate, the prior unconditional probabilities for Product types was P(Product types), while the prior conditional probabilities for Microplastics in soil was P(Microplastics in soil | Application rate of sludge to land, Concentration of microplastics). Prior conditional probabilities were calculated by applying Bayes rule:
P(Microplastics in soil, Application rate of sludge to land, Concentration of microplastics)
= P(Microplastics in soil | Application rate of sludge to land, Concentration of microplastics)
* P(Application rate of sludge to land, Concentration of microplastics)
(Equation 3‑2)
Prior unconditional probabilities were built using both 'expert' knowledge and actual observations. The ultimate objective is that all nodes are populated with empirical evidence. However, given the limitations of the information available, in the early stages of development the BBN was populated using a combination of expert knowledge and empirical evidence. With BBN's ability to learn from new data, the model developed through an iterative process which improved our understanding and knowledge. Table 3‑11 provides a list of all nodes and the information sources used to populate the prior CPTs. The aim was to develop prior probabilities that reflected the national (Scotland) situation; for example, looking at the Product type node, the prior distribution reflects the probability that any sewage sludge product available in Scotland is e.g. lime treated. The finalised BBN, complete with prior distributions is depicted in Figure 3‑19.
| Node | Description | Information type/source |
|---|---|---|
| Product types | Probability of a sewage sludge product used in Scotland to be of a specific type (Conventional AD: Thermal drying: Lime Treated) | Based on sludge production figures obtained from Scottish Water |
| Concentration of microplastics | Probability that concentration of microplastics in sewage sludge product is high (>10000 n kg-1); medium (>5000 <10000 n kg-1); low (<5000 n kg-1) | Derived from Mahon et al. (2017); See Figure 3‑17 |
| Application rate of sludge to land | Application rate in t fw ha-1 (>40 t ha-1: >20<40 t ha-1 : <20 t ha-1) | Based on application rates used in WRAP (2016c) and Hough et al. (2012) which were themselves based on expert judgement |
| Microplastics in soil | Probability that the concentration in soil post-application will be high (>120 n kg-1); medium (>60 <120 n kg-1); low (<60 n kg-1). | Algorithm based on combination of concentration of microplastics, application rate and soil plough depth (i.e. volume) as used in WRAP (2016c) |
| Uptake to pasture | Probability that concentration of microplastics within the grass sward (not necessarily internalised) will be high; medium; low | Expert judgement assuming sewage sludge applied to surface of pasture. |
| Uptake to forage crops | Probability that concentration of microplastics within forage crops (not necessarily internalised) will be high; medium; low | Expert judgement assuming sewage sludge applied to soil surface prior to sowing |
| Uptake to crops | Probability that concentration of microplastics within crops for human consumption (not necessarily internalised) will be high; medium; low | Expert judgement assuming sewage sludge applied to soil surface prior to sowing |
| Microplastics in meat products | Probability that concentration of microplastics in meat products will be high; medium; low | Expert judgement informed by exotoxicology literature including Hussain et al. (2001); Carr et al. (2012); Yoo et al. (2011) |
| Microplastics in milk products | Probability that concentration of microplastics in milk products will be high; medium; low | Microplastics measured in milk have only been attributed to shearing from bottles etc. |
| Human exposure | Probability that human exposure to microplastics is high; medium; low | Algorithm combining probabilities of microplastics in the three exposure media |
Structural learning
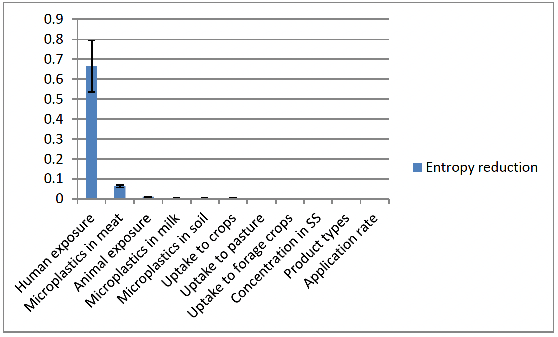
Sensitivity to findings analysis was performed to determine which variables had most influence on the outcome node, Human exposure. This was determined by calculating an entropy reduction value (ERV). The higher the value of ERV, the stronger a node affects another. Estimates of ERV, and the associated variance of beliefs, were calculated for Human exposure and then for the influence of each node in turn on Human exposure (Figure 3‑20). It is noteworthy that all of the variables where operators have significant control have minimal influence on Human exposure, suggesting that changing product type or application rate will have little influence on levels of exposure to microplastics experienced by the local population. Levels of microplastics in meat products play the most significant role in the outcome of Human exposure. This reflects the fact that microplastics contained in meat products tend to be <1.5 m (Yoo et al., 2011) which is the size fraction that can penetrate into the deep organs. Thus intake of microplastics in meat products is likely to pose the greatest risk to human health compared to the other exposure media included in this model.
Scenario testing – Forward inference
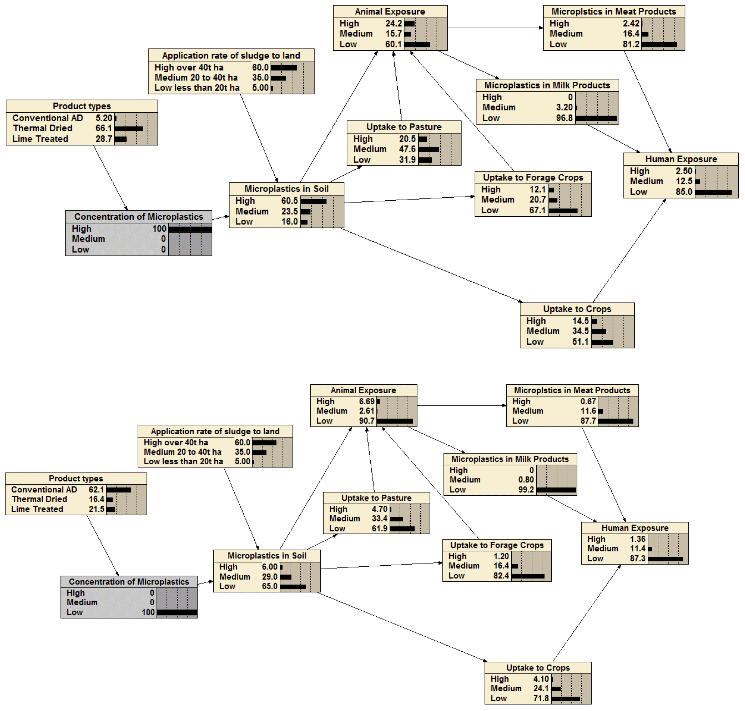
The BBN model can be used to test a variety of scenarios by forward inference. Here each node is set to its highest or lowest state to understand the impact of each factor on the risk of individuals being exposed to microplastics. Figure 3‑21 shows, by way of illustration, a scenario where concentrations of microplastics in sewage sludge products are very high. Comparing the distribution of Human exposure with Figure 3‑19 you can see a 0.52% increase in the probability that individuals will experience high levels of exposure to microplastics. The sensitivity to findings analysis (Figure 3‑20) was used to structure a number of different scenarios, which were explored in turn (Table 3‑12).
| Node | Scenario | ΔP[Human exposure(High)] |
|---|---|---|
| Microplastics in meat | P(High) = 100% | +14.92% |
| P(Low) = 100% | -1.89% | |
| Animal exposure | P(High) = 100% | +3.66% |
| P(Low) = 100% | -0.90% | |
| Microplastics in milk products | P(Medium) = 100% | +7.50% |
| P(Low) = 100% | -0.16% | |
| Microplastics in milk products; | P(Medium) = 100% | +15.01% |
| P(High) = 100% | ||
| Microplastics in meat | P(Low) = 100% | +15.01% |
| P(High) = 100% | ||
| Microplastics in soil | P(High) = 100% | +1.22% |
| P(Low) = 100% | -0.94% | |
| Microplastics in soil; | P(High) = 100% | +16.02% |
| P(High) = 100% | ||
| Microplastics in meat | P(Low) = 100% | +10.02% |
| P(High) = 100% | ||
| Uptake to crops | P(High) = 100% | +2.46% |
| P(Low) = 100% | -0.51% | |
| Uptake to crops; | P(High) = 100% | +28.02% |
| P(High) = 100% | ||
| Microplastics in meat | P(Low) = 100% | +8.02% |
| P(High) = 100% | ||
| Uptake to pasture | P(High) = 100% | +1.41% |
| P(Low) = 100% | -0.64% | |
| Uptake to pasture; | P(High) = 100% | +15.22% |
| P(High) = 100% | ||
| Microplastics in meat | P(Low) = 100% | +15.72% |
| P(High) = 100% | ||
| Uptake to forage crops | P(High) = 100% | +1.47% |
| P(Low) = 100% | -0.18% | |
| Uptake to forage crops; | P(High) = 100% | +16.02% |
| P(High) = 100% | ||
| Microplastics in meat | P(Low) = 100% | +14.82% |
| P(High) = 100% | ||
| Concentration of microplastics | P(High) = 100% | +0.52% |
| P(Low) = 100% | -0.62% | |
| Concentration of microplastics; | P(High) = 100% | +15.62% |
| P(High) = 100% | ||
| Microplastics in meat | P(Low) = 100% | +13.62% |
| P(High) = 100% | ||
| Product types | P(Conventional) = 100% | -0.46% |
| P(Lime treated) = 100% | +0.06% | |
| Product types; | P(Conventional) = 100% | +14.22% |
| P(High) = 100% | ||
| Microplastics in meat | P(Lime treated) = 100% | +14.82% |
| P(High) = 100% | ||
| Application rate of sludge | P(High over 40 t Ha) = 100% | +0.15% |
| P(Low less than 20 t Ha) = 100% | -0.62% | |
| Application rate of sludge; | P(High over 40 t Ha) = 100% | +15.12% |
| P(high) = 100% | ||
| Microplastics in meat | P(Low less than 20 t Ha) = 100% | +14.12 |
| P(High) = 100% |
The forward inference scenario analysis concurs with the sensitivity to findings analysis, highlighting the pivotal role that Microplastics in meat has with respect to Human exposure to microplastics. The greatest risk of exposure to microplastics occurs where uptake of microplastics to crops is high combined with high levels of microplastics in meat products. The model suggests that very little can be done, from a management perspective, to mitigate against these exposures.
Any inferences drawn using this model should be treated with significant caution as a significant proportion of the CPTs within the model structure have been populated using judgement (essentially 6 out of the 11 nodes). Therefore, this model should be treated as a representation of the state of current knowledge based on the literature review undertaken as part of this assessment. The fact that the biggest drivers of risk are 'downstream' factors, suggests that the relationship between the presence of microplastics in sewage sludge, and final human exposure, is poorly understood.
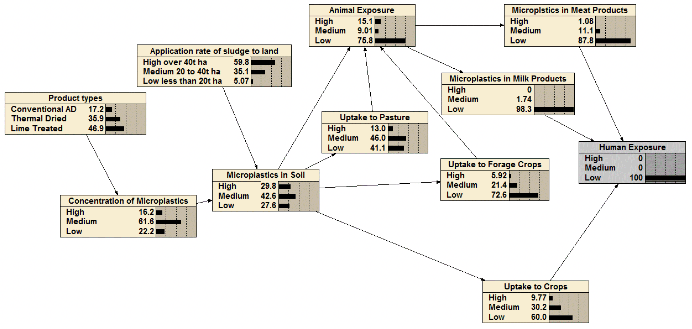
Scenario testing – backwards inference
To investigate the conditions required to achieve Human exposure P(Low) = 100%, a backwards inference was performed (Figure 3‑22). While the uncertainties in the model structure mean that any inferences should be treated with significant caution, the backwards inference does provide an indication of the steps that could be taken to reduce probability of exposure (given our current level of understanding of the system). In summary, these are:
- Reduce exposure of animals to microplastics – minimise use of sewage sludge on pasture, or incorporate it into the soil prior to pasture re-seeding
- Reduce sewage sludge application rates where practicable
Contact
Email: gary.gray@gov.scot