Potentially hazardous agents in land-applied sewage sludge: human health risk assessment
This report on the risks to human health is part of the research project undertaken by the James Hutton Institute on the impacts on human health and environment arising from the spreading of sewage sludge to land (CR/2016/23).
3.1. Malodour
3.1.1. Background
Odours remain the biggest cause of complaints in regard to environmental issues for a wide variety of industries, including wastewater and waste management, and sewage sludge application to land, and continues to grow in both number and severity of complaints (Intarakosit, 2010; Adams et al., 2003; Harrison & Oakes, 2002; Gostelow et al., 2001; van Harreveld, 2001; Shusterman, 1999). These concerns seem to be multi-dimensional, in that it is not only the detected odour that determines the impact of a malodourous exposure on a community, but cognitive appraisal, community interests, as well as several other factors play a role in shaping the effects of arduous odour. These factors may elucidate why intolerance for malodour seems to be increasing (Sucker et al., 2008a & b). In addition, the understanding of these factors may also explain why, despite significant investment in odour reduction and abatement, governing bodies have had difficulty in establishing fair and effective regulations that address community needs (Nicell, 2009; Rappert & Muller, 2005). Cervinka & Neudorfer (2004) found that canal air harbouring sewage odours caused a high degree of complaints even when those odours were drastically reduced in intensity. One of the many cited explanations for this increased complaint factor was the increased sensitivity to environmental stressors experienced by the community in the region; clearly, meeting community expectations requires a dynamic and multi-faceted understanding beyond that of an odour concentration-response paradigm (Hayes et al., 2014). This is at odds with traditional risk assessment approaches (as described in Section 2) used in this study and widely to address environmental issues.
3.1.2. Health effects
One major property of the sense of smell is to warn an individual about potential health hazards; to that end, odour often implies danger; this in turn usually leads to more health complaints from those who perceive the odour (Moffatt & Pless-Mulloli, 2003; Köster, 2002; Luginaah et al., 2002; Elliott et al. 1999). Several investigations have found that, if present, odour elicits the largest number of complaints from a community who perceive a location or activity to be "dangerous" far more than any other description (Jenkins et al., 2007; Adams et al., 2003; Harrison & Oaks, 2002; Luginaah et al., 2002). Perception of odour was found to be the most significant risk factor for multiple health effects in people residing close to hazardous waste sites in California (Neutra et al., 1991). Interestingly, even a "dummy" question relating to toothache (for which odour exposure should have no influence on even as a stressor) had higher incidence rates for people who detected odours. This was suggested to indicate an odour-worry paradigm that might explain the association between odour and health (Neutra et al., 1991).
The health effects of odours themselves may be related to their cognitive appraisal, but assessing risk is still mired in difficulties. To begin with, there are multiple competing hypotheses as to the pathophysiological reasons behind odours causing health effects, ranging from innate odour preferences, to stress-induced illness, to mass psychological hysteria (Shusterman, 2001; 1999; Schiffman et al., 2000). It has also been suggested that perceived health effects are among the most important factors when individuals consider registering a complaint (Kolarova, 1999). An additional and difficult delineation is between odour and olfactory irritation, a separate factor that affects an individual's trigeminal nerve (Schiffman et al., 2000). Regardless, odour exposure causes increased rates of reported health effects, even when the odour contains no agents at or above toxic levels (Schiffman & Williams, 2005; Winneke, 2004a & b; Shustermann, 1999). To this end, governments have responded by setting limits of odour production from various sources and activities stating that concentrations far below toxic levels must not be breached (Hayes et al., 2014).
Despite these challenges with establishing causality, a few dose-response relationships have been published that try to relate measured or modelled concentrations of odorants with (primarily) self-reported health effects (e.g. Blanes-Vidal et al., 2014; Aatamila et al., 2011, 2010). Of note is the study of Blanes-Vidal et al. (2014) as being one of the few, possibly the only, studies that provides a quantitative estimation of the dose-response relationships between exposure to odorants and psychosocial effects caused by odour in a non-urban setting; hence analogous to sewage sludge spreading. The study also shows that the health effects are not only direct but are also mediated by other psychosocial responses. After controlling for person-specific covariates, about 45% of participants were annoyed by the odour pollution. Exposures were associated with annoyance (adjusted odds ratio [ORadj] = 3.54, 95% confidence interval [CI] = 2.33 – 5.39), health risk perception (ORadj = 4.94; 95% CI = 1.95 – 12.5) and behavioural interference (ORadj = 3.28; 95% CI = 1.77 – 6.11), for each unit increase in loge(NH3 exposure). Annoyance was a strong mediator in exposure-behaviour interference and exposure-health risk perception relationships (81% and 44% mediation, respectively). Health risk perception did not play a mediating role in exposure-annoyance or exposure-behavioural interference relationships. The dose-response relationships between NH3 exposure and annoyance presented by Blanes-Vidal et al. (2014) have been used in the risk modelling undertaken in this study (Section 3.1.4), with 'annoyance' considered the health outcome of interest.
3.1.3. Sources in sewage sludge
Many compounds have been identified in odours arising from sewage sludge treatment (Gostelow et al., 2001; Table 3‑1). Generally speaking, these compounds are reduced sulphur or nitrogen compounds, organic acids, aldehydes or ketones. More recently, Kotowska et al. (2012) detected over 170 volatile and potentially volatile compounds in municipal sewage sludge including a number considered detremental to human health. These included aliphatic and aromatic hydrocarbons, alcohols, esters, carbonyls, as well as sulphur, nitrogen, and chlorine containing compounds. The prevailing substances included: ethyl ether, n-hexane, p-xylene, o-xylene, mesitylene, m-ethylbenzene, limonene, n-decane, n-undecane, and n-dodecane. A few compounds such as methanetiol, dimethyl polisulfide, octaatomic sulphur, phthalic anhydride, and indoles were idenfied in sewage sludge for the very first time.
Sulphur compounds form the majority of odorants associated with sewage sludge and its treatment (Abbott, 1993; Bonin et al., 1990). Domestic sewage typically contains 3 – 6 mg L-1 organic sulphur, derived mainly from proteinaceous material, as well as sulphonates from household detergents (Boon, 1995). Inorganic sulphur, in the form of sulphate, is present in concentrations from 30 – 50 mg L-1 or considerably higher where industrial sources of waste water are treated (Boon, 1995; Cheremisinoff, 1988).
Hydrogen sulphide (H2S) is the predominant odorant associated with sewage and sewage sludge and the formation of H2S in sewers has been extensively studied, primarily because of its corrosive powers (e.g. Matos & Sousa, 1992; Halkjaer-Nielsen et al., 1998; Pomeroy & Parkhurst, 1977; Pomeroy, 1959). The formation of H2S arises from two sources: the reduction of sulphate and the desulphurisation of organic compounds containing sulphur in a reduced state (Harkness, 1980).
Nitrogen-containing odorants (primarily ammonia, amines, indole and scatole) can also be significant sources of odour. Nitrogen sources in sewage are urine, proteins, and amino acids. Amines in particular are produced from amino acids by the removal for the carboxyl (COOH) group (Harkness, 1980). Volatile fatty acids, aldehydes, alcohols and ketones are the by-products of carbohydrate fermentation and are generally associated with anaerobic treatment, and in particular with the treatment of sewage sludge (Bonnin et al., 1990).
| Class | Compound | Formula | Character |
|---|---|---|---|
| Sulphurous | Hydrogen sulphide | H2S | Rotten eggs |
| Dimethyl sulphide | (CH3)2S | Decayed vegetables | |
| Diethyl sulphide | (C2H5)2S | Nauseating, ether | |
| Diphenyl sulphide | (C6H5)2S | Burnt rubber | |
| Diallyl sulphide | (CH2CHCH2)2S | Garlic | |
| Carbon disulphide | CS2 | Decayed vegetables | |
| Dimethyl disulphide | (CH3)2S2 | Putrification | |
| Methyl mercaptan | CH3SH | Decayed cabbage | |
| Ethyl mercaptan | C2H5SH | Decayed cabbage | |
| Propyl mercaptan | C3H7SH | Unpleasant | |
| Butyl mercaptan | C4H9SH | Unpleasant | |
| tButyl mercaptan | (CH3)3CSH | Unpleasant | |
| Allyl mercaptan | CH2CHCH2SH | Garlic | |
| Crotyl mercaptan | CH3CHCHCH2SH | Skunk, rancid | |
| Benzyl mercaptan | C6H5CH2SH | Unpleasant | |
| Thiocresol | CH3C6H4SH | Skunk, rancid | |
| Thiophenol | C6H5SH | Putrid, nauseating | |
| Sulphur dioxide | SO2 | Sharp, pungent, irritating | |
| Nitrogenous | Ammonia | NH3 | Sharp, pungent |
| Methylamine | CH3NH2 | Fishy | |
| Dimethylamine | (CH3)2NH | Fishy | |
| Trimethylamine | (CH3)3N | Fishy, ammoniacal | |
| Ethylamine | C2H5NH2 | Ammoniacal | |
| Diethylamine | (C2H5)2NH2 | Decomposing meat | |
| Triethylamine | (C2H5)3N | Disagreeable, irritating | |
| Diamines, e.g. Cadaverine | NH2(CH2)5NH2 | Faecal, nauseating | |
| Pyridine | C6H5N | Faecal, nauseating | |
| Indole | C8H6NH | ||
| Scatole or Skatole | C9H8NH | ||
| Acids | Acetic (ethanoic) | CH3COOH | Vinegar |
| Butyric (butanoic) | C3H7COOH | Rancid, sweaty | |
| Valeric (pentanoic) | C4H9COOH | Sweaty | |
| Aldehydes & Ketones | Formaldehyde | HCHO | Acrid, suffocating |
| Acetaldehyde | CH3CHO | Fruit, apple | |
| Butyraldehyde | C3H7CHO | Rancid, sweaty | |
| Isobutyraldehyde | (CH3)2CHCHO | Fruit | |
| Isovaleraldehyde | (CH3)2CHCH2CHO | Fruit, apple | |
| Acetone | CH3COCH3 | Fruit, sweet | |
| Butanone | C2H5COCH3 | Green apple |
Adapted from Gostelow et al., 2001 (with reference to: Abbott, 1993; Bonnin et al., 1990; Brennan, 1993; Cheremisinoff, 1988; Koe, 1989; Vincent & Hobson, 1998; Young, 1984)
3.1.4. Risk assessment
Due to the limitations and uncertainties in the data linking odour exposure to health outcomes, as well as the nature of the health outcome data (self-reported) and the psychosocial aspects of the exposure-response relationship (not least the odour-worry paradigm, Neutra et al., 1991), it was considered that risks to humans from odours originating from sewage sludge could only be assessed using a Bayesian Network approach (Section 2.2.1).
The BBN model described here was developed using Netica™ version 3.25 by Norsys Systems Corp. In line with the guidance from Marcot et al (2006), the development of a BBN for this paper started with the creation of a conceptual model of the relationships (influence) diagram using data on sewage sludge production and application, data from studies linking odour exposure to health outcomes, as well as expert knowledge and experience of sludge handling and odour modelling (Figure 3‑1). The final outcome node is Annoyance from odour with 'annoyance' defined according to Blanes-Vidal et al. (2012).
The diagram represents key drivers (in nodes) of annoyance from odour due to sewage sludge application in Scotland. In the next phase each factor (node) was allocated values. In accordance with the considerable uncertainty in the data, all values were discretised into a number of categories or states. The number of states per node was kept to a minimum, and where possible Boolean values were adopted.
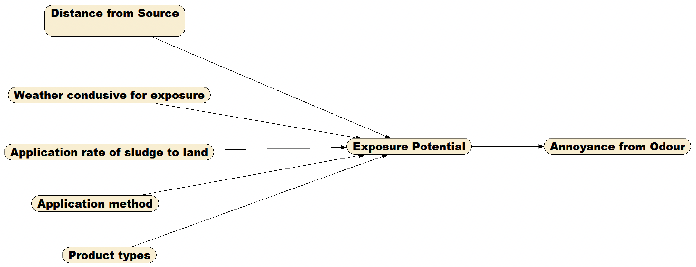
Model structure
The model structure (Figure 3‑1) was broadly based around three main drivers of odour exposure; namely sludge handling (e.g. product type, application method, application rate), climate and weather (i.e. are weather conditions likely to promote relatively localised concentration of odour), and location of receptors (i.e. the distance from source to receptor). These groupings are based on a synthesis of the available literature and there is either implicit or explicit evidence that they contribute to exposure to odour either in isolation or more often in combination. The relationships are often complex; for example, it is often the combination of temperature, rainfall and wind in a specific sequence that can trigger an exposure event, regardless of sludge handling characteristics.
Parameter learning
The current model (Figure 3‑1) consists of 7 nodes and 6 links. The outcome node, Annoyance from Odour, considers the process by which a particular receptor, given various sludge handing, distance from the source of odour, and weather conditions during the exposure event, may become annoyed due to perception of odour. The relationships between the different nodes are represented in conditional probability tables (CPTs). Parameter learning determines the prior CPT of each node of the network, given the link structures and available data. A CPT P(A|B1…Bn) was attached to each variable A with parents B1…Bn. If A had no parents (e.g. Product types in Figure 3‑1), the table was reduced to unconditional probabilities i.e. P(A). To illustrate, the prior unconditional probabilities for Product types was P(Product types), while the prior conditional probabilities for Exposure potential was P(Exposure potential | Distance from source, Weather, Application rate, Application method, Product types). Prior conditional probabilities were calculated by applying Bayes rule:
P(Exposure potential, Distance from source, Weather, Application rate, Application method, Product types)
= P(Exposure potential | Distance from source, Weather, Application rate, Application method, Product types)
* P(Distance from source, Weather, Application rate, Application method, Product types)
(Equation 3‑1)
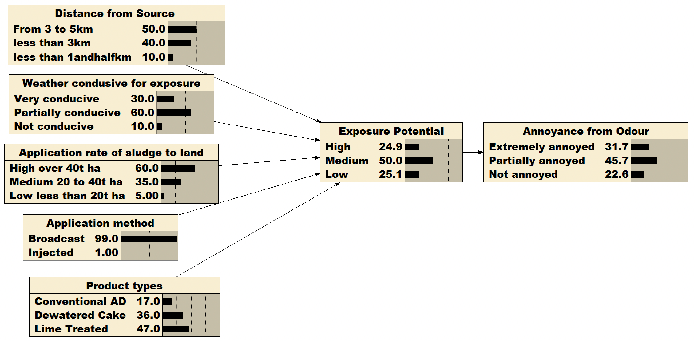
Prior unconditional probabilities were built using both 'expert' knowledge and actual observations. The ultimate objective is that all nodes are populated with empirical evidence. However, given the limitations of the information available, in the early stages of development the BBN was populated using a combination of expert knowledge and empirical evidence. With BBN's ability to learn from new data, the model developed through an iterative process which improved our understanding and knowledge. Table 3‑2 provides a list of all nodes and the information sources used to populate the prior CPTs. The aim was to develop prior probabilities that reflected the national (Scotland) situation; for example, looking at the Product type node, the prior distribution reflects the probability that any sewage sludge product available in Scotland is e.g. lime treated. The finalised BBN, complete with prior distributions is depicted in Figure 3‑2
Node |
Description |
Information type/source |
|---|---|---|
Distance from source |
Distance of receptors from nearest edge of source of odour (<1.5 km: >1.5<3 km:>3<5 km) |
Relationship between distances and exposure levels derived from Aatamila et al. 2011, 2010 |
Weather conducive for exposure |
Proportion of the time that weather conditions are considered to promote exposure to odour (very conducive:partially conducive:not conducive) |
Probability of atmospheric stability class being conducive for odour perception. Based on the relationship between the Pasquill atmospheric stability classes (Pasquill 1961) and odour perception of point sources (pig farms) as reported by Guo et al. (2006) |
Application rate of sludge to land |
Application rate in t fw ha-1 (>40 t ha-1: >20<40 t ha-1 : <20 t ha-1) |
Based on application rates used in WRAP (2016c) and Hough et al. (2012) which were themselves based on expert judgement |
Application method |
Method by which sewage sludge is applied to agricultural land (Broadcast: Injected) |
Based on personal communication |
Product Types |
Probability of a sewage sludge product used in Scotland to be of a specific type (Conventional AD: Dewatered cake: Lime Treated) |
Based on sludge production figures obtained from Scottish Water |
Exposure potential |
Probability that receptors will experience odour perception (High: Medium: Low). Levels of exposure assumed to equate to approximately: High = 100 g m-3 NH4 Medium = 10 g m-3 NH4 Low exposure = 1 g m-3 NH4 (Blanes-Vidal et al. 2012) |
Expert inference based on all combinations of states of its 5 parent nodes. The contribution of product type to exposure potential was derived from the ADAS Odour Report undertaken as part of this project. |
Annoyance from Odour |
Probability of perceiving the odour and becoming annoyed as the health outcome. Levels of annoyance (Extremely annoyed: Partially annoyed: Not annoyed) as defined by Blanes-Vidal et al. (2012). |
Derived from dose-response relationships between exposure to NH4 and level of annoyance (Blanes-Vidal et al., 2012). |
Structural learning
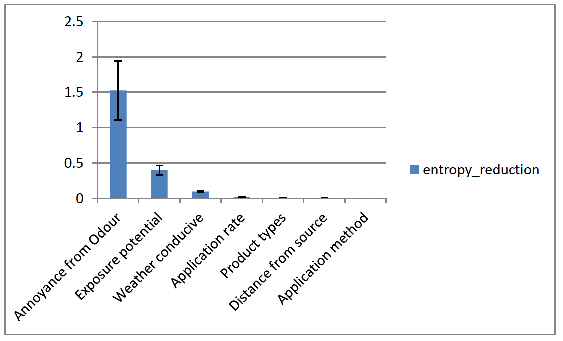
Sensitivity to findings analysis was performed to determine which variables had most influence on the outcome node, Annoyance from Odour. This was determined by calculating an entropy reduction value (ERV). The higher the value of ERV, the stronger a node affects another. Estimates of ERV, and the associated variance of beliefs, were calculated for Annoyance from Odour and then for the influence of each node in turn on Annoyance from Odour (Figure 3‑3). It is noteworthy that all of the variables where operators have significant control have minimal influence on Annoyance from Odour, suggesting that changing product type, application method or even increasing the distance between source and receptors (i.e. a 'buffer zone') will have little influence on how annoyed the local population are. Weather conditions play the most significant role in the outcome of Annoyance from Odour and suggest that timing of sewage sludge application to coincide with specific weather conditions might help reduce levels of annoyance in the community. This seems logical as the weather conditions play a key role in the source – pathway – exposure linkage. If the weather conditions are such that odour is not transported from the source to the receptor, then no exposure will occur. This does not however mean that no one will be annoyed. As described above, annoyance from odour has a psychosocial etiology, thus regardless of odour exposure a small minority of people will still report being 'extremely annoyed'; in the case of the presented model there remains a 10.7% probability of being extremely annoyed even in the absence of odour exposure (Figure 3‑4). This reflects that fact that a proportion of individuals within communities living within 5 km of regular sewage sludge spreading activities develop odour-worry condition (Neutra et al., 1991).
Scenario testing – forward inference
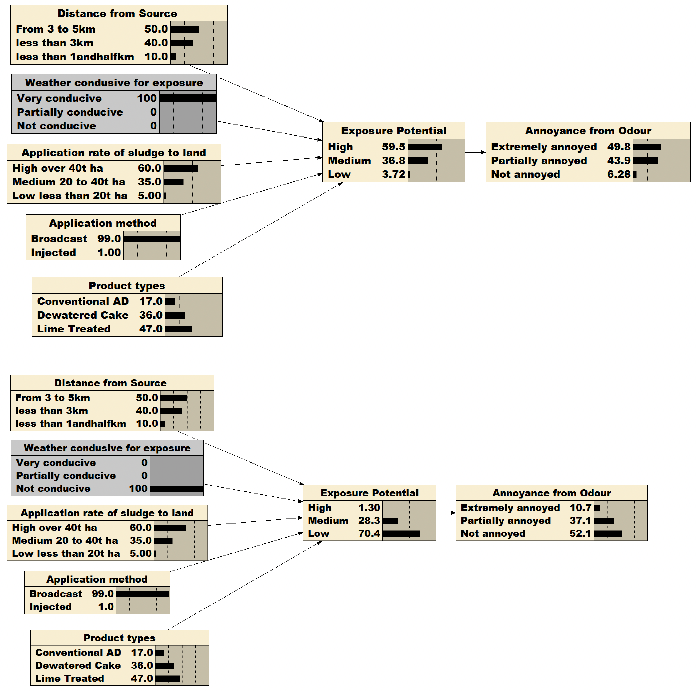
The BBN model can be used to test a variety of scenarios by forward inference. Here each node is set to its highest or lowest state to understand the impact of each factor on the risk of individuals becoming extremely annoyed by odour exposure. Figure 3‑4 shows, by way of illustration, a scenario where weather conditions are very conducive to exposure. Comparing the distribution of Annoyance from odour with Figure 3‑2 you can see an 18.1% increase in the probability that individuals will become extremely annoyed. A number of different scenarios were explored in turn (Table 3‑3).
| Node | Scenario | ΔP(Extremely annoyed) |
|---|---|---|
| Weather conducive for exposure | P(Not conducive) = 100% | -21% |
| P(Very conducive) = 100% | +18.1% | |
| Product types | P(Conventional AD) = 100% | -2.2% |
| P(Lime treated) = 100% | +2.4% | |
| Product types; Weather conducive for exposure | P(Conventional AD) = 100%; P(Very conducive) = 100% | -3.9% |
| P(Lime treated) = 100%; | +4.4% | |
| P(Very conducive) = 100% | ||
| Application method | P(Injected) = 100% | -6.7% |
| Application method; Weather conducive for exposure | P(Injected) = 100%; | -9.9% |
| P(Very conducive) = 100% | ||
| Application rate | P(Low less than 20t ha) = 100% | -16.2% |
| P(High over 40t ha) = 100% | +3.1% | |
| Application rate; Weather conducive for exposure | P(Low less than 20t ha) = 100%; P(Very conducive) = 100% | -20.3% |
| P(High over 40t ha) = 100%; | +3% | |
| P(Very conducive) = 100% | ||
| Distance from source | P(From 3 to 5km) = 100% | -2.6% |
| P(Less than 1andhalfkm) = 100% | +6.1% | |
| Distance from source; Weather conducive for exposure | P(From 3 to 5km) = 100%; | -2.3% |
| P(Very conducive) = 100% | ||
| P(Less than 1andhalfkm) = 100% | +5.3% | |
| P(Very conducive) = 100% |
The forward inference scenario analysis concurs with the sensitivity to findings analysis, highlighting the pivotal role that weather conditions play in the source – pathway – exposure linkage. The CPT for Weather conducive to exposure is derived from the relationship between atmospheric stability classes (Pasquill 1961) and levels of odour perception from point sources (Guo et al., 2006). The 'Not conducive' state is the probability of Scottish weather being Pasquill stability class A characterised by wind speed <2 m s-1 and strong daytime solar radiation; the 'Very conducive' state is the probability of Scottish weather being Pasquill stability class D characterised by wind speed >6 m s-1, slight daytime solar radiation, and night time cloud >50% of the time. 'Partially conducive' is the probability of Scottish weather being Pasquill stability classes B, C, E, F or G. Guo et al. (2006) found that out of 298 recorded odour events, none were reported when conditions were Pasquill A, but 184 (~62%) odour events (including 26 very high intensity events) were recorded under Pasquill D conditions. The remaining 114 odour events were split between the remaining Pasquill classes.
Application rate was also highlighted as being an important risk factor that essentially reduces the source term and hence intensity of the odour that is released from the spreading processes. Reducing application rate down to <20 t ha-1 reduces P(Extremely annoyed) by 16.2 %. In many circumstances, the Safe Sludge Matrix already requires that application rates are of a similar magnitude.
While Weather conducive for exposure is the most important risk factor for Annoyance from odour; it is interesting to explore which management options help mitigate odour most effectively. To do this, Weather conducive for exposure was set to P(Very conducive) = 100% and the management factors varied in turn (Table 3‑3). The biggest reductions in P(Extremely annoyed) were again seen by reducing the application rate (reduction in P(Extremely annoyed) of 20.3%).
Scenario testing – backwards inference
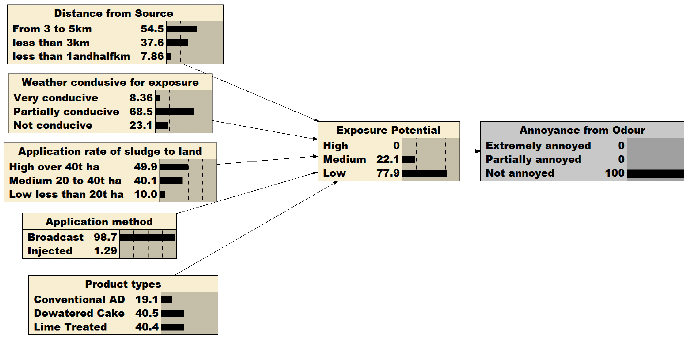
To investigate the conditions required to achieve Annoyance from odour P(Not annoyed) = 100%, a backwards inference was performed (Figure 3‑5). While (due to phenomena such as odour-worry condition) it would not be possible to achieve a complete absence of annoyance in the community, the backwards inference does inform the steps that could be taken to reduce probability of annoyance. In summary, these are:
- Ensure that the distance from the sewage spreading operations to the nearest residencies is at least 3 km
- Restrict spreading of sewage sludge to weather conditions that are less conducive for exposure, with partially conducive (i.e. Pasquill classes B, C, E, F & G) being protective enough if the other measures in this list are in place
- Application rates as recommended by the Safe Sludge Matrix
- Reduce the amount of lime-treated sewage sludge that is applied to land
Contact
Email: gary.gray@gov.scot