Government Expenditure & Revenue Scotland (GERS) 2021-22
Government Expenditure and Revenue Scotland (GERS) is a National Statistics publication. It reports estimates of the revenue raised in Scotland and the cost of public services provided for Scotland.
Chapter 3 Public Sector Expenditure
Introduction
This chapter provides detailed estimates of public sector expenditure for Scotland. Expenditure is shown by type of spend, using a presentation based on the UN's Classification of the Functions of Government (COFOG). Further information is provided in the Glossary in Annex D. Current and capital expenditure are shown separately.
The primary data sources used to estimate Scottish public sector expenditure in GERS are Scottish Government spending reported on the UK Government's public spending system, OSCAR, and HM Treasury's Public Expenditure Statistical Analyses (PESA)[21] and the supporting Country and Regional Analysis (CRA).[22]
Spending by the Scottish Government is provided directly by the Scottish Government Directorate for Financial Management. Scottish Local Government spending in all years is taken from HM Treasury's PESA publication. Spending by other UK government departments spending is based on PESA for 2021-22 and on the CRA for earlier years. Further information on the methodology is set out in the expenditure methodology paper available at the link below.
Economy statistics - gov.scot (www.gov.scot)
GERS also includes some transactions between Scotland and the EU. These can be reported in a number of different ways, and are discussed in more detail later in the chapter.
GERS expenditure figures are presented on a National Accounts basis, an international reporting standard used by governments. This requires a number of accounting adjustments to be included in total expenditure. These are primarily symmetric adjustments that also form part of revenue, and therefore have little impact on the net fiscal balance. Further information is set out in Annex A.
Public Sector Expenditure
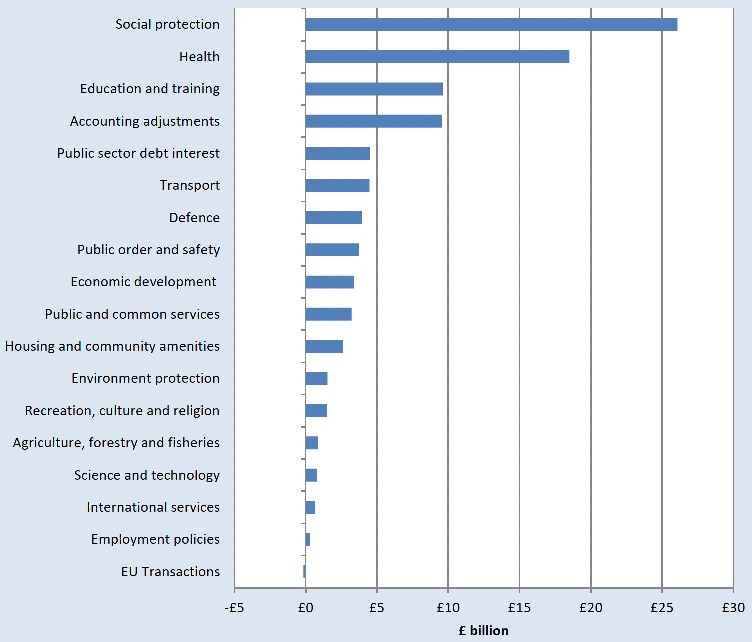
Total public sector expenditure for Scotland in 2021-22 is estimated to be £97.5 billion, a decrease of 1.0% from 2020-21. This fall in spending, the first time spending has fallen in cash terms since 2013-14, reflects the beginning of the scaling back of the response to the coronavirus pandemic, which led to large increases in spending, particularly on health, social security, and enterprise and economic development. This final category includes support paid to businesses and workers such as the Coronavirus Job Retention Scheme. Further information on reserved spending in response to the pandemic is set out in Box 3.1.
Table 3.1 shows a breakdown of spending by category.
| Scotland | ||
|---|---|---|
| £ million | % of total expenditure | |
| General public services | ||
| Public and common services | 3,218 | 3.3% |
| International services | 664 | 0.7% |
| Reserved public sector debt interest | 4,527 | 4.6% |
| Local government pension fund interest expenditure | 2,335 | 2.4% |
| Defence | 3,958 | 4.1% |
| Public order and safety | 3,731 | 3.8% |
| Economic affairs | ||
| Enterprise and economic development | 3,369 | 3.5% |
| Science and technology | 776 | 0.8% |
| Employment policies | 315 | 0.3% |
| Agriculture, forestry and fisheries | 861 | 0.9% |
| Transport | 4,480 | 4.6% |
| Environment protection | 1,537 | 1.6% |
| Housing and community amenities | 2,624 | 2.7% |
| Health | 18,488 | 19.0% |
| Recreation, culture and religion | 1,509 | 1.5% |
| Education and training | 9,632 | 9.9% |
| Social protection | 26,076 | 26.7% |
| EU transactions | -156 | -0.2% |
| Accounting adjustments | 9,557 | 9.8% |
| Total Expenditure | 97,502 | 100% |
Table 3.2 below shows growth in current and capital spend in Scotland by organization in 2021-22, compared to the UK. Spending fell more slowly in Scotland than the UK as a whole in 2021-22. This is primarily due to increased capital spending in Scotland offsetting falls in current spending. The increases in capital spending are driven by increases by local authorities, including ring-fenced local authority spending on housing which is reported as public corporation spending in GERS (the 'Housing Revenue Account').
Box 3.1: Spending associated with the coronavirus pandemic
The coronavirus pandemic has seen an unprecedented increase in public spending, spread across a range of areas. In the devolved sphere, there has been an increase in health expenditure in response to treating COVID-19 patients and delivering the vaccination programme. There have also been a range of other measures, particularly business support grants paid via local authorities. The Scottish Government spent £8.8 billion in 2020-21 and £5.7 billion in 2021-22 response to the health, economic, and social challenges caused by the coronavirus pandemic.[23] Whilst this is captured in the Scottish Government spending figures in GERS, it is not separately identifiable from non-pandemic related spend.
The table below summarises some of the key Scottish Government spend in response to coronavirus. This spending has been primarily delivered via grants to local authorities, which means that it cannot be directly reported using the categories of spend used in GERS. Further detail is set out at:
Scotland's financial response to Covid-19 | Audit Scotland (audit-scotland.gov.uk)
| 2020-21 | 2021-22 | |
|---|---|---|
| Grants to local councils | 4,292 | 1,500 |
| Health and social care | 2,755 | 2,642 |
| Transport | 646 | 470 |
| Other | 1,084 | 1,122 |
| Total | 8,777 | 5,734 |
In the reserved sphere, there have been a number of interventions, the most significant of which have been the Coronavirus Job Retention Scheme, the Self-Employment Income Support Scheme, and changes to the value and eligibility criteria for Universal Credit. These schemes have all aimed to support household incomes and businesses during the pandemic. Further details are on these schemes was set out in Box 3.1 of last year's edition of GERS.
An additional element of reserved spending is included this year, in the form of coronavirus business loans. The spending here is currently shown only for 2020-21, and represents the value of loans issued in this year which is not expected to be repaid.
The table below summarises the costs for Scotland associated with the schemes above in this edition of GERS. This is not an exhaustive list of reserved coronavirus interventions, with smaller schemes such as the Eat Out to Help Out scheme not included.
| 2020-21 | 2021-22 | Scottish share | |
|---|---|---|---|
| Coronavirus Job Retention Scheme1 | 4,710 | 860 | 8.1% |
| Self-employment Income Support Scheme1 | 1,195 | 515 | 6.1% |
| Coronavirus business loans2 | 1,213 | 5.9% | |
| Welfare spending3 | 1,349 | 1,402 | 6.9% |
| Health spending4 | 945 | 886 | 7.2% |
| Total | 9,412 | 3,664 | 7.2% |
Sources:
1 HMRC Tax Receipts and National Insurance Contributions for the UK, Scottish Government calculations
2 HM Treasury Country and Regional Analysis. Includes Coronavirus Business Interruption Loan Scheme (CBILS), Coronavirus Large Business Interruption Loan Scheme (CLBILS) and the Bounce Back Loan Scheme (BBLS)
3 OBR Economic and Fiscal Outlook March 2021, Scottish Government calculations
4 2020-21: National Audit Office Coronavirus cost tracker, Scottish Government calculations. 2021-22: OSCAR in-year spend data, Scottish Government calculations. UK spending includes some elements which are not reserved, leading to Scottish share being below a population share.
| Scotland | ||||
|---|---|---|---|---|
| 2020-21 | 2021-22 | Growth | UK growth | |
| Current expenditure | 87,552 | 85,628 | -2.2% | -3.9% |
| Scottish Government | 36,396 | 37,230 | 2.3% | 2.3% |
| Local Government | 16,025 | 16,315 | 1.8% | -7.6% |
| Public Corporations | - | - | - | - |
| Other UK Government bodies | 35,131 | 32,083 | -8.7% | -3.0% |
| Capital expenditure | 10,887 | 11,874 | 9.1% | -4.9% |
| Scottish Government | 3,822 | 3,939 | 3.0% | 3.0% |
| Local Government | 1,853 | 2,492 | 34.5% | 9.2% |
| Public Corporations | 1,135 | 1,605 | 41.3% | 31.4% |
| Other UK Government bodies | 4,076 | 3,839 | -5.8% | -11.6% |
| Total expenditure | 98,439 | 97,502 | -1.0% | -4.0% |
| Scottish Government | 40,219 | 41,169 | 2.4% | 2.4% |
| Local Government | 17,878 | 18,807 | 5.2% | -6.1% |
| Public Corporations | 1,135 | 1,605 | 41.3% | 31.4% |
| Other UK Government bodies | 39,207 | 35,921 | -8.4% | -3.9% |
Notes:
1. Public corporation line for Scotland shows spending by Scottish public corporations only. UK figure shows spending by all public corporations
2. Public corporations have no current expenditure as this is netted off against their income to provide their gross operating surplus in the revenue calculations. Consistent with the CRA, interest expenditure by public corporations is recorded as spending by HM Treasury.
3. Spend by Other UK Government departments for Scotland and the UK are not directly comparable, as spending for the UK as a whole includes spending on functions which are devolved to the Scottish Government.
Table 3.3 shows the split of total expenditure between current and capital for Scotland. As noted above, increased capital spending by local authorities has offset falling current expenditure, and leads to an increase in capital spending as a share of overall spending.
| per cent | |||||
|---|---|---|---|---|---|
| 2017-18 | 2018-19 | 2019-20 | 2020-21 | 2021-22 | |
| Current | 88.6% | 88.7% | 89.0% | 88.9% | 87.8% |
| Capital | 11.4% | 11.3% | 11.0% | 11.1% | 12.2% |
Table 3.4 below shows estimates of Scottish and UK public sector expenditure as a share of GDP. This provides an illustration of the relative size of public spending between countries and over time. It is not an estimate of the contribution of public spending to the economy as much of this spending consists of transfers from government to individuals and businesses. Excluding North Sea GDP, public sector spending as a share of GDP has fallen to 56.1% in 2021-22, although it remains around 5 percentage points higher than before the pandemic.
Although overall spending in Scotland fell more slowly than for the UK in 2021-22, spending as a share of GDP fell faster. This reflects faster nominal GDP growth in Scotland in 2021‑22.
| per cent of GDP | |||||
|---|---|---|---|---|---|
| 2017-18 | 2018-19 | 2019-20 | 2020-21 | 2021-22 | |
| Scottish TME as a Share of GDP: | |||||
| Excluding North Sea GDP | 48.9% | 48.8% | 49.2% | 64.8% | 56.1% |
| Including population share of North Sea GDP | 48.5% | 48.3% | 48.8% | 64.5% | 55.5% |
| Including geographical share of North Sea GDP | 45.6% | 44.4% | 45.4% | 62.3% | 50.6% |
| UK TME as a share of GDP: | |||||
| 100% of North Sea GDP | 39.6% | 39.0% | 39.1% | 51.6% | 44.6% |
Table 3.5 shows total public sector expenditure per person for Scotland and the UK. The relative gap between Scottish and UK spending per person increased in 2021-22, with spend per person 12.4% points higher. This increase reflects the reduction of spending in response to the coronavirus pandemic, where Scotland broadly received a population increase of UK spending. As this spending comes to an end, the difference between Scottish and UK spending should return to pre-pandemic levels.
As noted previously, water and sewerage services are provided by the public sector in Scotland, but by the private sector in England and Wales, leading to relatively higher spending in Scotland. This explains slightly less than one percentage point of the difference in spend.
Tables 3.6 and 3.7 show current, capital, and total expenditure for Scotland and the UK respectively.
| £ per person | |||||
|---|---|---|---|---|---|
| 2017-18 | 2018-19 | 2019-20 | 2020-21 | 2021-22 | |
| Scotland | 14,257 | 14,608 | 15,000 | 17,998 | 17,793 |
| UK | 12,647 | 12,887 | 13,222 | 16,468 | 15,830 |
| Difference (Scotland minus UK) | 1,610 | 1,721 | 1,778 | 1,530 | 1,963 |
| Difference between Scottish and UK | 12.7% | 13.4% | 13.4% | 9.3% | 12.4% |
Box 3.2 Social protection spending in Scotland
Social protection spending is the largest single spending line in GERS, and covers a range of different spend types.
The largest spending element within social protection is expenditure on the state pension by the Department for Work and Pensions (DWP). This is followed by DWP's spending on other social security such as universal credit disability and incapacity related benefits, and housing benefit. Tax credits and child benefit are part of HMRC spending. Scottish Government social security spend includes the Scottish Welfare Fund, Council Tax Reduction Scheme, and Scottish Government expenditure on Discretionary Housing Payments, all of which are administered by Local Authorities. From 2018-19, it also includes spending on newly devolved social security, as set out in Chapter 4.
Some UK social security expenditure, mostly associated with the state pension, is paid to non-UK residents. Scotland is allocated a population share of this expenditure in GERS.
| 2017-18 | 2018-19 | 2019-20 | 2020-21 | 2021-22 | |
|---|---|---|---|---|---|
| Social security spending in Scotland | |||||
| State pension | 7,919 | 8,154 | 8,313 | 8,501 | 8,715 |
| Housing benefit | 1,671 | 1,588 | 1,441 | 1,380 | 1,286 |
| Universal credit | 313 | 766 | 1,486 | 2,909 | 3,016 |
| Other DWP social security | 5,749 | 5,682 | 5,476 | 2,719 | 3,660 |
| HMRC child benefit and tax credits | 2,681 | 2,380 | 2,076 | 1,832 | 1,540 |
| Scottish Government social security | 419 | 745 | 830 | 3,892 | 4,015 |
| Social security spending in Scotland | 18,752 | 19,316 | 19,622 | 21,233 | 22,231 |
| Share of benefit spending outside | 340 | 352 | 358 | 366 | 372 |
| Share of corporate spend | 249 | 270 | 234 | 294 | 370 |
| Other social protection | |||||
| Net public sector pensions | 735 | 935 | 356 | 242 | 163 |
| Social care for the elderly | 2,178 | 2,290 | 2,477 | 2,611 | 2,752 |
| Other | 1,063 | 1,060 | 1,112 | 1,353 | 189 |
| Total social protection | 23,317 | 24,221 | 24,159 | 26,099 | 26,076 |
Other social protection spending consists primarily of Local Authority expenditure on social care to families and children.
A more detailed breakdown of social security spending is published by DWP, available at the link below.
Benefit expenditure and caseload tables - GOV.UK (www.gov.uk)
Spending by different parts of the Public Sector
Table 3.8 below provides a breakdown of Scottish expenditure by the Scottish Government, Scottish local government and public corporations, and other UK government bodies. .
| £ million | |||||||||||||||
|---|---|---|---|---|---|---|---|---|---|---|---|---|---|---|---|
| Current | Capital | Total | |||||||||||||
| 2017-18 | 2018-19 | 2019-20 | 2020-21 | 2021-22 | 2017-18 | 2018-19 | 2019-20 | 2020-21 | 2021-22 | 2017-18 | 2018-19 | 2019-20 | 2020-21 | 2021-22 | |
| General public services | |||||||||||||||
| Public and common services | 1,298 | 1,354 | 1,903 | 1,784 | 2,821 | 350 | 265 | 238 | 335 | 397 | 1,648 | 1,619 | 2,140 | 2,118 | 3,218 |
| International services | 755 | 737 | 815 | 739 | 538 | 103 | 236 | 144 | 177 | 126 | 858 | 973 | 959 | 916 | 664 |
| Public sector interest expenditure | 5,458 | 5,025 | 4,871 | 4,301 | 6,862 | 0 | 0 | 0 | 0 | 0 | 5,458 | 5,025 | 4,871 | 4,301 | 6,862 |
| Defence | 2,332 | 2,408 | 2,563 | 2,622 | 2,679 | 844 | 885 | 890 | 1,005 | 1,280 | 3,176 | 3,293 | 3,454 | 3,627 | 3,958 |
| Public order and safety | 2,716 | 2,845 | 3,011 | 3,186 | 3,519 | 130 | 140 | 158 | 222 | 212 | 2,846 | 2,985 | 3,168 | 3,408 | 3,731 |
| Economic affairs | |||||||||||||||
| Enterprise and economic development | 815 | 904 | 1,077 | 7,715 | 3,003 | 366 | 500 | 486 | 1,650 | 366 | 1,181 | 1,403 | 1,562 | 9,365 | 3,369 |
| Science and technology | 181 | 186 | 182 | 188 | 199 | 304 | 332 | 347 | 590 | 576 | 485 | 518 | 529 | 778 | 776 |
| Employment policies | 228 | 242 | 177 | 191 | 306 | 8 | 4 | 0 | 6 | 9 | 237 | 246 | 177 | 197 | 315 |
| Agriculture, forestry and fisheries | 794 | 814 | 810 | 805 | 704 | 121 | 112 | 94 | 120 | 157 | 916 | 926 | 904 | 925 | 861 |
| Transport | 1,665 | 1,704 | 1,836 | 2,644 | 2,267 | 1,890 | 1,723 | 1,878 | 1,961 | 2,213 | 3,555 | 3,427 | 3,714 | 4,605 | 4,480 |
| Environment protection | 893 | 906 | 919 | 927 | 988 | 330 | 354 | 524 | 532 | 549 | 1,223 | 1,260 | 1,443 | 1,459 | 1,537 |
| Housing and community amenities | 159 | 213 | 137 | 216 | 269 | 1,689 | 2,012 | 2,184 | 1,870 | 2,354 | 1,848 | 2,225 | 2,321 | 2,086 | 2,624 |
| Health | 12,328 | 12,596 | 13,301 | 17,428 | 17,764 | 475 | 486 | 466 | 621 | 725 | 12,803 | 13,082 | 13,767 | 18,049 | 18,488 |
| Recreation, culture and religion | 1,061 | 1,169 | 1,115 | 1,265 | 1,252 | 255 | 235 | 238 | 201 | 257 | 1,316 | 1,404 | 1,353 | 1,466 | 1,509 |
| Education and training | 7,499 | 7,883 | 8,388 | 8,946 | 8,589 | 995 | 765 | 870 | 1,120 | 1,043 | 8,494 | 8,648 | 9,258 | 10,066 | 9,632 |
| Social protection | 23,259 | 24,135 | 24,048 | 25,972 | 25,920 | 58 | 86 | 111 | 126 | 156 | 23,317 | 24,221 | 24,159 | 26,099 | 26,076 |
| EU Transactions | 415 | 600 | 473 | 595 | -156 | 0 | 0 | 0 | 0 | 0 | 415 | 600 | 473 | 595 | -156 |
| Accounting adjustments | 6,695 | 6,799 | 7,292 | 8,029 | 8,104 | 917 | 878 | 417 | 351 | 1,453 | 7,612 | 7,677 | 7,709 | 8,380 | 9,557 |
| Total | 68,551 | 70,519 | 72,915 | 87,552 | 85,628 | 8,836 | 9,013 | 9,045 | 10,887 | 11,874 | 77,387 | 79,532 | 81,960 | 98,439 | 97,502 |
| £ million | |||||||||||||||
|---|---|---|---|---|---|---|---|---|---|---|---|---|---|---|---|
| Current | Capital | Total | |||||||||||||
| 2017-18 | 2018-19 | 2019-20 | 2020-21 | 2021-22 | 2017-18 | 2018-19 | 2019-20 | 2020-21 | 2021-22 | 2017-18 | 2018-19 | 2019-20 | 2020-21 | 2021-22 | |
| General public services | |||||||||||||||
| Public and common services | 10,098 | 10,220 | 11,809 | 15,205 | 24,455 | 2,381 | 2,576 | 2,657 | 3,385 | 3,199 | 12,479 | 12,796 | 14,466 | 18,590 | 27,655 |
| International services | 9,176 | 8,998 | 9,954 | 9,059 | 6,537 | 1,255 | 2,879 | 1,759 | 2,167 | 1,551 | 10,431 | 11,877 | 11,713 | 11,226 | 8,088 |
| Public sector interest expenditure | 60,064 | 54,542 | 52,933 | 41,822 | 72,848 | 0 | 0 | 0 | 0 | 0 | 60,064 | 54,542 | 52,933 | 41,822 | 72,848 |
| Defence | 28,399 | 29,422 | 31,358 | 32,247 | 32,901 | 10,271 | 10,816 | 10,887 | 12,335 | 15,707 | 38,670 | 40,238 | 42,245 | 44,582 | 48,608 |
| Public order and safety | 29,437 | 30,438 | 32,253 | 35,893 | 39,394 | 2,032 | 1,975 | 2,272 | 2,996 | 2,900 | 31,469 | 32,413 | 34,525 | 38,889 | 42,294 |
| Economic affairs | |||||||||||||||
| Enterprise and economic development | 7,300 | 9,382 | 13,894 | 108,105 | 35,239 | 2,687 | 3,777 | 3,312 | 22,172 | -1,463 | 9,987 | 13,159 | 17,206 | 130,277 | 33,776 |
| Science and technology | 1,126 | 1,011 | 1,020 | 1,052 | 1,128 | 3,920 | 5,422 | 5,787 | 6,395 | 6,235 | 5,046 | 6,433 | 6,807 | 7,447 | 7,363 |
| Employment policies | 2,512 | 2,632 | 2,253 | 2,543 | 4,099 | 105 | 47 | 2 | 77 | 123 | 2,617 | 2,679 | 2,255 | 2,620 | 4,222 |
| Agriculture, forestry and fisheries | 4,784 | 5,344 | 5,405 | 5,800 | 5,483 | 394 | 390 | 398 | 519 | 926 | 5,178 | 5,734 | 5,803 | 6,319 | 6,409 |
| Transport | 9,967 | 11,963 | 13,030 | 26,478 | 19,187 | 20,365 | 20,713 | 21,570 | 23,323 | 26,041 | 30,332 | 32,676 | 34,600 | 49,801 | 45,228 |
| Environment protection | 7,274 | 7,377 | 7,909 | 8,523 | 8,983 | 4,529 | 3,685 | 3,912 | 4,435 | 4,898 | 11,803 | 11,062 | 11,821 | 12,958 | 13,881 |
| Housing and community amenities | 2,979 | 3,086 | 3,257 | 3,697 | 3,446 | 8,377 | 8,961 | 10,901 | 9,884 | 11,813 | 11,356 | 12,047 | 14,158 | 13,581 | 15,260 |
| Health | 141,033 | 145,899 | 156,509 | 204,993 | 207,572 | 6,304 | 7,019 | 7,630 | 13,576 | 9,212 | 147,337 | 152,918 | 164,139 | 218,569 | 216,784 |
| Recreation, culture and religion | 9,306 | 9,267 | 9,398 | 10,806 | 10,355 | 2,173 | 2,119 | 2,534 | 2,112 | 2,443 | 11,479 | 11,386 | 11,932 | 12,918 | 12,798 |
| Education and training | 77,088 | 79,051 | 82,248 | 86,215 | 91,009 | 8,967 | 8,999 | 8,365 | 9,309 | 9,241 | 86,055 | 88,050 | 90,613 | 95,524 | 100,250 |
| Social protection | 268,245 | 274,261 | 275,347 | 298,673 | 297,846 | 483 | 551 | 468 | 639 | 840 | 268,728 | 274,812 | 275,815 | 299,312 | 298,686 |
| EU transactions | 5,360 | 7,850 | 5,828 | 6,999 | -1,830 | 0 | 0 | 0 | 0 | 0 | 5,360 | 7,850 | 5,828 | 6,999 | -1,830 |
| Accounting adjustments | 68,912 | 70,040 | 75,301 | 81,254 | 82,860 | 19,146 | 16,594 | 11,959 | 11,611 | 25,122 | 88,058 | 86,634 | 87,260 | 92,866 | 107,982 |
| Total | 743,060 | 760,783 | 789,706 | 979,364 | 941,514 | 93,389 | 96,523 | 94,413 | 124,935 | 118,787 | 836,449 | 857,306 | 884,119 | 1,104,299 | 1,060,301 |
| £ million | |||||||||||||||
|---|---|---|---|---|---|---|---|---|---|---|---|---|---|---|---|
| Scottish Government, LAs and Public Corporations | Other UK Government | Total | |||||||||||||
| 2017-18 | 2018-19 | 2019-20 | 2020-21 | 2021-22 | 2017-18 | 2018-19 | 2019-20 | 2020-21 | 2021-22 | 2017-18 | 2018-19 | 2019-20 | 2020-21 | 2021-22 | |
| General public services | |||||||||||||||
| Public and common services | 835 | 906 | 1,385 | 1,176 | 1,474 | 463 | 448 | 518 | 607 | 1,347 | 1,298 | 1,354 | 1,903 | 1,784 | 2,821 |
| International services | 1 | 1 | 1 | 1 | 5 | 754 | 736 | 814 | 738 | 532 | 755 | 737 | 815 | 739 | 538 |
| Public sector interest expenditure | 1,731 | 1,825 | 1,767 | 2,293 | 2,335 | 3,727 | 3,200 | 3,104 | 2,008 | 4,527 | 5,458 | 5,025 | 4,871 | 4,301 | 6,862 |
| Defence | 3 | 3 | 3 | 6 | 3 | 2,329 | 2,405 | 2,560 | 2,616 | 2,676 | 2,332 | 2,408 | 2,563 | 2,622 | 2,679 |
| Public order and safety | 2,519 | 2,639 | 2,784 | 2,850 | 3,061 | 196 | 205 | 227 | 336 | 457 | 2,716 | 2,845 | 3,011 | 3,186 | 3,519 |
| Economic affairs | |||||||||||||||
| Enterprise and econ development | 495 | 496 | 473 | 791 | 663 | 320 | 408 | 603 | 6,924 | 2,340 | 815 | 904 | 1,077 | 7,715 | 3,003 |
| Science and technology | 3 | 0 | 2 | 1 | 1 | 178 | 186 | 180 | 187 | 198 | 181 | 186 | 182 | 188 | 199 |
| Employment policies | 0 | 0 | 0 | 0 | 0 | 228 | 242 | 177 | 191 | 306 | 228 | 242 | 177 | 191 | 306 |
| Agriculture, forestry and fisheries | 779 | 805 | 783 | 785 | 685 | 15 | 9 | 27 | 20 | 18 | 794 | 814 | 810 | 805 | 704 |
| Transport | 1,271 | 1,269 | 1,394 | 2,071 | 1,844 | 394 | 435 | 441 | 573 | 423 | 1,665 | 1,704 | 1,836 | 2,644 | 2,267 |
| Environment protection | 840 | 854 | 833 | 861 | 881 | 53 | 53 | 85 | 66 | 107 | 893 | 906 | 919 | 927 | 988 |
| Housing and community amenities | 159 | 213 | 137 | 216 | 269 | 0 | 0 | 0 | 0 | 0 | 159 | 213 | 137 | 216 | 269 |
| Health | 12,252 | 12,537 | 13,237 | 16,519 | 16,874 | 76 | 59 | 65 | 909 | 890 | 12,328 | 12,596 | 13,301 | 17,428 | 17,764 |
| Recreation, culture and religion | 718 | 816 | 752 | 954 | 937 | 344 | 353 | 363 | 310 | 315 | 1,061 | 1,169 | 1,115 | 1,265 | 1,252 |
| Education and training | 7,472 | 7,868 | 8,366 | 8,932 | 8,575 | 27 | 15 | 22 | 13 | 14 | 7,499 | 7,883 | 8,388 | 8,946 | 8,589 |
| Social protection | 5,255 | 5,742 | 5,457 | 8,681 | 9,190 | 18,004 | 18,393 | 18,591 | 17,291 | 16,730 | 23,259 | 24,135 | 24,048 | 25,972 | 25,920 |
| EU transactions | 0 | 0 | 0 | 0 | 0 | 415 | 600 | 473 | 595 | -156 | 415 | 600 | 473 | 595 | -156 |
| Accounting adjustments | 5,698 | 5,864 | 6,162 | 6,284 | 6,745 | 997 | 936 | 1,129 | 1,745 | 1,359 | 6,695 | 6,799 | 7,292 | 8,029 | 8,104 |
| Total | 40,031 | 41,836 | 43,535 | 52,421 | 53,546 | 28,520 | 28,683 | 29,380 | 35,131 | 32,083 | 68,551 | 70,519 | 72,915 | 87,552 | 85,628 |
| £ million | |||||||||||||||
|---|---|---|---|---|---|---|---|---|---|---|---|---|---|---|---|
| Scottish Government, LAs and Public Corporations | Other UK Government | Total | |||||||||||||
| 2017-18 | 2018-19 | 2019-20 | 2020-21 | 2021-22 | 2017-18 | 2018-19 | 2019-20 | 2020-21 | 2021-22 | 2017-18 | 2018-19 | 2019-20 | 2020-21 | 2021-22 | |
| General public services | |||||||||||||||
| Public and common services | 254 | 169 | 138 | 214 | 312 | 96 | 96 | 100 | 121 | 85 | 350 | 265 | 238 | 335 | 397 |
| International services | 0 | 0 | 0 | 0 | 0 | 103 | 236 | 144 | 177 | 126 | 103 | 236 | 144 | 177 | 126 |
| Public sector interest expenditure | 0 | 0 | 0 | 0 | 0 | 0 | 0 | 0 | 0 | 0 | 0 | 0 | 0 | 0 | 0 |
| Defence | 0 | 0 | 0 | 0 | 0 | 844 | 885 | 890 | 1,005 | 1,280 | 844 | 885 | 890 | 1,005 | 1,280 |
| Public order and safety | 107 | 117 | 128 | 179 | 184 | 23 | 23 | 30 | 42 | 28 | 130 | 140 | 158 | 222 | 212 |
| Economic affairs | |||||||||||||||
| Enterprise and econ development | 355 | 476 | 457 | 478 | 520 | 11 | 24 | 29 | 1,172 | -154 | 366 | 500 | 486 | 1,650 | 366 |
| Science and technology | 0 | 2 | 0 | 0 | 0 | 304 | 330 | 347 | 590 | 576 | 304 | 332 | 347 | 590 | 576 |
| Employment policies | 0 | 0 | 0 | 0 | 0 | 8 | 4 | 0 | 6 | 9 | 8 | 4 | 0 | 6 | 9 |
| Agriculture, forestry and fisheries | 122 | 110 | 91 | 119 | 152 | 0 | 2 | 3 | 2 | 5 | 121 | 112 | 94 | 120 | 157 |
| Transport | 1,247 | 1,197 | 1,371 | 1,337 | 1,648 | 643 | 526 | 508 | 624 | 565 | 1,890 | 1,723 | 1,878 | 1,961 | 2,213 |
| Environment protection | 85 | 144 | 324 | 313 | 319 | 244 | 210 | 200 | 219 | 230 | 330 | 354 | 524 | 532 | 549 |
| Housing and community amenities | 1,689 | 2,012 | 2,184 | 1,870 | 2,354 | 0 | 0 | 0 | 0 | 0 | 1,689 | 2,012 | 2,184 | 1,870 | 2,354 |
| Health | 408 | 465 | 450 | 455 | 665 | 68 | 21 | 16 | 166 | 60 | 475 | 486 | 466 | 621 | 725 |
| Recreation, culture and religion | 196 | 183 | 173 | 160 | 216 | 59 | 53 | 65 | 41 | 41 | 255 | 235 | 238 | 201 | 257 |
| Education and training | 995 | 764 | 869 | 1,120 | 1,043 | 0 | 1 | 0 | 0 | 0 | 995 | 765 | 870 | 1,120 | 1,043 |
| Social protection | 40 | 73 | 112 | 108 | 144 | 18 | 13 | -1 | 18 | 12 | 58 | 86 | 111 | 126 | 156 |
| EU transactions | 0 | 0 | 0 | 0 | 0 | 0 | 0 | 0 | 0 | 0 | 0 | 0 | 0 | 0 | 0 |
| Accounting adjustments | 793 | 581 | 406 | 457 | 478 | 124 | 297 | 11 | -106 | 974 | 917 | 878 | 417 | 351 | 1,453 |
| Total | 6,291 | 6,294 | 6,704 | 6,811 | 8,035 | 2,545 | 2,719 | 2,341 | 4,076 | 3,839 | 8,836 | 9,013 | 9,045 | 10,887 | 11,874 |
Scotland's Notional Contributions to the European Union Budget
While a member of the European Union (EU), the UK contributed to the EU budget and receives funding from the EU via a number of programmes. Although the UK left the EU on 31 January 2020, it continued to make payments to, and receive funding from, the EU in 2020-21 under transitional arrangements. These transactions largely ended in 2021-22, but as per the Withdrawal Agreement, it continues to makes payments for its outstanding commitments through the EU Financial Settlement. However, these payments are not scored as EU transactions, but instead are classed as spending on public and common services. Scotland is allocated a population share of this spending in GERS, and this is reflected in an increase in Other UK Government current expenditure on public and common services in Table 3.8a above.
Further details on the EU Financial Settlement are available from:
Brexit: the financial settlement - a summary - House of Commons Library (parliament.uk)
Scotland did not contribute directly to the EU budget. In GERS, Scotland is assigned an estimated share of the UK contribution. In contrast, Scotland received funding directly from the EU, through the Common Agricultural Policy, European Structural Funds, and European Regional Development Funding. Actual amounts are used for these items.
The EU Transactions lines in the tables above are produced on a National Accounts basis, and exclude traditional own resource payments. These are payments collected by the UK on behalf of the EU, and therefore are excluded from the UK Public Sector Finances. However, they are normally included when reporting on the UK's net contribution to EU budgets. Table 3.9 shows net payments to the EU including these contributions.
Funding the EU Budget
There are three key sources of funding for the EU, which come from each member state:[24]
- Traditional own resource (TOR) - Agriculture duties and customs duties levied on agriculture and non-agriculture products from outside the EU
- VAT based own resource – Calculated as a percentage of countries' VAT tax base.
- Gross National Income (GNI) based own resource – Calculated as a percentage of countries' GNI. This is the EU's single largest source of revenue.
Since 1985, the UK received a rebate on its contribution, broadly equal to 66% of its net contribution in the previous year. Scotland is apportioned a population share of the rebate.
Net Contribution to the EU
The UK's net contribution to the EU is calculated as the difference between the UK's gross contribution to the EU budget (less the rebate) and public sector EU receipts.
The table below sets out these transactions for Scotland and the UK.
| Scotland | UK | |||||||||
|---|---|---|---|---|---|---|---|---|---|---|
| 2017-18 | 2018-19 | 2019-20 | 2020-21 | 2021-22 | 2017-18 | 2018-19 | 2019-20 | 2020-21 | 2021-22 | |
| GNI based contribution | 966 | 1,195 | 1,064 | 887 | 11 | 11,761 | 14,599 | 13,003 | 12,762 | 139 |
| UK abatement | -374 | -397 | -339 | -279 | 15 | -4,547 | -4,846 | -4,149 | -3,785 | 181 |
| VAT-based contribution to the EU | 244 | 257 | 220 | 183 | -0 | 2,974 | 3,138 | 2,696 | 1,954 | -4 |
| Expenditure transfers to the EU | 837 | 1,055 | 945 | 791 | 26 | 10,188 | 12,892 | 11,549 | 10,930 | 315 |
| Receipts to cover collection costs of TOR | -57 | -54 | -54 | -39 | -1 | -698 | -664 | -663 | -585 | -10 |
| TOR | 280 | 270 | 271 | 220 | 4 | 3,413 | 3,304 | 3,320 | 2,695 | 49 |
| EU Financial Settlement (EUFS) net payments | -20 | 665 | -249 | 8,124 | ||||||
| Gross contribution to the EU budget | 1,060 | 1,271 | 1,162 | 972 | 29 | 12,903 | 15,531 | 14,206 | 12,791 | 8,478 |
| Public sector EU receipts | -364 | -401 | -418 | -157 | -180 | -4,130 | -4,378 | -5,059 | -3,346 | -2,136 |
| Net contributions to the EU budget | 695 | 870 | 744 | 815 | -151 | 8,773 | 11,154 | 9,147 | 9,445 | 6,343 |
| EU transactions (net contributions to EU institutions less TOR and EUFS) | 415 | 600 | 473 | 595 | -155 | 5,360 | 7,850 | 5,827 | 6,999 | -1,830 |
Box 3.3: Private Finance Initiative and Non-Profit Distributing Financing support for Public Private Partnerships (PPPs)
This box gives an introduction to Public Private Partnerships (PPPs) and the funding models that have been used in Scotland. It also breaks down unitary charge payments by scheme type, by type of procuring authority and by the sector of the project. This analysis uses sources of publicly available data, all brought together into an accompanying spreadsheet. The spreadsheet is available from the GERS website.
Introduction to PFI, PPPs, and NPD
Public Private Partnerships (PPPs) are long-term contracts for services that include the provision of associated facilities or properties. Under the contract, the private sector is generally responsible for various roles, including designing and constructing a building or facility, and maintaining and servicing it throughout the contract term. The public sector retains accountability for the main public services. The private sector is responsible for financing the project up front and only receives payment from the public sector once construction has been completed and the services have commenced.
The Private Finance Initiative (PFI) used to be the UK's preferred form of PPP. In Scotland, the Non-Profit Distributing (NPD) model has been the Scottish Government's preferred procurement option since 2007. For more information on these schemes, and the data sources used in this box, please see the Scottish Government website:
Infrastructure investment - Government finance - gov.scot (www.gov.scot)
Unitary Charge Payments
Payments for both PFI and NPD projects take the form of a unitary charge which is usually paid annually over the lifetime of the contract. It is worth emphasising that these payments are already fully reflected in the GERS spending figures. In addition, the table below includes Ministry of Defence projects in Scotland which are procured by and entirely funded by the Ministry of Defence. Scotland is assigned a population share of this expenditure in GERS. Unitary charge payments cover repayment of capital, interest payments, and in some cases service charge payments. Figures are shown here for the years 2015-16 to 2021-22 to be consistent with other tables in this report. The underlying spreadsheets on the GERS website have data covering the period back to 1998-99 as well as estimated payments into the 2040s. Additional information about the individual procuring authority (e.g. individual local authority and health board information) and comparisons with the UK are also provided.
| £ million | |||||
|---|---|---|---|---|---|
| 2017-18 | 2018-19 | 2019-20 | 2020-21 | 2021-22 | |
| By scheme type | |||||
| Private Finance Initiative | 1,013 | 1,027 | 1,046 | 1,060 | 1,063 |
| Non-Profit Distributing models1 | 189 | 262 | 330 | 353 | 360 |
| Total Unitary Charge payments | 1,202 | 1,289 | 1,376 | 1,413 | 1,423 |
| By procuring authority | |||||
| Further Education | 35 | 35 | 35 | 35 | 36 |
| Local Government | 548 | 585 | 606 | 640 | 641 |
| NHS | 273 | 298 | 327 | 340 | 349 |
| Other Scottish Government | 169 | 191 | 224 | 213 | 214 |
| Ministry of Defence | 26 | 26 | 24 | 22 | 21 |
| Scottish Water | 151 | 155 | 160 | 162 | 162 |
| Total Unitary Charge payments | 1,202 | 1,289 | 1,376 | 1,413 | 1,423 |
| By sector of project | |||||
| Energy | 5 | - | - | - | - |
| Further Education | 35 | 35 | 35 | 35 | 36 |
| Health | 273 | 298 | 327 | 340 | 349 |
| IT | - | - | - | - | - |
| Ministry of Defence | 26 | 26 | 24 | 22 | 21 |
| Offices | 3 | 3 | 3 | 3 | 3 |
| Police | 4 | 5 | 5 | 5 | 5 |
| Prisons | 47 | 48 | 50 | 52 | 52 |
| Schools | 502 | 545 | 565 | 599 | 600 |
| Transport | 138 | 158 | 190 | 177 | 178 |
| Waste | 169 | 172 | 178 | 180 | 180 |
| Total Unitary Charge payments | 1,202 | 1,289 | 1,376 | 1,413 | 1,423 |
| UK Total Unitary Charge Payments | 10,773 | 10,158 | 10,212 | 10,045 | 9,896 |
| Scotland as % UK | 11.2% | 12.7% | 13.5% | 14.1% | 14.4% |
1 Non-profit distributing models includes projects delivered by the hub model and projects commissioned prior to 2010. Further detail is available at: Infrastructure investment - Government finance - gov.scot (www.gov.scot)
Source: HM Treasury and Scottish Government figures. See the accompanying spreadsheet for full details of all sources
Contact
Email: economic.statistics@gov.scot