Government Expenditure & Revenue Scotland (GERS) 2021-22
Government Expenditure and Revenue Scotland (GERS) is a National Statistics publication. It reports estimates of the revenue raised in Scotland and the cost of public services provided for Scotland.
Chapter 2 North Sea Revenue
Introduction
In GERS, the term North Sea is used to refer to all offshore oil and gas activity. North Sea revenue in GERS comes from three sources: petroleum revenue tax, corporation tax, and licence fees.
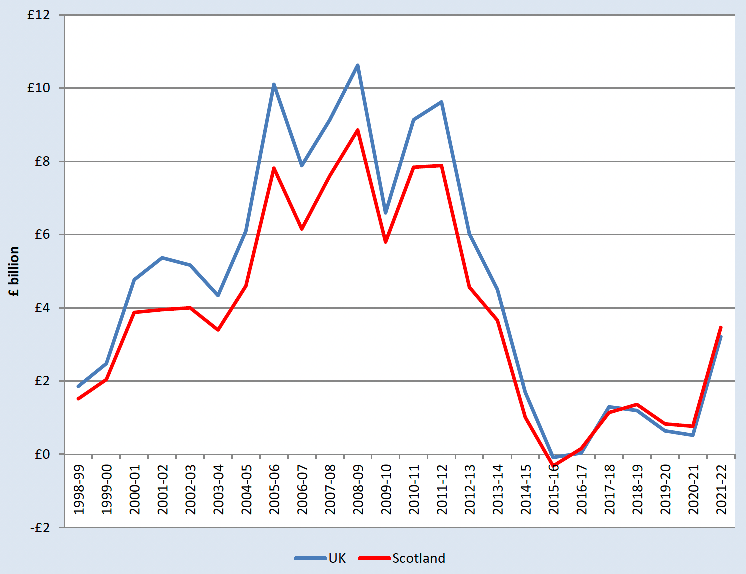
Table 2.1 shows the revenue raised from each component of North Sea revenue since 2017‑18. UK North Sea revenue was £1.3 billion in 2017-18, and gradually declined to £0.5 billion in 2020-21, reflecting declines in corporation tax receipts. However, driven by large increases in oil and gas prices, receipts increased by £2.7 billion in 2021-22 to reach £3.2 billion, their highest level since 2013-14.
| £ million | |||||
|---|---|---|---|---|---|
| 2017-18 | 2018-19 | 2019-20 | 2020-21 | 2021-22 | |
| Licence fees | 72 | 73 | 68 | 72 | 72 |
| North Sea corporation tax | 1,793 | 1,867 | 984 | 691 | 3,697 |
| Petroleum revenue tax | -568 | -744 | -409 | -241 | -555 |
| Total | 1,297 | 1,196 | 643 | 522 | 3,214 |
North Sea revenue is subject to annual fluctuations and is driven by a number of factors, including the oil price, the sterling dollar exchange rate, production, operating expenditure, capital investment, and the prevailing fiscal regime.
During 2021-22 there were sustained increases oil and gas prices. The oil price increased from $18.38 per barrel in April 2021 to $117.25 in March 2022, whilst gas prices rose from 55 p per therm to 314p. Initially, these increases reflected increases in demand for oil and gas as economic restrictions associated with from COVID-19 were lifted, accompanied by an emerging supply gap in the global market as production and global supplies were slow to increase in line with demand in the global market. This was reflected with oil priced at $70 per barrel and gas above 200 pence per therm by December 2021. In March 2022, the escalation of the Russian-Ukraine conflict resulted in international sanctions and a reduction in supplies from Russia, a key market player, and prices increased further. as countries switched their imports to alternative markets and the competition for supplies increased.[13] [14] [15]
Overall North Sea production of oil and gas fell by 16.8% in 2021 to 76 million tons of oil equivalent.[16] Falls were similar across both commodities, with oil production falling by 16.6% and gas by 17.2%.
In 2021 total expenditure on the UK Continental Shelf increased by 4% in real terms compared to 2020, to stand at £12.15 billion. The increase was primarily due to an increase in exploration and appraisal (E&A) and decommissioning, which were up 16% and 18% respectively in real terms. Capital expenditure decreased by 11% and operating costs increased 10% respectively in real terms.[17]
The UK fiscal regime in 2021-22 consisted of offshore Ring Fence Corporation Tax (RFCT) at 30%, Petroleum Revenue Tax (PRT) at 0% and a Supplementary Charge (SC) of 10%.[18] On May 2022, the UK Government introduced a new Energy Profits Levy, which is an additional 25% tax on UK oil and gas profits on top of the existing 40% headline rate of tax, taking the combined rate of tax on profits to 65%.[19]
As shown in Table 2.1, PRT receipts are now negative. This reflects the fact that, although companies no longer pay PRT, they can still claim refunds on PRT paid in previous years against current trading losses and decommissioning spending. As a result, PRT receipts will only be negative in the future under the current tax regime.[20]
Scotland's Share of North Sea Revenue
In the ONS Regional Accounts, the UK continental shelf is not allocated to specific geographic regions, but is considered a separate region of the UK (the extra-regio territory). As such, an assumption as to Scotland's share of the North Sea needs to be made in GERS.
Two estimates of Scotland's share of North Sea revenue are shown in GERS:
1. A population share
2. An illustrative geographical share
The discussion below focuses on population and geographical shares.
Population Share
One interpretation of North Sea revenue is to view it as a non-identifiable UK revenue, in which case a population share may be apportioned to Scotland. Table 2.2 provides an estimate of Scotland's share of North Sea revenue under this approach.
| £ million | |||||
|---|---|---|---|---|---|
| 2017-18 | 2018-19 | 2019-20 | 2020-21 | 2021-22 | |
| Total North Sea revenue | 1,297 | 1,196 | 643 | 522 | 3,214 |
| Scotland's population share | 106 | 98 | 53 | 43 | 262 |
| Scotland's share of North Sea revenue (%) | 8.2% | 8.2% | 8.2% | 8.1% | 8.1% |
An Illustrative Geographical Share
An alternative approach is to apportion a geographical share of North Sea revenue to Scotland. In order to estimate this share, GERS uses the share reported in the ONS Country and Regional Public Sector Finances publication. The estimate is based on the median line principle as employed in 1999 to determine the boundary between Scotland and the rest of the UK for fishery demarcation purposes. Other alternatives are possible. Production, costs and revenue are allocated on a field by field basis to either the rest of the UK or Scotland using this boundary.
Table 2.3 shows Scotland's illustrative geographical share of UK North Sea revenue, broken down by licence fees, corporation tax, and petroleum revenue tax. Since 2018-19, Scotland's illustrative geographical share of North Sea revenues is estimated to be above 100%. This reflects the fact that the Scotland's share of petroleum revenue tax, which is currently negative, is lower than its share of corporation tax.
Following the rise in oil and gas prices in 2021-22, North Sea receipts have risen to their highest level since 2013-14. This reduces the importance of tax refunds in overall tax receipts, which had led to Scotland's share of corporation tax receipts rising to above 100% since 2019-20. This rise in taxes is expected to reverse the recent increases in Scotland's share of North Sea corporation tax from the high seen in 2020-21.
| £ million | |||||
|---|---|---|---|---|---|
| 2017-18 | 2018-19 | 2019-20 | 2020-21 | 2021-22 | |
| UK revenue | 1,297 | 1,196 | 643 | 522 | 3,214 |
| Licence fees | 72 | 73 | 68 | 72 | 72 |
| North Sea corporation tax | 1,793 | 1,867 | 984 | 691 | 3,697 |
| Petroleum revenue tax | -568 | -744 | -409 | -241 | -555 |
| Scottish geographical revenue | 1,141 | 1,361 | 833 | 765 | 3,464 |
| Licence fees | 64 | 64 | 70 | 84 | 72 |
| North Sea corporation tax | 1,585 | 1,634 | 999 | 812 | 3,697 |
| Petroleum revenue tax | -507 | -337 | -236 | -131 | -305 |
| Scottish share of UK | 88.0% | 113.8% | 129.5% | 146.6% | 107.8% |
| Licence fees | 88.4% | 88.0% | 103.1% | 117.0% | 100.0% |
| North Sea corporation tax | 88.4% | 87.5% | 101.5% | 117.5% | 100.0% |
| Petroleum revenue tax | 89.2% | 45.3% | 57.7% | 54.3% | 54.9% |
Scotland's estimated geographical share of the North Sea sector, used in this report, is highlighted in the figure below.
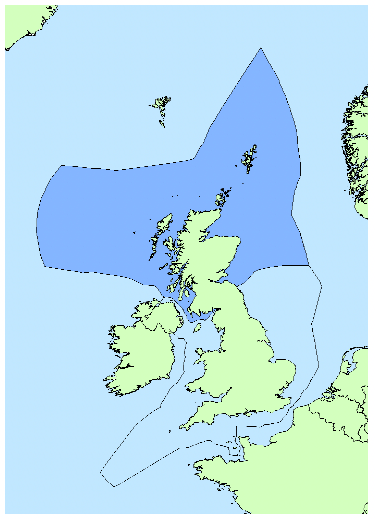
Source: Marine Scotland
Contact
Email: economic.statistics@gov.scot