Government Expenditure & Revenue Scotland (GERS) 2021-22
Government Expenditure and Revenue Scotland (GERS) is a National Statistics publication. It reports estimates of the revenue raised in Scotland and the cost of public services provided for Scotland.
Summary
Introduction
- Government Expenditure and Revenue Scotland (GERS) addresses three questions about Scotland's public sector finances under the current constitutional arrangements:
- What revenues were raised in Scotland?
- How much did the country pay for the public services that were consumed?
- To what extent did the revenues raised cover the costs of these public services?
- The results for this year's publication continue to be affected by the coronavirus pandemic, which had an ongoing and significant impact on global public sector finances in 2021-22, as well as public health and the wider economy. The final impact of the pandemic on public sector finances is still being assessed, and the estimates in the publication are subject to greater uncertainty than in previous years. This is discussed in more detail in the Preface.
- GERS is a National Statistics publication. It is assessed by the independent UK Statistics Authority to ensure that it meets the standards set out in the Code of Practice for Statistics.
- Feedback from users of the publication is welcome. A correspondence address is available in the back leaf of the publication. Comments can be emailed to economic.statistics@gov.scot.
Scotland's Overall Fiscal Position
- GERS provides two measures of Scotland's fiscal position, the net fiscal balance and the current budget balance.
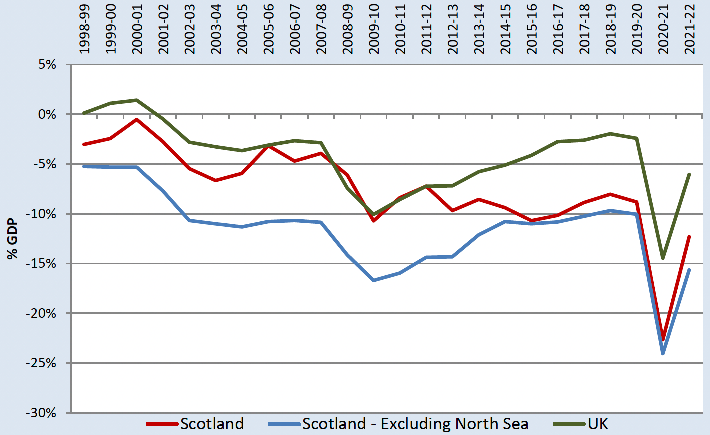
- The net fiscal balance measures the difference between total public sector expenditure and public sector revenue. It therefore includes public sector capital investment, such as the construction of roads, hospitals, and schools, which yields benefits not just to current taxpayers but also to future taxpayers. It is shown in Table S.1 below. In 2021-22, Scotland's net fiscal balance was -12.3%, compared to -22.7% in 2020-21.
| £ million | |||||
|---|---|---|---|---|---|
| 2017-18 | 2018-19 | 2019-20 | 2020-21 | 2021-22 | |
| Scotland | -15,071 | -14,418 | -15,902 | -35,774 | -23,727 |
| Scotland - Excluding North Sea | -16,213 | -15,778 | -16,735 | -36,539 | -27,191 |
| As % of GDP | |||||
| Scotland | -8.9% | -8.1% | -8.8% | -22.7% | -12.3% |
| Scotland - Excluding North Sea | -10.3% | -9.7% | -10.1% | -24.1% | -15.7% |
| UK | -2.6% | -2.0% | -2.4% | -14.5% | -6.1% |
- The deficit on the net fiscal balance as a share of GDP has decreased for both Scotland and the UK in 2021-22, by 8.4 percentage points for the UK and 10.3 percentage points for Scotland. This reflects the partial reversal of the initial impacts of COVID-19, which saw falls in revenue, increased expenditure, and falls in GDP. However, during 2021-22 as a whole, economic activity continued to be suppressed by COVID-19, and this, combined with ongoing support schemes, means that the net fiscal balance remains significantly larger than its pre-pandemic level.
- The difference in the magnitude of change in the net fiscal balance for Scotland and the UK is primarily explained by the contribution of North Sea revenue and activity. North Sea revenue, which affects Scotland's fiscal position more than the UK's, grew by £2.7 billion in 2021‑22, to reach its highest level since 2013-14.
- Excluding North Sea revenue, the net fiscal balance for Scotland fell by 8.4 percentage points, in line with the UK.
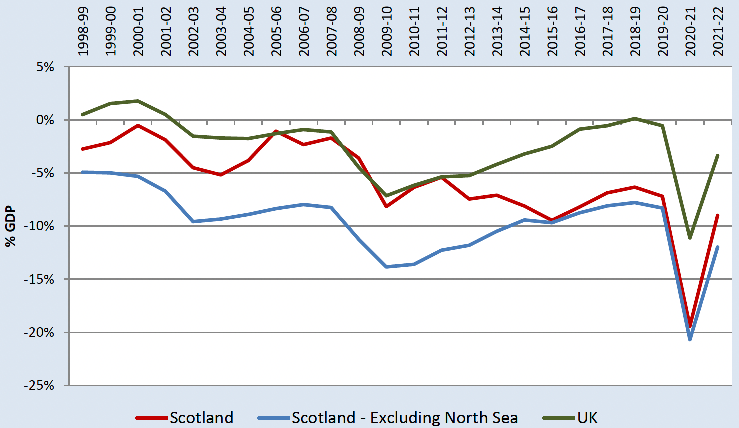
- The current budget balance shows the difference between revenue and current expenditure only. It therefore excludes public sector capital investment. It measures the degree to which taxpayers meet the cost of paying for day‑to-day public services, excluding capital investment. It is shown in Table S.2 below.
- The current budget balance for Scotland tends to move in line with the net fiscal balance figure but is typically around 2 percentage points smaller as a share of GDP, although this gap has increased during the pandemic. In 2021-22, the deficit on the Scottish current budget balance excluding the North Sea decreased by 8.7 percentage points.
| £ million | |||||
|---|---|---|---|---|---|
| 2017-18 | 2018-19 | 2019-20 | 2020-21 | 2021-22 | |
| Scotland | -11,686 | -11,347 | -13,021 | -30,670 | -17,352 |
| Scotland - Excluding North Sea | -12,827 | -12,708 | -13,854 | -31,435 | -20,816 |
| As % of GDP | |||||
| Scotland | -6.9% | -6.3% | -7.2% | -19.4% | -9.0% |
| Scotland - Excluding North Sea | -8.1% | -7.8% | -8.3% | -20.7% | -12.0% |
| UK | -0.6% | 0.1% | -0.6% | -11.1% | -3.4% |
- The charts below show the estimates of the current budget balance and net fiscal balance for Scotland and the UK since 1998-99. Figures for all tables back to 1998-99 are available in the accompanying spreadsheets online.
Scotland's revenue
- Table S.3 shows two estimates of Scotland's public sector revenue: (i) all Scottish revenue, and (ii) excluding North Sea revenue.
- Scotland's estimated non-North Sea revenue in 2021-22 grew by £8.4 billion to £70.3 billion. This was an increase of 13.6% from 2020-21, the largest increase recorded. This follows the largest fall recorded last year, and reflects the reversal of the falls in revenue caused by the pandemic. Growth was particularly strong in VAT, non-domestic rates, fuel duties, and income tax and national insurance contributions. Non‑North Sea revenue for the UK grew by 15.0%.
- As a share of GDP, non-North Sea revenue fell slightly to 40.5%, as nominal GDP rose faster than revenue.
- Scotland's non-North Sea revenue was 7.7% of total UK revenue in 2021-22, lower than 2020-21 and the lowest share on record. This fall the share was in part due to relatively weaker performance in income tax receipts and non-domestic rates income, with the latter in part being affected by the different timing and coverage of reliefs in Scotland compared to other parts of the UK.
- Including an illustrative geographical share of the North Sea, total Scottish revenue was £73.8 billion, an increase of 17.6% from 2020-21. This is larger than the increase in non‑North Sea revenue, reflecting the fact that Scottish North Sea revenue grew by £2.7 billion in 2021-22, as prices rose after falling during the pandemic.
- Including an illustrative geographical share of the North Sea, Scottish revenue was 8.0% of the UK total, and at its highest level since 2014-15.
| £ million | |||||
|---|---|---|---|---|---|
| 2017-18 | 2018-19 | 2019-20 | 2020-21 | 2021-22 | |
| Scotland | 62,315 | 65,114 | 66,057 | 62,665 | 73,776 |
| Scotland - Excluding North Sea | 61,174 | 63,754 | 65,225 | 61,900 | 70,311 |
| As % of UK total revenue | |||||
| Scotland | 8.0% | 8.0% | 8.0% | 7.9% | 8.0% |
| Scotland - Excluding North Sea | 7.8% | 7.8% | 7.9% | 7.8% | 7.7% |
| As % of GDP | |||||
| Scotland | 36.7% | 36.4% | 36.6% | 39.7% | 38.3% |
| Scotland - Excluding North Sea | 38.7% | 39.1% | 39.2% | 40.7% | 40.5% |
| UK | 37.0% | 37.0% | 36.7% | 37.1% | 38.6% |
- Table S.4 below shows estimates of revenue per person for Scotland and the UK. Excluding North Sea revenue, revenue per person in Scotland is lower than the UK average by £805 in 2021-22.
- Including an illustrative geographical share of North Sea revenue, the difference between revenue per person in Scotland and the UK is more variable. In the latest year, including an illustrative geographical share of North Sea revenue, revenue per person was £221 lower than the UK average.
| £ per person | |||||
|---|---|---|---|---|---|
| 2017-18 | 2018-19 | 2019-20 | 2020-21 | 2021-22 | |
| Scotland | |||||
| Scotland - Including North Sea revenue | 11,480 | 11,960 | 12,090 | 11,457 | 13,463 |
| Scotland - Excluding North Sea revenue | 11,270 | 11,710 | 11,937 | 11,317 | 12,831 |
| UK | |||||
| UK - Including North Sea revenue | 11,813 | 12,237 | 12,402 | 11,852 | 13,684 |
| UK - Excluding North Sea revenue | 11,794 | 12,219 | 12,393 | 11,844 | 13,636 |
| Difference (Scotland minus UK) | |||||
| Including North Sea revenue | -333 | -277 | -313 | -395 | -221 |
| Excluding North Sea revenue | -524 | -509 | -456 | -527 | -805 |
Scotland's spending
- Table S.5 below shows estimates of public spending for Scotland. Expenditure fell from £98.5 billion in 2020-21 to £97.5 billion in 2021-22. This is the largest recorded fall in public expenditure, although it follows a record increase in 2020-21 in response to the coronavirus pandemic, and spending remains at historically high levels.
- The decline in spending reflects a reduction in spending associated with coronavirus support schemes, although direct health spending was largely unchanged. Overall, the Scottish Government spent £5.7 billion in response to the coronavirus pandemic in 2021‑22, down from £8.8 billion in 2020-21. Scotland received at least a further £3.7 billion in reserved spending in response to the pandemic in 2021-21, down from £9.4 billion in 2020-21.
- Although spending on the pandemic fell in 2021-22, this has mostly been offset by increases in the cost of servicing public sector debt.
- Looking at spending relative to the size of the economy highlights the extent to which spending remains elevated. Although spending as a share of GDP has fallen from the peaks seen during 2020-21, it remains above 50% of GDP, and around 5 percentage points higher than prior to the pandemic.
| 2017-18 | 2018-19 | 2019-20 | 2020-21 | 2021-22 | |
|---|---|---|---|---|---|
| Scotland - £ millions | 77,387 | 79,532 | 81,960 | 98,439 | 97,502 |
| Share of UK (%) | 9.3% | 9.3% | 9.3% | 8.9% | 9.2% |
| As % of GDP | |||||
| Scotland | 45.6% | 44.4% | 45.4% | 62.3% | 50.6% |
| Scotland - Excluding North Sea revenue | 48.9% | 48.8% | 49.2% | 64.8% | 56.1% |
| UK | 39.6% | 39.0% | 39.1% | 51.6% | 44.6% |
- Table S.6 below shows estimates of expenditure per person for Scotland and the UK. Expenditure for Scotland has been consistently higher per person than the UK average over the period.
| £ per person | |||||
|---|---|---|---|---|---|
| 2017-18 | 2018-19 | 2019-20 | 2020-21 | 2021-22 | |
| Scotland | 14,257 | 14,608 | 15,000 | 17,998 | 17,793 |
| UK | 12,647 | 12,887 | 13,222 | 16,468 | 15,830 |
| Difference (Scotland minus UK) | 1,610 | 1,721 | 1,778 | 1,530 | 1,963 |
Box S.1: GERS Frequently Asked Questions
Below is a summary of some of the most frequently asked questions and their answers.
Q: Why have the GERS numbers changed from last year?
A: The estimates in GERS are updated every year to reflect the latest data and methodologies. Often, the changes reflect updates to UK figures in the UK Public Sector Finances.
Q: How much interest expenditure does Scotland have in GERS?
A: GERS includes two categories of interest spending. The first is reserved UK debt interest, and Scotland is allocated a population share of this, amounting to £4.5 billion in 2021-22. The second is interest spending associated with public sector pension funds. These funds also generate interest income, and in 2021-22 Scotland is apportioned £2.3 billion of interest expenditure associated with public sector pensions, and £1.8 billion of interest income.
Q: How much spending occurs in Scotland?
A: As set out in the Preface, GERS shows spending for Scotland, rather than spending in Scotland. This shows that around 9.2% of UK spending is undertaken for Scotland, slightly higher than a population share. While direct estimates of spend in Scotland are not available, this is consistent with broader indicators of public sector activity in Scotland, which show that the public sector plays a larger role in Scotland than the UK as a whole. For example, around 10% of UK public sector employees are based in Scotland, with regional pay differences resulting in around 9.3% of the UK paybill spent in Scotland.
As GERS shows spending for Scotland, not all spending that occurs in Scotland is included in the GERS spending figures. For example, around £100 million of Scottish Government expenditure is not included GERS, as it is assumed to benefit residents outside of Scotland, such as spending on museums in Scotland which benefits visitors from the rest of the UK.
Q: Is GERS a description of the whole Scottish economy?
A: No. GERS reports only on public sector revenue and expenditure. Although these may be affected by economic performance, GERS does not directly report on Scotland's wider economy. If users are interested in the measurement of the economy as a whole, they should refer to other economic statistics products, such as the quarterly Gross Domestic product figures or Quarterly National Accounts Scotland (QNAS) (About GDP), These publications provide estimates of real terms growth in the economy, and GDP in cash or nominal terms and its components.
Q: What is the public sector?
A: The public sector contains all government bodies, and all bodies which are controlled by government. This includes publicly controlled businesses, such as Scottish Water and the Bank of England. In GERS, the Scottish Government, Scottish Local Authorities, and the public corporations they control such as Scottish Water, are referred to as Scottish public sector bodies. All other UK public sector bodies are described as 'Other UK Government bodies'.
Q: Who produces GERS?
A: GERS is produced by Scottish Government statisticians. It is designated as a National Statistics product, which means that it is produced independently of Scottish Ministers and has been assessed by the UK Statistics Authority as being produced in line with the Code of Practice for Statistics. This means the statistics have been found to meet user needs, to be methodologically sound, explained well and produced free of political interference.
Q: Do you use company headquarters to assign corporation tax or taxes like VAT or insurance?
A: No. Corporation tax on trading profits is estimated on a company-by-company basis, depending on the economic activity each company has in Scotland, not location of company headquarters. VAT, and other taxes such as those related to insurance activity, are related to expenditure, and are therefore estimated based on expenditure that occurs in Scotland, rather than the location of a company's head office.
Q: How do taxes from the whisky industry feature in the GERS estimates?
A: Like any industry, the whisky industry's activity in Scotland generates tax revenue through a range of sources, such as corporation tax on profits, income tax and national insurance contributions on staff earnings, and non-domestic rates payments on business premises. These are all captured in the estimates of Scottish public sector receipts reported in GERS.
In addition, whisky consumed in the UK is subject to VAT and alcohol duty. This is assigned to Scotland on the basis of how much is consumed in Scotland. Whisky which is exported does not generate UK VAT or alcohol duty. There is no export duty in the UK.
Q: What are accounting adjustments and why do they feature in the GERS estimates?
A: Accounting adjustments are used to present revenue and expenditure on a National Accounts basis, an international reporting standard used by governments. They normally reflect non-cash items, such as depreciation or pensions liabilities. In general, these adjustments do not affect the net fiscal balance or current budget balance, as they are added to both revenue and expenditure. In 2021-22, accounting adjustments added £7.5 billion to the estimate of Scottish public sector revenue and £9.6 billion to the estimate of Scottish public sector spending, with the difference primarily being due to coronavirus expenditure included in the accounting adjustments. For more information on accounting adjustments and where they appear in the revenue tables, see Table A.9.
Contact
Email: economic.statistics@gov.scot