Fair Start Scotland - evaluation report 5: participant phone survey - years 4 and 5 - November 2023
Part of a series of reports on the evaluation of Fair Start Scotland (FSS) employability service. The report presents findings from a representative phone survey with FSS participants. The report covers years 4 and 5 (April 2021 to March 2023) of FSS delivery.
8. 2020 cohort: Outcomes over time
The 2020 cohort joined Fair Start Scotland (FSS) between January and December 2020, and was first surveyed at Wave 3 in March 2021, and then followed up in the Wave 4 survey in December 2022 – January 2023. At Wave 3, 663 participants were interviewed, 250 of whom were also interviewed at Wave 4.
On average, 2 and a half years (30.1 months) had passed between these participants joining the FSS service and taking part in the Wave 4 survey[38]. The length of time between joining the service and completing the Wave 4 survey ranged from 25.5 months to 34.5 months, meaning it had been at least 2 years for all participants.
This chapter explores the experiences of the 250 participants who completed both survey waves, covering working status, quality of work and employment history. It then reports on the change in outcomes and motivation for this cohort. On some occasions sub-group base sizes were too low to conduct significance testing – where subgroups are not mentioned in analysis it is for this reason.
8.1 Employment status of the 2020 cohort
This section will look at the working status of the 2020 cohort at the point of the Wave 4 survey and the quality of work that they undertook, and compare this to their previous answers from the Wave 3 survey. The Wave 4 answers provide a snapshot of participants’ activities in December 2022 and January 2023 when the survey was conducted and do not represent FSS employment outcomes[39].
The 2020 cohort saw an improvement in their working status between Waves 3 and 4, as shown in Figure 40 Figure 40. Survey participants were significantly more likely to be working for an employer in a paid role, and less likely to be out of work at Wave 4 compared to Wave 3. Whilst only a third (36 per cent) of this cohort were working for an employer at Wave 3, over half were at Wave 4 (59 per cent). This is in line with the drop in those not working from Wave 3 (52 per cent) to Wave 4 (32 per cent). The proportions of the cohort in education or training, in self-employment, and due to start work in the next month remained stable between waves.
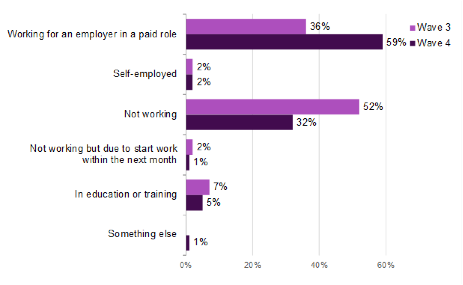
Source: IFF Research telephone survey of FSS customers. A1. Which of the following best describes what you are doing at the moment? Base: 2020 cohort Wave 3 (250) Wave 4 (250). ‘Not working’ combines ‘Not working and claiming an out-of-work benefit’ and ‘Not working and not claiming an out-of-work benefit’ at Wave 3, and the following at Wave 4: ‘Unemployed and looking for work’, ‘Not in employment because of sickness or disability’, ‘Looking after the home or family full time’, ‘Caring for an adult relative or friend with a disability or long term illness’, ‘Working in a voluntary or other unpaid role’, ‘Retired and/or claiming a pension’
As shown in Figure 41, participants who were not working tended to be either unemployed and looking for work (14 per cent) or not in employment because of sickness or disability (12 per cent). 37
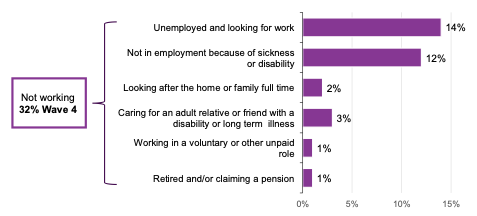
Source: IFF Research telephone survey of FSS customers. A1. Which of the following best describes what you are doing at the moment? Base: 2020 cohort Wave 4 (250)
Participants who selected an option other than working for an employer or self-employed, were asked if they had done any paid work in the last week, to capture those who might work part time or ad-hoc hours. As shown in Figure 42, by combining this with those working for an employer and in self-employment, a total of 63 per cent of participants had worked in the week prior to the survey at Wave 4. This compares to 41 per cent at Wave 3, a significant increase.
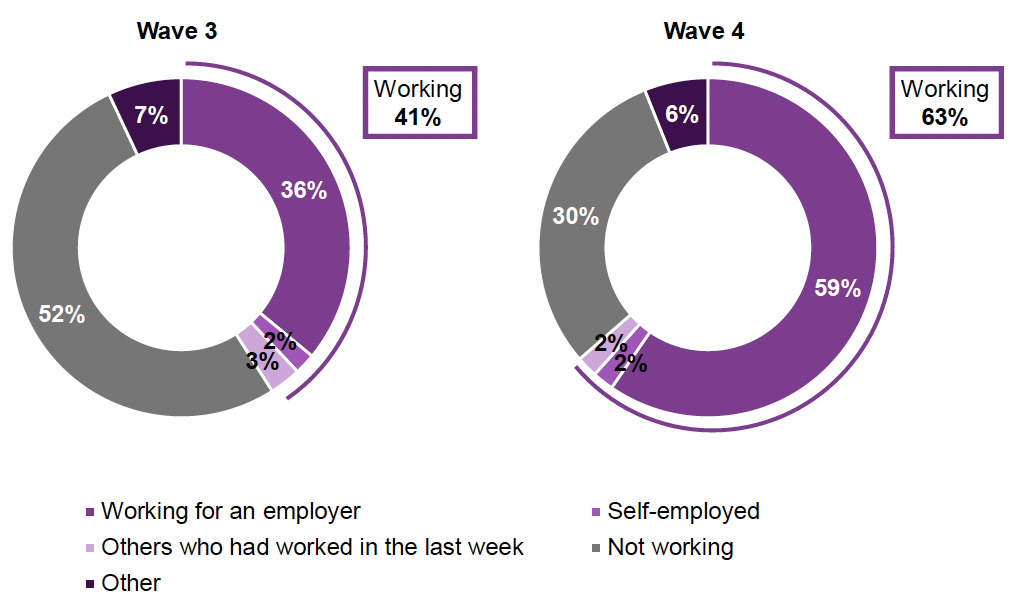
Source: IFF Research telephone survey of FSS customers. A1. Which of the following best describes what you are doing at the moment? Base: 2020 cohort Wave 3 (250) Wave 4 (250). A1A. Did you do any paid work in the seven days prior to the interview? Base: 2020 cohort Wave 3 (157) Wave 4 (98)
Within the FSS service, participants working for 16 hours or more are classed as achieving an employment outcome, whilst those working fewer than 16 hours per week are still classed as not working and remain eligible for pre-employment support. For this reason, the survey asked participants how many hours they worked per week. However, participants who work fewer than 16 hours per week can still expect to receive elements of in-work support to help progression into sustainable employment. This distinction is therefore made for the purposes of assessing whether or not participants have achieved an employment outcome rather than restricting access to support. Taking this into account, around two fifths (42 per cent) of the 2020 cohort were at the ‘pre-employment’ stage (working less than 16 hours per week) at Wave 4, with over half (58 per cent) in-work (working 16 or more hours per week).
At Wave 4, the following groups were more likely to be in work:
- participants without health conditions (69 per cent), or where their health condition did not limit their day to day activity (69 per cent), compared to those whose health conditions limited their daily activity a little or a lot (46 per cent)
- participants with degree level education or above compared to those without a degree (75 per cent vs 53 per cent)
- there were no significant differences between male and female participants, between participants belonging to a priority family and those who don’t, and between parents and non-parents. Subgroup sizes were not large enough to make comparisons beyond these
The 2020 cohort were asked about their employment situation at Wave 3 and Wave 4, meaning we can look at the overall movement of working status for these participants between Waves, as shown in Figure 43.
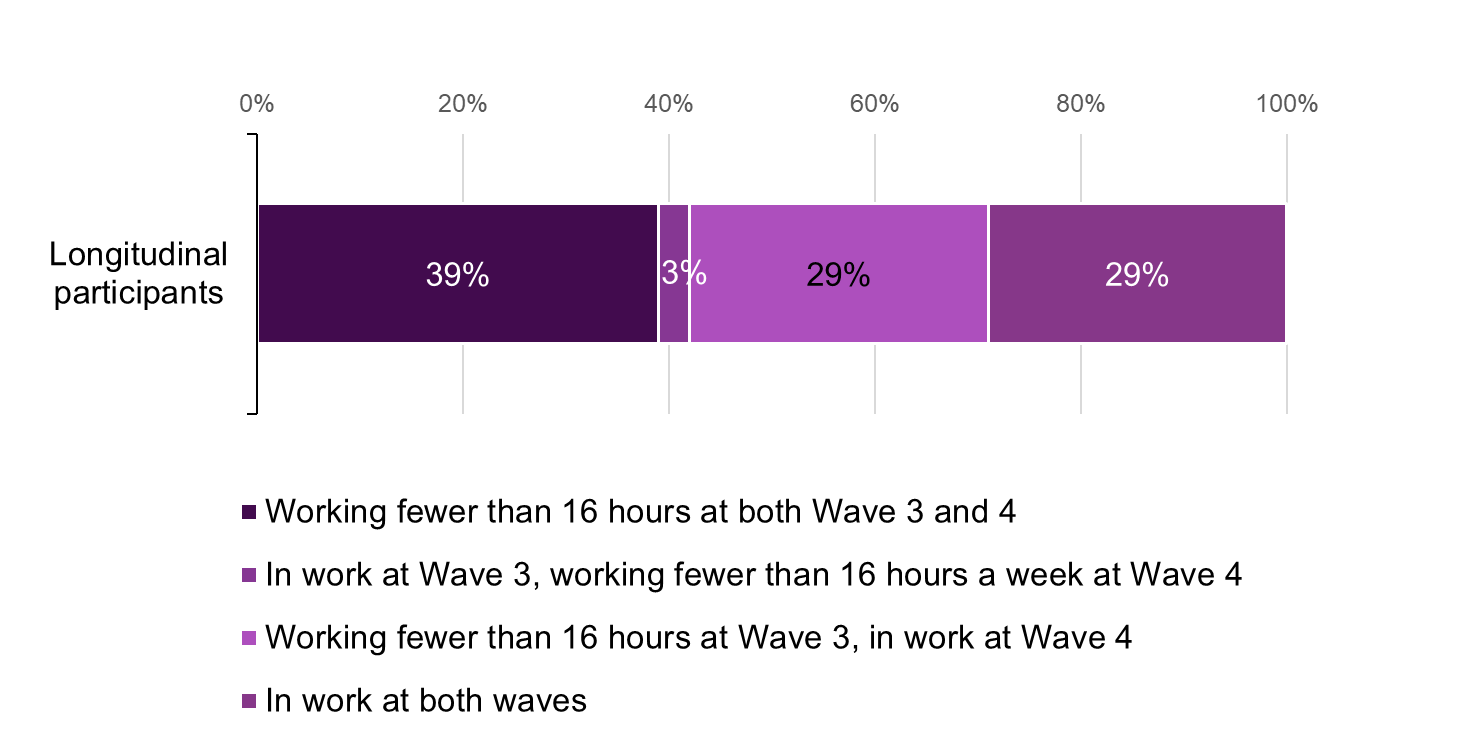
Source: IFF Research telephone survey of FSS customers. Combination of A1_W3/W4. Which of the following best describes what you are doing at the moment? And A3_W3/W4. How many hours per week do you usually work, or spend in education? Base: 2020 cohort (250)
Those aged 35 to 49 were less likely than average to have moved into work during this period (19 per cent), and more likely than average to have moved out of work (7 per cent). Participants whose health conditions affected their day to day activities were significantly more likely to have been out of work at both waves (49 per cent), and those without a health condition were more likely to have been in employment at both waves (46 per cent). Those with an education of degree level or above were more likely to be in employment at both stages (44 per cent).
The 2020 cohort were asked what they had mostly been doing since they were surveyed previously, as shown in Figure 44. Of participants who were not working at Wave 3, just under half remained in the same situation, with 33 per cent not working and claiming an out-of-work benefit, 8 per cent not working and not claiming an out-of-work benefit, and 8 per cent in education or training. However, almost half had moved into work, with 47 per cent now working for an employer, and 1 per cent in self-employment.
Of those who were working at Wave 3, the vast majority remained so at Wave 4, with 88 per cent working for an employer, and 4 per cent self-employed. Only 5 per cent were not in work, with a further 2 per cent in education or training.
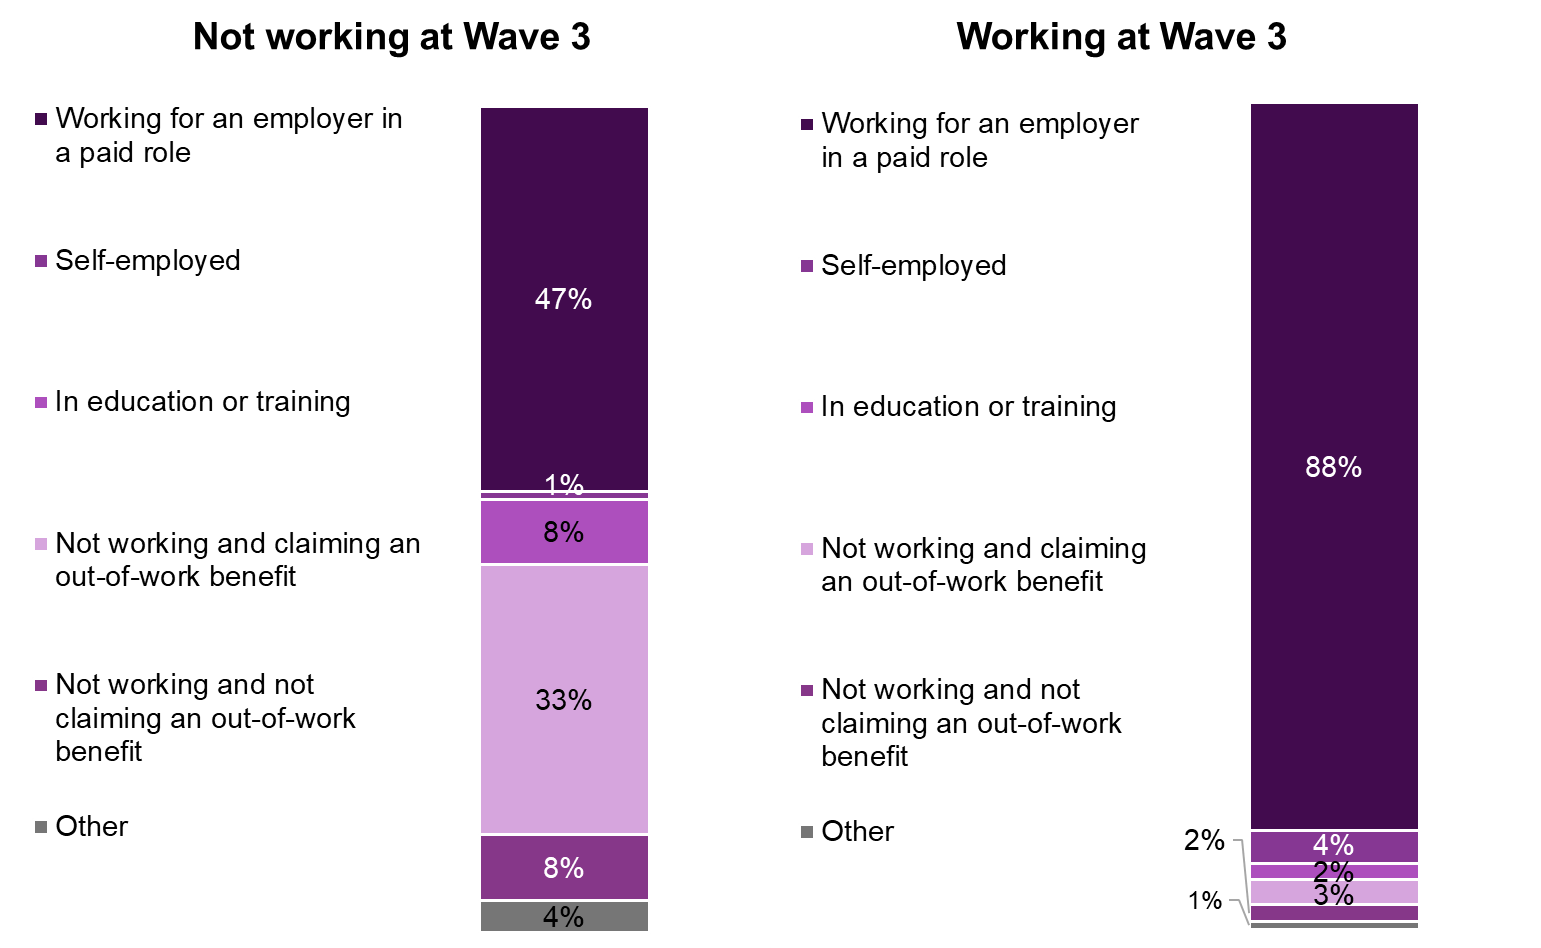
Source: IFF Research telephone survey of FSS customers. B1aX_W4 Which of the following best describes what you have been doing since the last survey? Base: Pre-employment at Wave 3 (169) In employment at Wave 3 (81). Note ‘working’ here refers to working more than 16 hours per week, and ‘not working’ refers to not working or working less than 16 hours per week
8.2 Quality of work
As well as working status, the Wave 3 and Wave 4 surveys covered working hours and other measures for quality of work. As shown in Figure 45, over two thirds (70 per cent) of those who were working at Wave 4 in the 2020 cohort were working 30 or more hours per week, a significant increase since Wave 3. The proportions working 16 to 29 hours and fewer than 16 hours remained consistent between Waves. Participants who were in work at both waves were also more likely to be working 30 hours or more at Wave 4 compared to Wave 3.
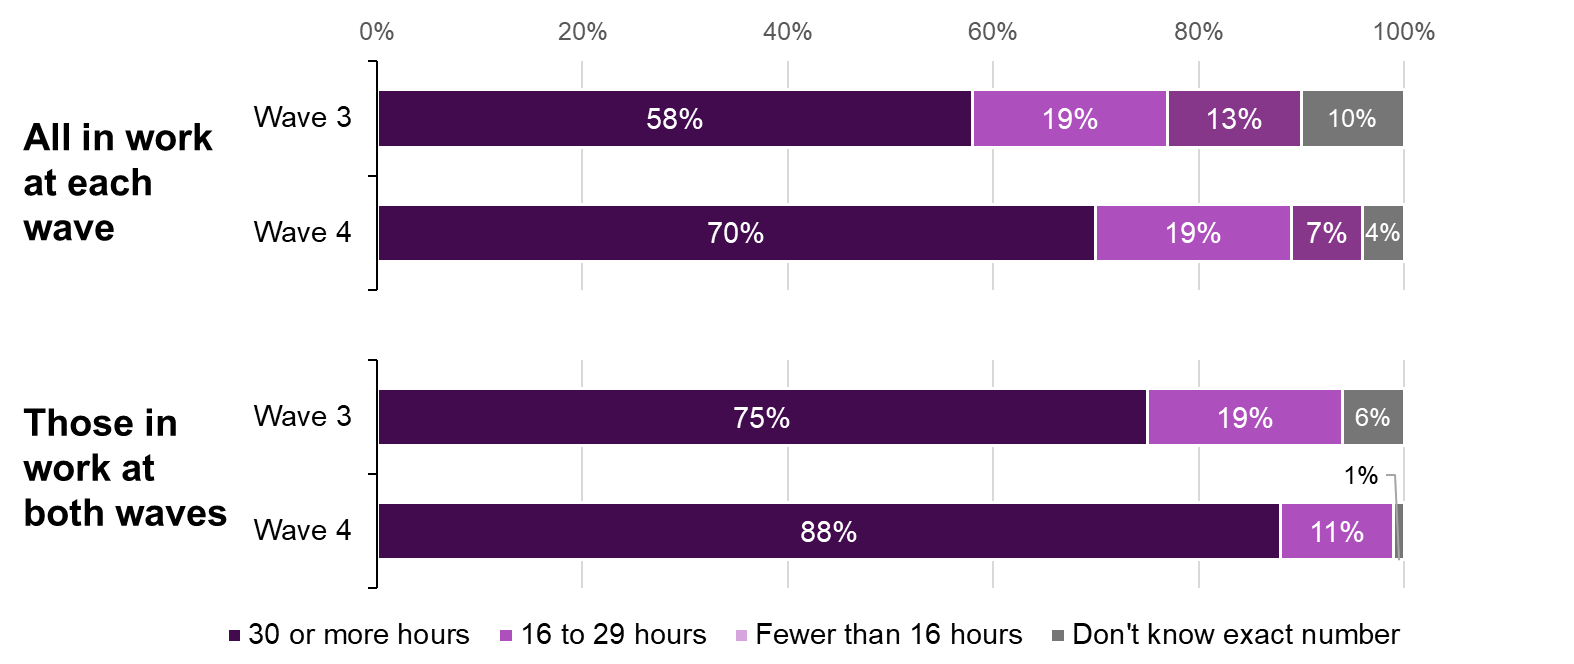
Source: IFF Research telephone survey of FSS customers A3_W3/W4. How many hours per week do you usually work, or spend in education? Base: All working: Wave 3 2020 cohort (109) Wave 4 2020 cohort (166); All in work at both waves (77)
Figure 46 below shows the occupational groups that participants from the 2020 cohort were in at the time of the survey. This is based on the 2010 UK Standard Occupational Classification (SOC). At Wave 4, the largest group of the 2020 cohort that were in work worked in labour intensive (36 per cent) jobs. This was followed by 22 per cent in service intensive roles, 22 per cent in high skilled jobs, and 19 per cent in middle skilled roles. There were no significant changes between waves in types of occupation.
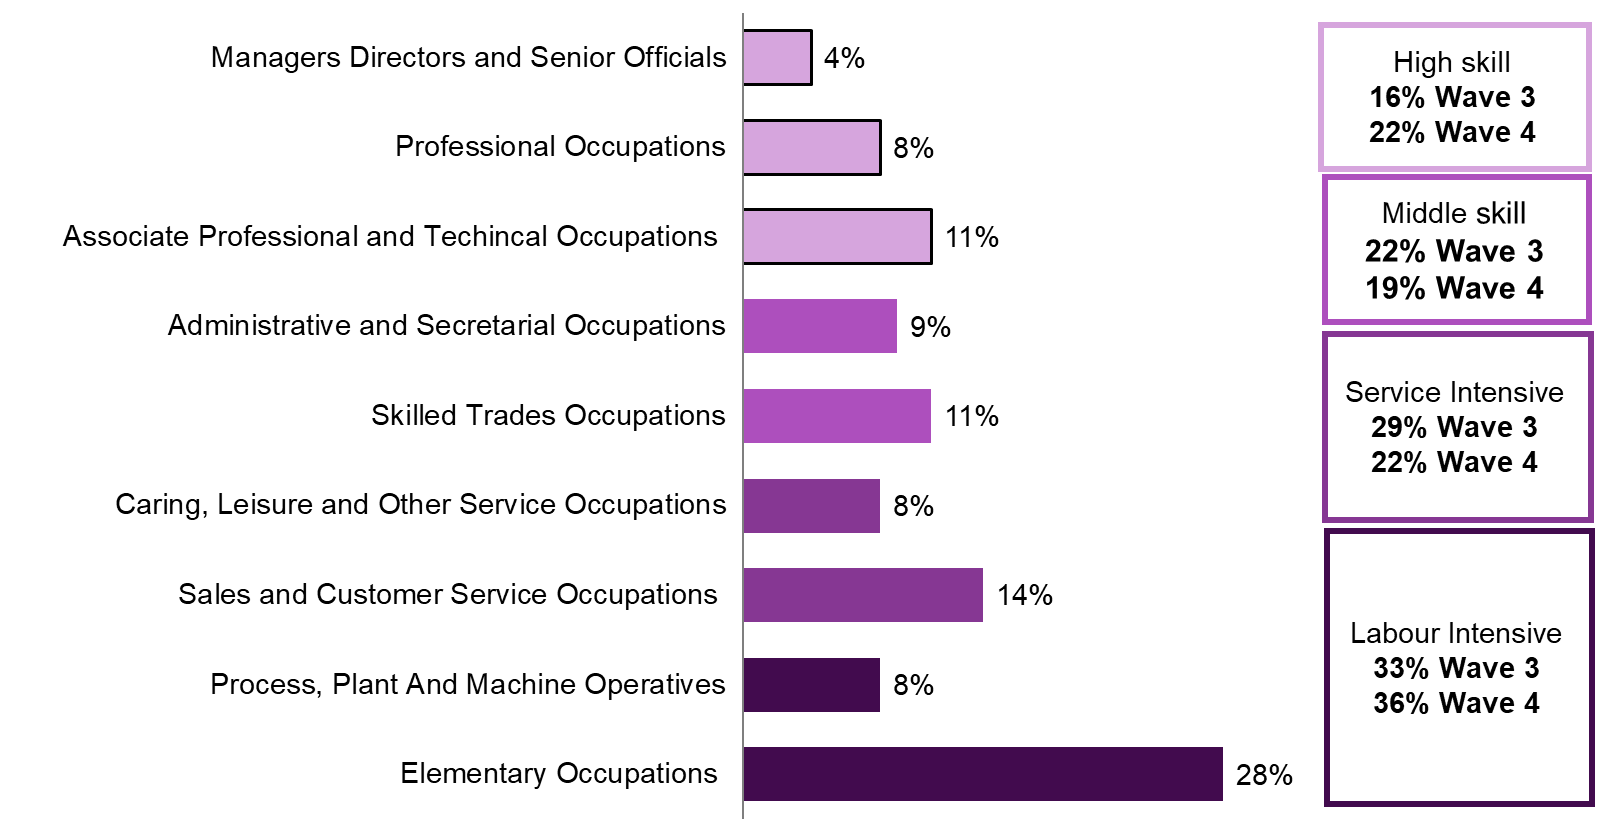
Source: IFF Research telephone survey of FSS customers. Taken from collating and coding answers from A5: What is/was your job title? And A6: What do/did you mainly do in your job? Base: 2020 cohort that were employed, self-employed or had worked in the last week Wave 3 (247) Wave 4 (158). More information on how job information is coded to these categories please visit 2010 UK Standard Occupational Classification (SOC)
Participants were also asked about their usual gross pay (i.e. pay before tax or any other deductions) at both Wave 3 and Wave 4. This information reported by survey participants was coded to a pay range band in the survey[41]. This data was then analysed to benchmark participants’ usual pay against the thresholds for the National Living Wage and the Real Living Wage rates at the time of the survey. (see Figure 47)[42].
At the time of the Wave 4 survey, individuals who were classed as ‘workers’ and who were aged between 16 and 22 were legally entitled to the National Minimum Wage, whilst individuals classed as ‘workers’ who were aged 23 or above were legally entitled to the National Living Wage[43]. At the time of the Wave 4 survey, the National Living Wage was £9.50 per hour and the National Minimum Wage was between £4.81 and £9.18 (depending on the individual’s age). The Real Living Wage is calculated annually by the Living Wage Foundation, and is based on the cost of living. The Real Living Wage is a voluntary wage rate and is a rate that employers sign up to pay (i.e. it is not a legal minimum wage rate).
As shown in Figure 47, the majority of the 2020 cohort who were in work at Wave 4 reported being paid between £9.50 and £15.00 an hour (66 per cent). In total, 78 per cent of the 2020 cohort reported earnings that indicated they earned the National Living Wage of £9.50 or above at Wave 4, with 46 per cent reporting earnings indicating they earned the Real Living Wage of £10.90 or above. However, 7 per cent of those in work reported being paid less than £9.50 per hour at Wave 4, which was below the National Living Wage – the legal minimum for those aged 23 and over – at the time. This is similar to the number who reported being paid under the legal minimum at Wave 3 (11 per cent).The legal minimum at the time of the Wave 3 survey (March 2021) was the National Living wage of £8.72 per hour for those aged 25 and over. At Wave 4, 6 per cent of working participants aged 25 or over reported receiving earnings that indicated that they earned below the National Living Wage rate, despite this being the legal minumum for their age group. Meanwhile, 9 per cent of in-work participants aged 16-24 reported earnings below the National Living Wage rate for those aged 23 or above. The sample data for FSS participants classifies their age in bands, rather than an exact number. This means it is not possible to split the data to correspond to the National Living Wage threshold of 23 years old. We cannot therefore be certain if or how many of those aged 16 - 24 who reported earnings under the National Living Wage were legally entitled to it. Almost one in ten participants (9 per cent) were unsure of their wage. The proportion of participants reporting being paid more than £15 per hour remained consistent between the two Waves.
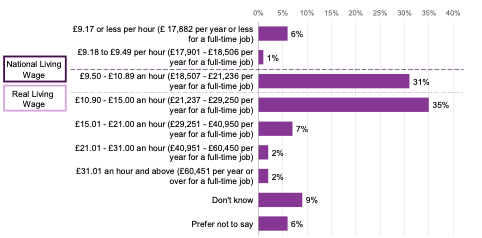
Source: IFF Research telephone survey of FSS customers, A7: Can you tell me your usual pay including overtime, bonuses, or tips (but before tax and other deductions are taken out)[44]? Base: All employed, self-employed or had worked in the last week (158)
* The National Living Wage is the legal minimum employers must pay workers if they are aged 23 or above. The Real Living Wage is a voluntary wage rate set by the Living Wage Foundation each year and is a rate that employers sign up to pay (i.e. it is not a legal minimum wage rate)
Participants with a degree were more likely to report being paid at rates that would correspond to the Real Living Wage rate or above (66 per cent), compared to those without a degree (37 per cent). Participants aged 35 to 49 were more likely to report being paid at rates that would correspond to the Real Living Wage rate or above (67 per cent) than survey participants on average (46 per cent).
Participants were also asked about the types of contract they had at both Wave 3 and Wave 4. As shown in Figure 48, three quarters (75 per cent) of the 2020 cohort who were in work at Wave 4 had a permanent contract, an increase since Wave 3 (43 per cent). This was accompanied by a substantial decrease in the proportion of the 2020 cohort with a temporary employment contract, from a third (33 per cent) at Wave 3, to one in ten at Wave 4 (10 per cent). The proportion who were self-employed or had a zero hours contract remained consistent between Waves.
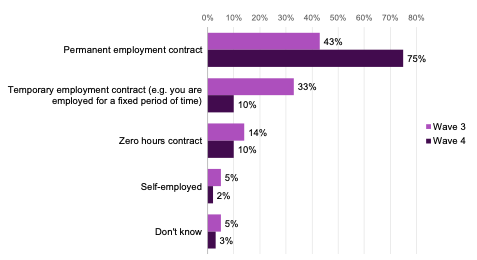
Source: IFF Research telephone survey of FSS customers, A8: Can you tell me what type of employment contract you have? Wave 3 Base: All 2020 cohort employed, self-employed or have worked in the last week (100). Wave 4 Base: All 2020 cohort employed, self-employed or have worked in the last week (158)
Focusing on participants who were in work at both waves, the proportion with a permanent employment contract significantly increased, from 46 per cent at Wave 3 to 88 per cent at Wave 4. This was due to a significant decrease in participants with temporary or zero hours contracts, as shown in Figure 49.
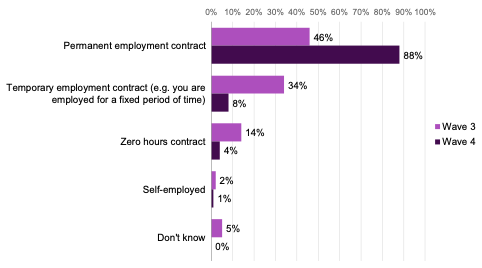
IFF Research telephone survey of FSS customers, A8: Can you tell me what type of employment contract you have? Base: All employed, self-employed or have worked in the last week at both Wave 3 and Wave 4 (77)
As shown in Figure 50, two in five (40 per cent) of the 2020 cohort that were working (or had done some paid work in the week prior to the interview) had begun their job more than a year ago. There was a significant increase in the proportion who had started their job over a year ago at Wave 4 compared to Wave 3, suggesting those that find work were managing to sustain it.

Source: IFF Research telephone survey of FSS customers A3B. When did you start working in your current or most recent job? Base: All working (employed, self-employed, or worked within the last week). Wave 3 2020 cohort (100) Wave 4 2020 cohort (158)
Participants from the 2020 cohort who were in work at Wave 4 were asked about several aspects of their current job. The vast majority of participants were satisfied with their job overall (88 per cent), and with the kind of work they do day-to-day (85 per cent), as shown in Figure 51. A large proportion also agreed that their job reflected their skills and experience (79 per cent), and offered the flexibility to manage family and household responsibilities (73 per cent). Although still a majority, fewer participants agreed that their job paid enough to support them and their families (66 per cent) or reflected their career or professional aspirations (54 per cent).
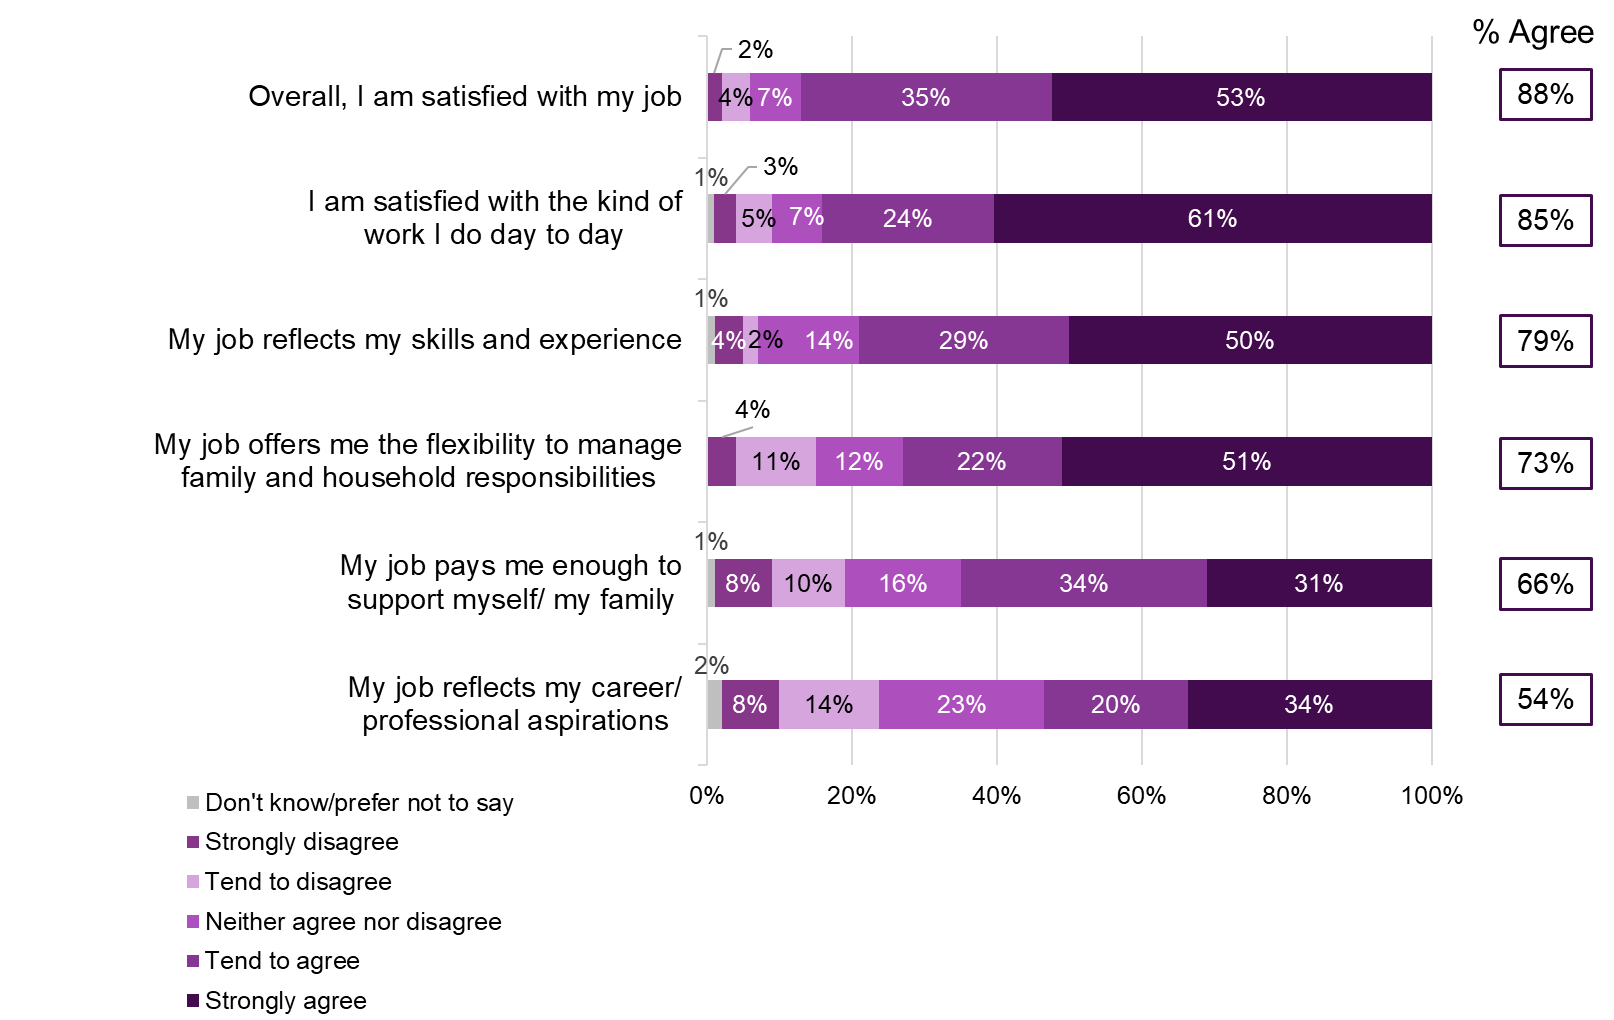
Source: IFF Research telephone survey of FSS customers, A10 _W4. To what extent do you agree or disagree with the following statements about your current job? Base: All employed, self-employed or have worked in the last week. Wave 4 (158)
Compared to the average for all participants in work, there were several differences by sub-group:
- participants aged 25 to 34 were more likely to be satisfied with their job overall (99 per cent), and more likely to say their job reflected their career/ professional ambitions (67 per cent)
- participants aged 50+ were less likely to be satisfied with their job (74 per cent) and less likely to be satisfied with the kind of work they do day to day (72 per cent). Participants over 50 were also less likely to say their job paid enough to support themselves or their family (49 per cent)
- white participants were more likely to say their job paid enough (70 per cent)
- participants without a health condition were less likely to say their job paid enough to support themselves or their family (56 per cent)
- the sample size amongst priority families, early leavers, and participants from different Lots were too small for differences to be statistically significant
Several sub groups were more likely to agree that their job reflected their career or professional aspirations, including:
- male participants (60 per cent) compared to female participants (44 per cent)
- parents (74 per cent) compared to those who did not have children (49 per cent)
- participants aged 25 to 34 (67 per cent) compared to average
- those with a National 1-5 level qualification or equivalent were less likely to agree compared to the average (35 per cent)
- subgroup sizes were not large enough to make comparisons between participants from different ethnic backgrounds or from different Lots, those who came from a priority family and those who didn’t, and those who left early compared to those who didn’t
The 2020 cohort who were in work were asked several questions about any changes to their working circumstances since receiving support from Fair Start Scotland. As shown in Figure 52, almost three quarters (73 per cent) had opportunities for training or development in their job, whilst two thirds had been given additional responsibilities (67 per cent) or an increase in pay (66 per cent). Meanwhile around four in ten had moved to another job that suited them better (43 per cent), or with increased pay (37 per cent). A quarter had received a promotion (24 per cent) and a small number had received a performance-related bonus (16 per cent).

Source: IFF Research telephone survey of FSS customers, F1d_W4. Thinking about your work since receiving support from Fair Start Scotland, do any of the following apply? Base: All working more than 16 hours per week. Wave 4 (144) (Had a promotion, Had a performance- related bonus, and Had been given additional responsibilities excluded self-employed (106))
Female participants were more likely to have had opportunities for training or development (82 per cent), or to have moved to another job that suited them better (53 per cent) compared to men (66 per cent; 35 per cent). Participants aged over 50 were less likely to have received opportunities for training and development (40 per cent), compared to average (73 per cent), whilst participants aged 35-49 were more likely to have had a promotion (38 per cent). Those with a degree were more likely to have received a performance-related bonus (26 per cent), and those with a health condition that doesn’t limit their daily activities were less likely to have had opportunities for training and development (58 per cent).
There were no signifcant differences across these measures for parents. The sample sizes for ethnicity, priority families, early leavers, and Lot were too small for differences to be statistically significant.
8.3 Outcomes and motivation to return to work
This section explores 2020 cohort participants’ motivation to return to work and any impact that FSS has had on their motivation. It also describes the types of support participants found most useful and how confident participants feel in carrying out job search activities. Findings in this section focus on outcomes for the 2020 cohort and how they have changed between Wave 3 and Wave 4.
8.3.1 Views on returning to work
Participants who were not in work for more than 16 hours per week (42 per cent of the 2020 cohort) were asked about their motivation to return to work. The questions were phrased as either ‘returning to work’ or ‘returning to full time work’ depending on whether they were not working at all or working less than 16 hours[45].
Looking at participants who were not in employment at both waves, the proportion who felt motivated to return to work ‘to a great extent’ decreased slightly but not significantly. As shown in Figure 53 below, the proportion of participants feeling motivated to return to work ‘to some extent’ or ‘ a little’ remained consistent between waves, however there was a significant increase in those who were ‘not at all’ motivated, from 1 per cent to ten per cent. Over half of those not in employment at both waves reported that their health limited their day-to-day activities.

Source: IFF Research telephone survey of FSS customers, E2_W3/W4. To what extent would you like to return to (full time) work in the future? Base: All who work fewer than 16 hours per week at both waves (97)
In terms of differences by sub-group, those whose health condition limited their day-to-day activities were significantly less likely to want to return to work ‘to a great extent’ (42 per cent) than participants without a health condition (72 per cent).
8.3.2 Impact of FSS on motivation
As shown in Figure 54, at Wave 4, over half of the 2020 cohort (58 per cent) felt that the FSS service had increased their motivation. This is consistent with Wave 3, where 64 per cent said their motivation had increased due to FSS.

Source: IFF Research telephone survey of FSS customers, E8_W3/W4. To what extent would you say your motivation to find (full time) work has increased or decreased from when you began receiving support from the Fair Start Scotland service? Base: All who work fewer than 16 hours per week. Wave 3 (160) Wave 4 (106)
Participants whose health condition limited their day-to-day activities were significantly less likely to say they motivation had ‘increased a lot’ (21 per cent compared to 28 per cent on average).
8.3.3 The impact of FSS support on overcoming barriers to work
Participants were also asked at Wave 3 and Wave 4 about which parts of the support they felt made the most difference to them. The types of support mentioned at Wave 4 were broadly the same as at Wave 3, although some support types were mentioned more or less frequently at the different Waves, as shown in Figure 55.
Help with CVs and application forms were cited by the most participants at both Wave 3 (21 per cent) and Wave 4 (17 per cent), with the proportion remaining consistent between Waves.
One to one support (21 per cent) and regular contact or consistent advisor (19 per cent) were frequently mentioned at Wave 3, but were significantly less likely to be mentioned at Wave 4, suggesting these methods of support may be more valuable earlier on in the support journey.
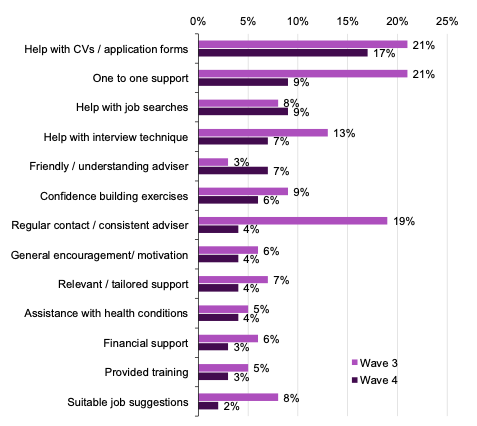
Source: IFF Research telephone survey of FSS customers. F1C_W3/ F1Cx_W4. Thinking back to the support you received from FSS, which parts do you think made the most difference to you? Base: All 2020 cohort who thought the support was helpful Wave 3 (127), All 2020 cohort Wave 4 (250) Options with under 5% at both waves not shown.
8.3.4 Job search skills
Participants in the 2020 cohort were asked at Wave 4 whether they felt their overall job search skills had improved as a result of taking part in FSS. Overall, almost two thirds (62 per cent) agreed that their job search skills had improved due to taking part in the programme, whilst a quarter (25 per cent) were neutral, and 11 per cent disagreed.
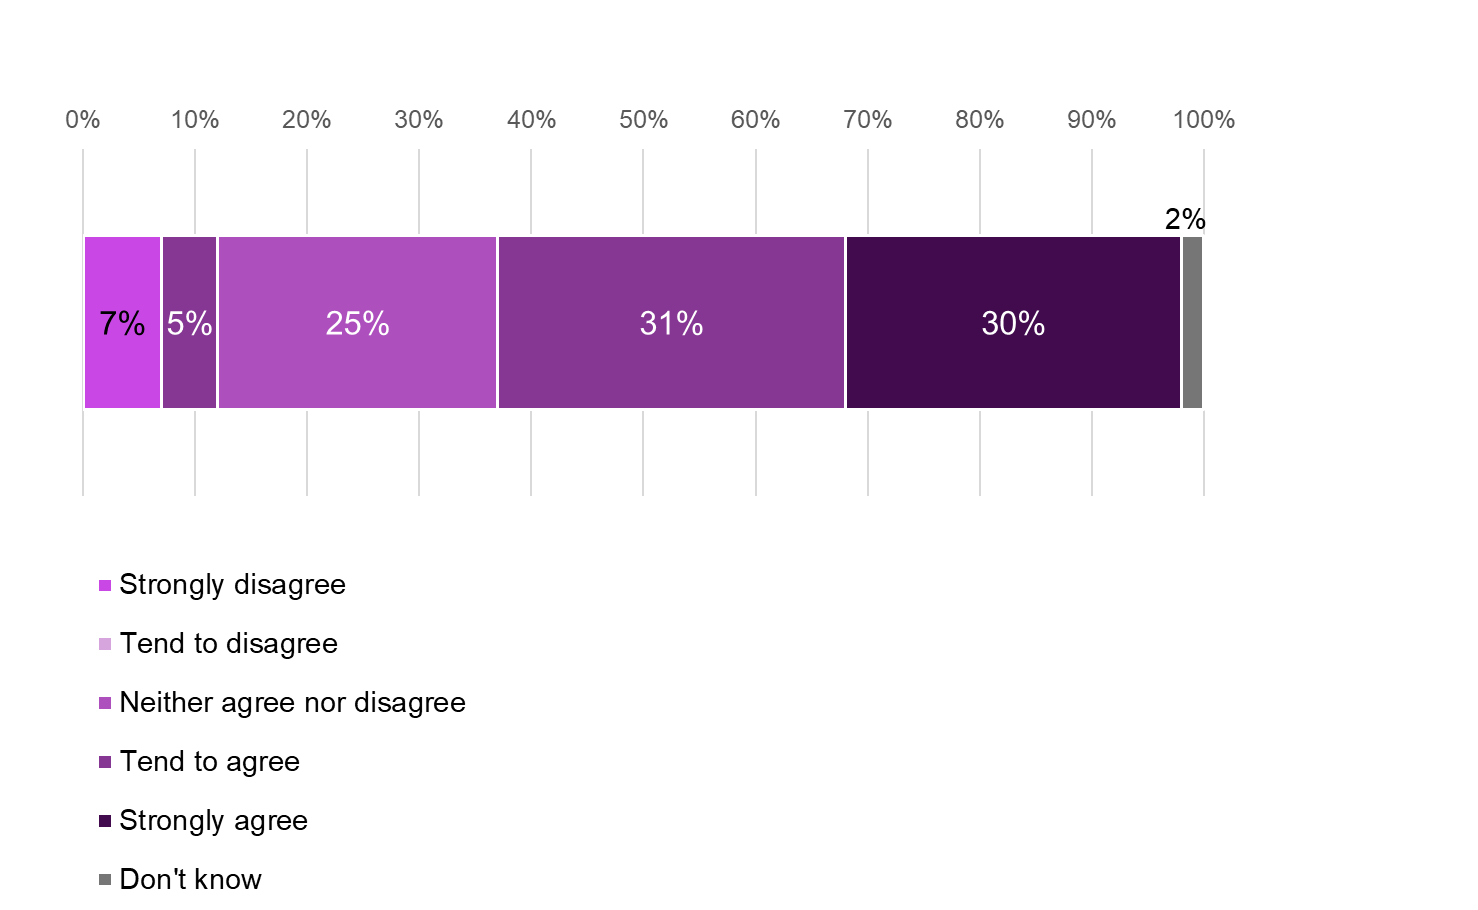
Source: IFF Research telephone survey of FSS customers. F2K. To what extent do you agree or disagree that your overall job search skills have improved as a result of participating in Fair Start Scotland? Base: All 2020 cohort Wave 4 (250)
There were several differences by subgroup, where the following were more likely to agree their job search skills had improved as a result of FSS:
- male participants (67 per cent) compared to female participants (54 per cent)
- participants aged 16 to 24 (75 per cent) and 25 to 34 (71 per cent), compared to those aged 35 to 49 (49 per cent) and those aged 50+ (51 per cent)
The following sub-groups were less likely to agree that their job search skills had improved due to the service:
- parents (49 per cent) compared to those without children (65 per cent)
8.3.5 Wellbeing
Participants in the 2020 cohort were also asked at Wave 4 about whether FS S had a positive impact on their general wellbeing. The majority (69 per cent) of participants agreed that the service had had a positive impact on their wellbeing, as shown in Figure 57. One in ten (10 per cent) disagreed that it had had a positive impact, and 19 per cent felt neutral.
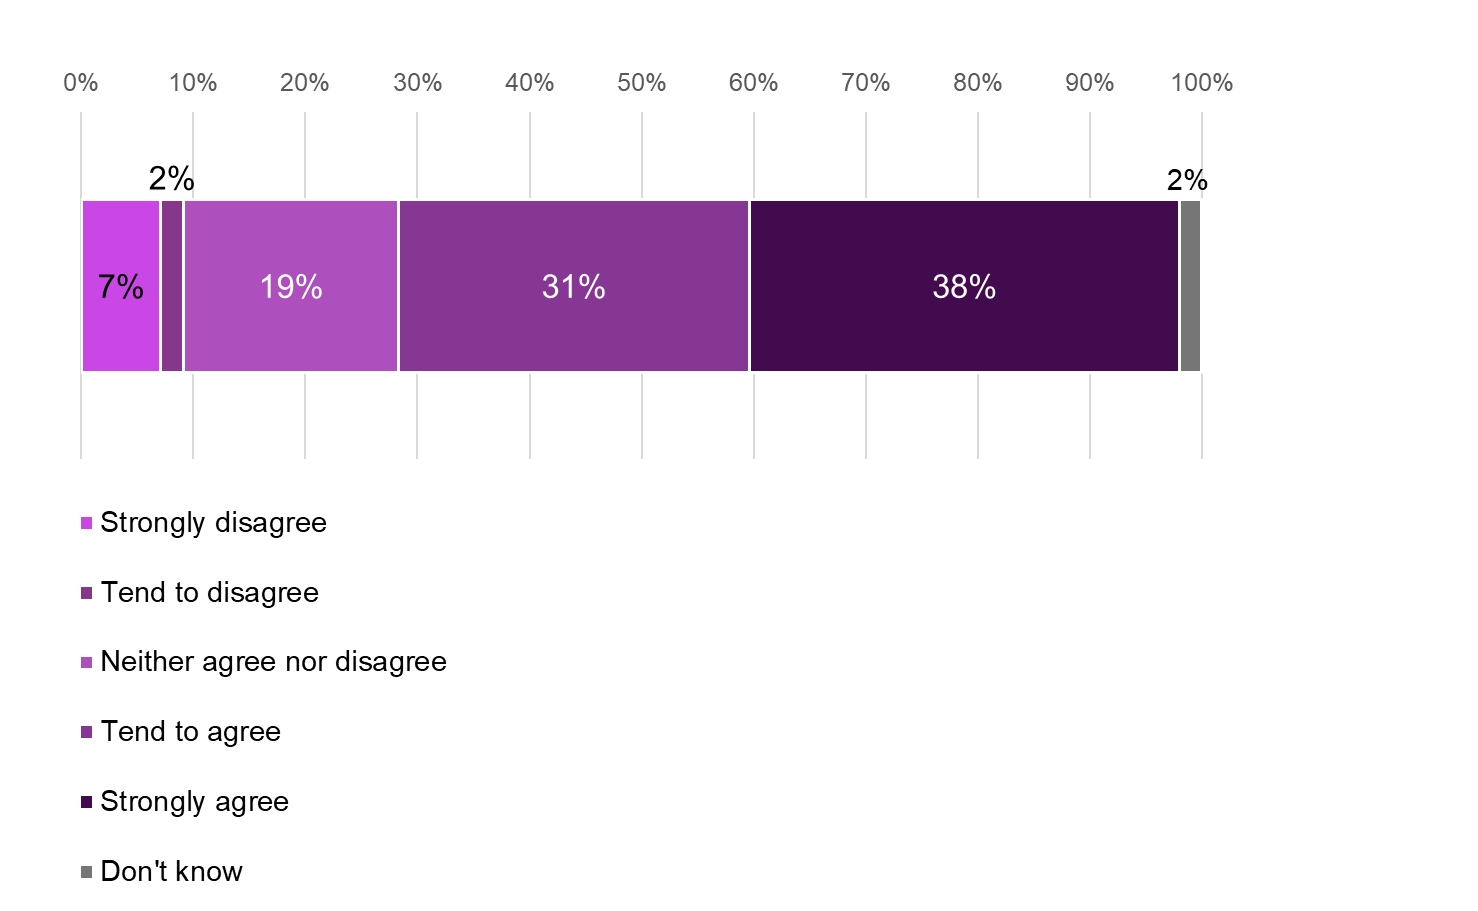
Source: IFF Research telephone survey of FSS customers. F3. To what extent do you agree or disagree that taking part in Fair Start Scotland has had a positive impact on your general wellbeing? Base: All 2020 cohort Wave 4 (250)
The following sub-groups had significant differences in their level of agreement that FSS had a positive impact on their wellbeing:
- participants who were in work (74 per cent) were more likely to agree, compared to those in pre-employment (61 per cent)
- those living in Lot 5, East were less likely to agree (54 per cent) than average[46]
- those who felt FSS had led to an improvement in their job search skills were more likely to agree (87 per cent), than those who did not (24 per cent), or those who felt neutral (45 per cent)
8.3.6 Awareness of future FSS support
Around one in ten (11 per cent) of the 2020 cohort had received support again, since 2020. Of those who had not re-joined the service, two thirds (66 per cent) were aware that they could re-join the service in future should they need to.
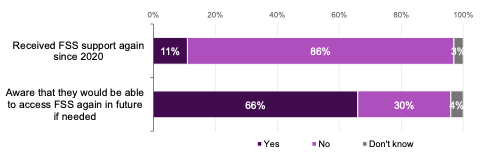
Source: IFF Research telephone survey of FSS customers. D5. Since receiving this support in 2020, have you received support from Fair Start Scotland again? Base: All 2020 cohort Wave 4 (250); D6. Were you aware that, should you need employment support in future, you would be able to access the Fair Start Scotland service again? All 2020 cohort who had not received further support after 2020 Wave 4 (218)
White participants (70 per cent) were more likely to be aware that they could access FSS support again in future if they needed to. Participants living in Lot 5 East were less likely to be aware of this (52 per cent)[47].