Fair Start Scotland - evaluation report 5: participant phone survey - years 4 and 5 - November 2023
Part of a series of reports on the evaluation of Fair Start Scotland (FSS) employability service. The report presents findings from a representative phone survey with FSS participants. The report covers years 4 and 5 (April 2021 to March 2023) of FSS delivery.
3. Profile of participants
This section provides an overview of the participants who joined the service between July 2021 and June 2022 and who took part in the survey at Wave 4. It sets out the profile of participants by age, gender and qualification level, any health conditions or disabilities they experience, and their employment history prior to entering support. The proportion of participants who were classified as being in ‘priority family groups’ is also presented. Analysis has been undertaken to identify any notable differences between the Wave 4 fresh sample and those from previous years.
3.1 Participant characteristics
3.1.1 Age and gender
Just over three-fifths (62 per cent) of the 2021-22 cohort identified as male, and just under two-fifths identified as female (37 per cent), as shown in Figure 3. Less than 1 per cent of participants identified in another way.
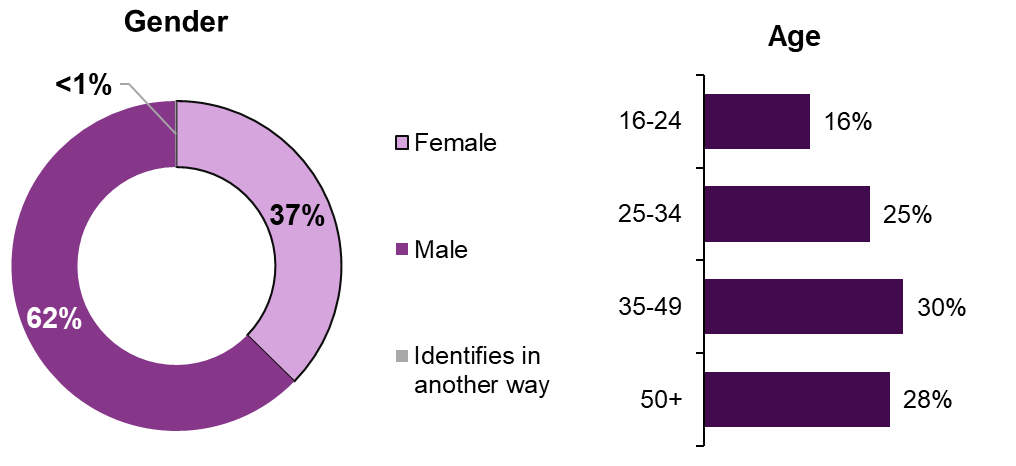
Source: IFF Research telephone survey of FSS customers, sample information: H1_W4 Do you identify as...? H2_W4. Which of the following age bands do you fall into? Base: All 2021-22 cohort (750)
The majority of participants were aged 35 or above, 30 per cent were aged 35 to 49 and 28 per cent were aged 50 or above. A quarter (25 per cent) were aged 25 to 34 and the remaining 16 per cent were aged 16 to 24.
3.1.2 Qualification level
Just under a quarter (23 per cent) of the 2021-22 cohort held qualifications at Scottish Credit and Qualifications Framework (SCQF) Level 8 or above (e.g. a Degree). The highest qualification held by a fifth (19 per cent) of participants was SCQF Level 6 to 7 (e.g. Highers), but for almost a third (31 per cent) were qualified no higher than SCQF Level 5.
Of those remaining, 15 per cent of participants held no academic, professional, technical or management qualifications, 8 per cent were unsure what qualifications they held, 3 per cent had an other professional, technical or management qualification and 1 per cent were unwilling to report them.
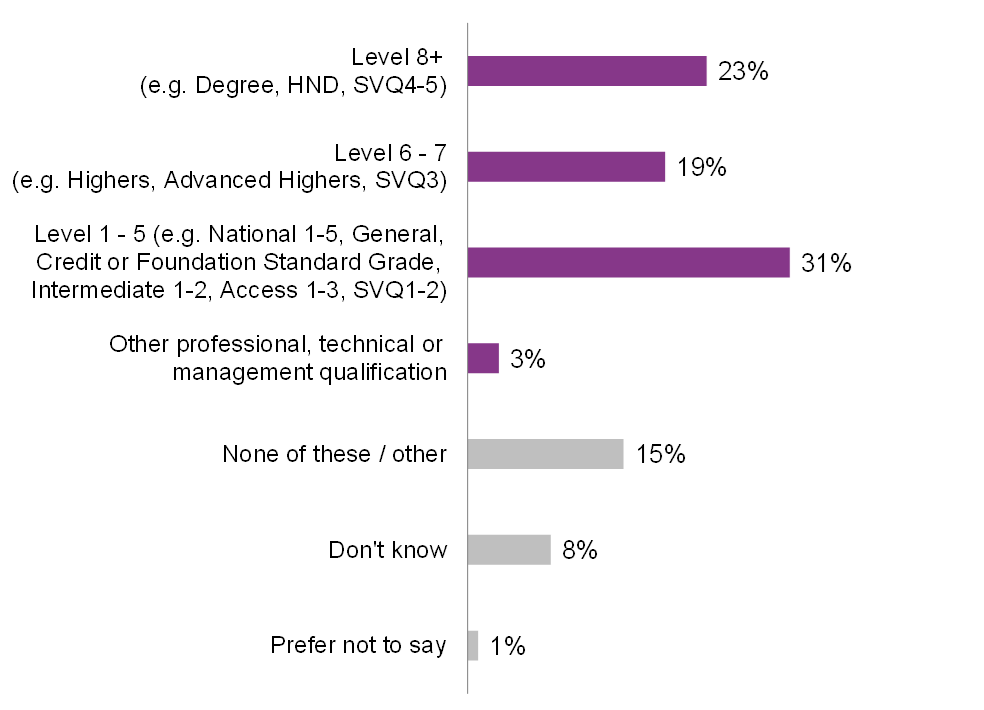
Source: IFF Research telephone survey of FSS customers: H3_W4. What is the highest level of qualification that you have achieved? Base: All 2021-22 cohort (750)
Male participants were more likely to be qualified only to SCQF Level 1 to 5 (34 per cent versus 26 per cent of female participants). Younger participants were also more likely to be qualified only to SCQF Level 1 to 5 (52 per cent of those under 25 compared to 27 per cent of those 25 or older) whilst the older participants were more likely to hold no qualifications (21 per cent of those aged 50 or above versus 8 per cent of those aged under 35).
Participants aged 25 or above were twice as likely to have SCQF Level 8+ qualifications (25 per cent versus 12 per cent of younger participants).
3.1.3 Ethnicity
Over four-fifths (83 per cent) of the 2021-22 cohort described their ethnic background as white, as shown in Figure 5. This includes those who described their background as white Scottish (65 per cent), white other British (15 per cent) and other white minority groups (white Polish 1 per cent, white Irish less than 1 per cent and other white ethnic groups 2 per cent). Among those who described their ethnic background as white, 63 per cent identified as male and 37 per cent identified as female.
Around one-in-seven participants (13 per cent) were from an other minority ethnic group. Participants from Asian or Asian British backgrounds accounted for 6 per cent of the cohort, half of whom were from an Asian or Asian British Pakistani background (3 per cent). Four per cent of participants were from Black, Black British, African or African British backgrounds (the majority of these, three per cent, were from African or African British backgrounds). Among those who were from a minority ethnic group, 60 per cent identified as male and 40 per cent identified as female, a similar split to those who described their ethnic background as white.
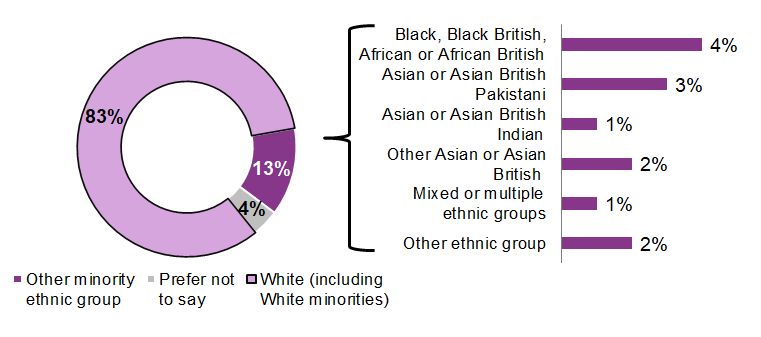
Source: IFF Research telephone survey of FSS customers: H4_W4. Which of the following best describes your ethnic background? Base: All 2021-22 cohort (750)
Participants from a minority ethnic background were more likely to be aged 25 to 49 (18 per cent of those aged 25 to 49 were from a minority ethnic background versus 7 per cent of those under 25 and 5 per cent of those aged 50 or above). Participants from a minority ethnic background were also more likely to be qualified to SCQF Level 8+ (52 per cent versus 17 per cent of white participants)[9].
3.2 Priority families
The Scottish Government has identified a number of priority family groups. These are family types that have a higher-than-average risk of child poverty. These include lone parents, young parents (under 25 years old), parents from minority ethnic groups, parents with a disability / health condition, families with three or more children, and families with a child under 12 months of age. There is a desire to further understand the impact of employability support on tackling child poverty, so it is key that FSS reaches these parents.
23 per cent of the 2021-22 cohort were parents. Just sixteen participants were parents but did not belong to a priority family. As shown in Figure 6, 21 per cent of the 2021-22 cohort belonged to a priority faimly group. Most commonly this was because they were parents with a disability or health condition (13 per cent) and / or were lone parents (12 per cent). Of those who were members of a priority family, over half (57 per cent) met two or more qualifying criteria, and 13 per cent met three or more criteria.
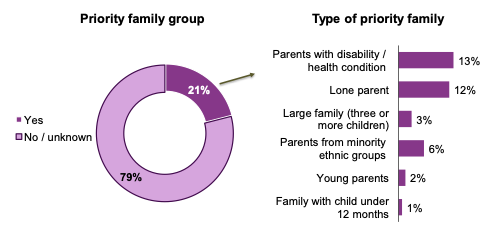
Source: IFF Research telephone survey of FSS customers, W4. Base: 2021-22 cohort (750)
3.3 Re-joiners
Of the 2021-22 cohort, just over a quarter (26 per cent) were ‘re-joiners’, of which 16 per cent had received support once before their latest engagement, and 11 per cent had received support twice or more. Two thirds (66 per cent) had not previously participated in FSS but a further 8 per cent could not recall if they had.
Within the 2021-22 cohort, the following groups were more likely to be re-joiners:
- participants who were not from a priority family (28 per cent) compared to those belonging to a priority family (18 per cent)
- non-parents (29%) compared to parents (19 per cent)
- participants who did not report a health condition were less likely to be a re-joiner (22 per cent) compared to average (26 per cent)
3.4 Differences in profile of participants between the 2021-22 cohort and previous cohorts
The proportion of the 2021-22 cohort who were female (37 per cent) was similar to the 2020 cohort (40 per cent), and the first two cohorts in 2018 and 2019 (36 per cent, 36 per cent).
The 2021-22 cohort tended to be older than in the 2020 cohort: 28 per cent of the 2021-22 cohort were aged 50 or older (compared with only 21 per cent in 2020). Only 16 per cent in 2021-22 were under 25 (compared with 25 per cent in 2020), a return to the 16 per cent they accounted for in the first 2018 wave.
Overall, the proportion of participants who were in priority family groups in the 2021-22 cohort (21 per cent) was similar to previous cohorts (19 per cent in 2020, 21 per cent in 2019). However, there were more parents from ethnic minority groups in the 2021-22 cohort (6 per cent compared to 3 per cent in 2020).