Fair Start Scotland - evaluation report 5: participant phone survey - years 4 and 5 - November 2023
Part of a series of reports on the evaluation of Fair Start Scotland (FSS) employability service. The report presents findings from a representative phone survey with FSS participants. The report covers years 4 and 5 (April 2021 to March 2023) of FSS delivery.
5. Working status & quality of work
5.1 Employment status of the 2021-22 cohort at the time of the survey
This chapter will look at the working status of the 2021-22 cohort at the point of survey and the quality of work that they undertake. This is therefore a snapshot of participants’ activities in December 2022 and January 2023 when the survey was conducted and does not represent FSS employment outcomes[10]. A person joining FSS can expect to receive up to 12-18 months of pre-employment support, so for example a person that joined in March 2022 could have been due to receive pre-employment support up until March 2023 or in some cases September 2023. Statistics for employment outcomes for FSS can be found in Scotland's Devolved Employment Services statistics published quarterly.
Throughout the chapter comparisons will be made to previous cohorts to assess how the working status and quality of work for new participants has changed over the four waves of this survey. It should be noted that on average, more time had passed between the point at which participants joined FSS and the point at which they completed the survey for the 2021-22 cohort compared to the 2020 cohort. As a result, participants from the 2021-22 cohort may have benefited from more support from FSS, but the difference to the 2020 cohort is minimal[11].
At the time of the Wave 4 survey 39 per cent of the 2021-22 cohort were either working for an employer or were self-employed (see Figure 11). A further 2 per cent had done some paid work in the week leading up to the interview. This was similar to the proportion of the 2020 cohort participants that were in work at the point of the Wave 3 survey (in April 2021) - 36 per cent and higher than Waves 1 and 2 (27 per cent and 31 per cent respectively). More than half of the 2021-22 cohort were not working and either claiming an out of work benefit (48 per cent) or not working and not claiming and out of work benefit (7 per cent). A small number of participants were in education or training (2 per cent) or were not working but due to start work within the next month (2 per cent).
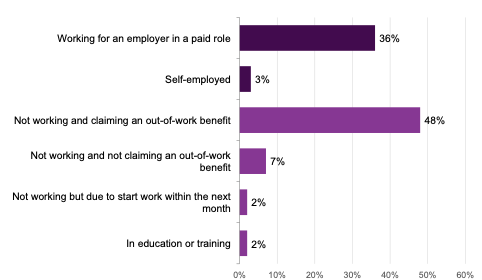
Source: IFF Research telephone survey of FSS customers, A1 Which of the following best describes what you are doing at the moment? Base: 2021-22 cohort (750)
There were numerous factors linked to participants’ likelihood of having done some paid work in the week previous to the interview:
- female participants were more likely than male participants to be working (45 per cent, compared to 37 per cent)
- participants who had achieved a degree or higher were more likely than average to be in employment (55 percent compared to 40 per cent) whereas those without qualifications were less likely than average to be in employment (23%)
- older participants (aged 50 and over) were less likely to be in work than younger participants (29 per cent compared with 40 per cent on average)
- participants from a minority ethnic group were more likely to be in work (56 per cent) than white participants (38 per cent)
- participants who had not worked in the last 5 years prior to joining FSS were far less likely to be working than those who had worked in the last 5 years (19 per cent compared to 51 per cent)
- participants who reported no health conditions were more likely to be working than participants who reported a health condition that limits their day-to-day activity (50 per cent versus 31 per cent)
- members of priority families were more likely to be in work (50 per cent) than those not from a priority family (38 per cent). Parents were more likely than non-parents to be working (52 per cent compared to 37 per cent)
- whether or not participants left the service early was also a contributing factor, with those leaving early less likely to be in employment than those who did not (26 per cent, compared to 44 per cent)
- participants in Lot 1 (Glasgow) were more likely to be working than on average (49 per cent compared to 40 per cent)[12]
- no differences were found between those who had re-joined the programme and those who were new joiners
Regarding benefits, white participants were more likely than participants belonging to a minority ethnic group to be not working and claiming an out-of-work benefit (51 per cent compared to 24 per cent). White participants were also more likely to have left the programme early compared with participants from minority ethnic groups (56 per cent vs 46 per cent).
Figure 12 shows that, among the 2021-22 cohort who had worked in the last week, one in ten (10 per cent) were working fewer than 16 hours, around a quarter (26 per cent) were working between 16 and 29 hours per week and nearly six in ten (57 per cent) were working 30 or more hours per week.
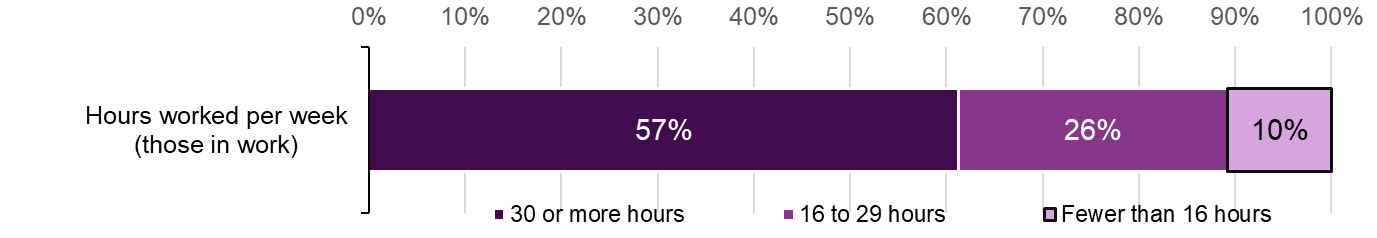
Source: IFF Research telephone survey of FSS customers. A3 How many hours per week do you usually work, or spend in education? Base: 2021-22 cohort in work (313)
Regarding number of hours usually spent working per week:
- male participants were more likely than female participants to spend thirty or more hours working per week (64 per cent compared to 47 per cent). Ethnicity appeared to be a factor with participants who were white more likely than those from a minority ethnic background to be working 30 hours or more per week (60 per cent, compared to 46 per cent)
- those who had worked in the last 5 years were more likely to be working 30 hours or more per week than those who had not (62 per cent compared to 36 per cent)
- members of a priority family were less likely than those not from a priority family to be working 30 hours or more per week (41 per cent compared to 63 per cent)
- just over three quarters (76 per cent) of participants in Lot 2 (Lanarkshire) were working 30 hours or more per week, significantly higher than the overall average (57 per cent)[13]
- age, qualification level, health limitations, whether or not participants were early leavers, and whether participants had re-joined or were new joiners were not significant factors in a participants likelihood to be working 30 hours or more per week
There was no significant difference between the amount of hours usually worked per week in Wave 3 and Wave 4.
Participants who had done some paid work in the week prior to the interview were asked when they began their job. Six in ten participants (62 per cent) said they had started working in the current job less than 6 months ago. Around one quarter (26 per cent said they had started between six months and a year ago and one in ten (10 per cent) said they had started more than one year ago.
The vast majority of FSS participants who were employed, self-employed or who had worked in the last week at the time of the interview had one job (97 per cent), with only 2 per cent saying they had two jobs and 1 per cent saying they had three jobs or more. Participants belonging to a minority ethnic group were more likely than white participants to have two jobs (9 per cent compared to 1 per cent).
5.2 Differences in employment status between the 2021-22 cohort and previous cohorts
The employment status of the 2021-22 cohort has been compared to the 2018, 2019 and 2020 cohort, to assess differences between the cohorts in employment status[14].
The proportion of the 2021-22 cohort to have done some work in the last week (40 per cent) was similar to the proportion of the 2020 cohort (38 per cent), as can be seen in Figure 13. However, there was a difference between the 2021-22 cohort and the 2018 and 2019 cohorts in the proportion that had done some paid work in the last week (40 per cent compared to 29 per cent and 34 per cent respectively).

Source: IFF Research telephone survey of FSS customers. A1 Which of the following best describes what you are doing at the moment? Base: 2021-22 cohort (750) 2020 cohort (663) 2019 cohort (607) 2018 cohort (1005) A1A Did you do any paid work in the seven days prior to the interview? Base: all other than employed and self-employed 2021-22 cohort, Wave 4 (460) 2020 cohort, Wave 3 (427), 2019 cohort , Wave 2 (427), 2018 cohort, Wave 1 (733)
There was a considerable difference between Wave 4 and Wave 1 (the 2021-22 and 2018 cohorts). The difference can be attributed to:
- more participants working for an employer in a paid role (36 per cent of the 2021-22 cohort compared to 26 per cent of the 2018 cohort)
- more participants who are self-employed (3 per cent of the 2021-22 cohort compared to 1 per cent of the 2018 cohort)
It also appears the 2021-22 cohort were working in more full-time roles than the 2018 cohort. More new participants at Wave 4 were working thirty or more hours per week than were at Wave 1 (57 per cent, compared to 49 per cent).
5.3 Quality of work
The Wave 4 survey asked participants about their job roles, how much they earned and the type of contract they were employed on. These questions were asked of all participants who were employed at the time of the survey.
5.3.1 Occupation
Figure 14 shows the profile of participants that were either employed, self-employed or had worked in the last week, by occupation. The occupations are colour-coded based on the broad occupational group they fall into[15].
The most common occupational group of the 2021-22 cohort was labour intensive occupations (40 per cent) made up of elementary occupations (30 per cent) and process, plant, and machine operatives (10 per cent). A further three in ten (30 per cent) worked in service intensive occupations - sales and customer services (18 per cent) and caring, leisure and other services (11 per cent). Slightly more than one sixth (17 per cent) worked in middle skill occupations and one in ten (10 per cent) worked in high skill occupations.
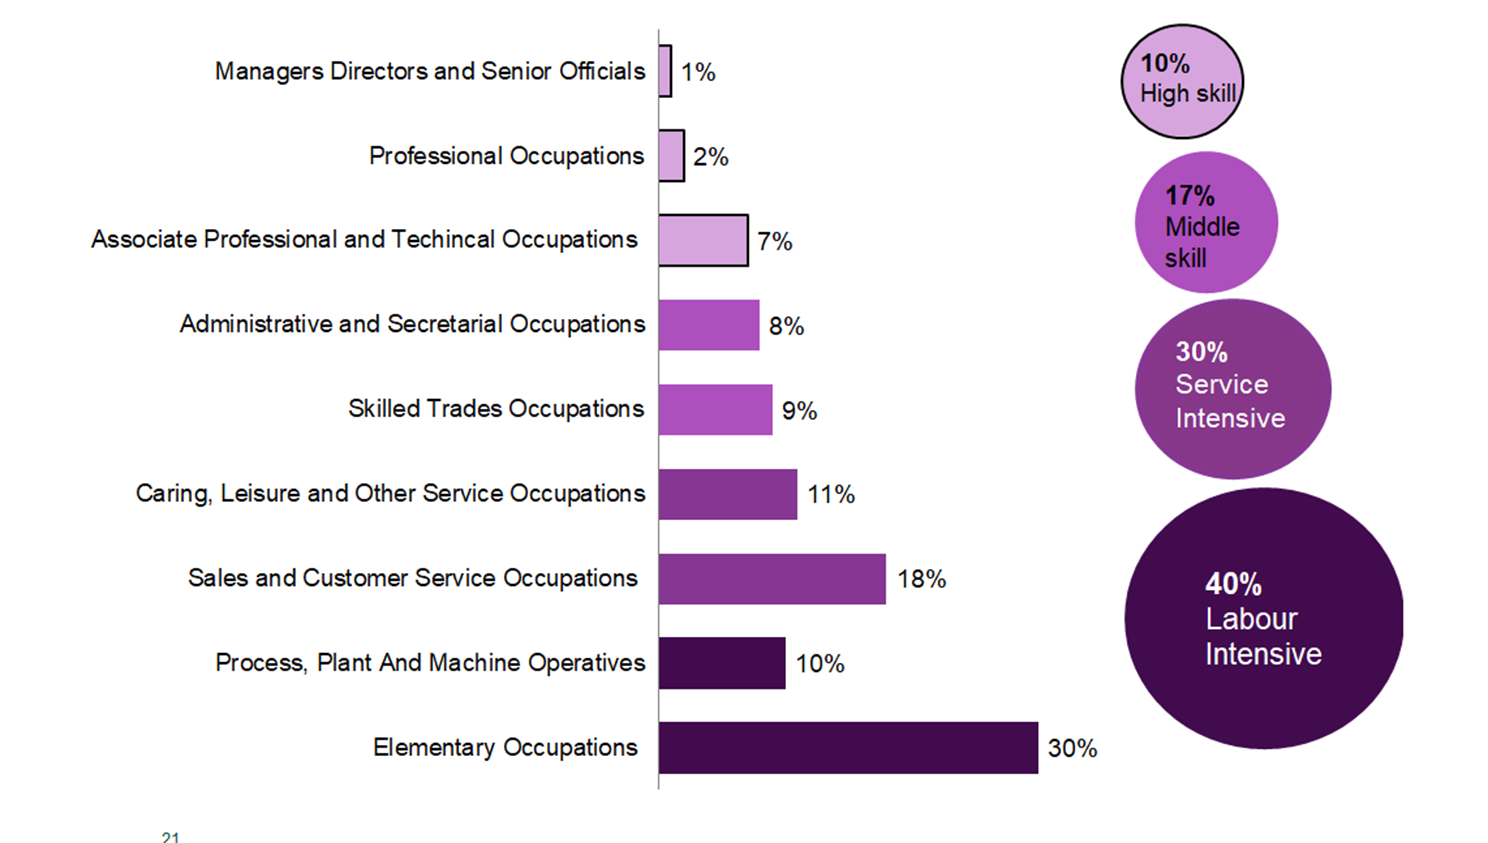
Source: IFF Research telephone survey of FSS customers. Taken from collating and coding answers from A5: What is/was your job title? And A6: What do/did you mainly do in your job? Base: 2021-22 cohort that were employed, self-employed or had worked in the last week (298)
Several factors had an impact on the type of occupations in which participants were working:
- female participants were more likely than males to work in service intensive occupations (43 per cent, compared to 20 per cent) and were less likely to work in labour intensive occupations (24 per cent, compared to 51 per cent)
- age also had an impact on occupation with participants aged 35 to 49 being less likely than average to work in labour intensive occupations (31 per cent compared to 40 per cent)
- qualification levels was also a factor and those with national level 1-5 or equivalent were more likely than average to work in labour intensive jobs (57 per cent, compared to 40 per cent) and less likely than average to work in in high skilled jobs (4 per cent, compared to 10 per cent). Conversely, those with a degree or higher were more likely to work in high skilled occupations (22 per cent, compared to 10 per cent), and less likely than average to work in labour intensive occupations (24 per cent, compared to 40 per cent)
- there were no differences in type of occupation between regions or ethnic groups, between participants whose health limits their day-to-day activities and others, between participants who had worked or not worked in the last five years or between parents and non-parents
- whether or not participants were early leavers, whether or not they were from a priority family, and whether participants had re-joined or were new joiners were not significant factors in the types of occupations they held
- there were no significant differences in the occupations of participants between Wave 3 and Wave 4
5.3.2 Differences in occupation between the 2021-22 cohort and previous cohorts
Occupations of the 2021-22 cohort (at Wave 4) have been compared to the 2020 cohort (at Wave 3), to assess any differences between the two cohorts’ occupational levels [16] after joining the service[17]. There are no differences between the types of occupations participants from the 2021-22 cohort were working in compared to participants from the 2020 cohort at the same point in their FSS journey.
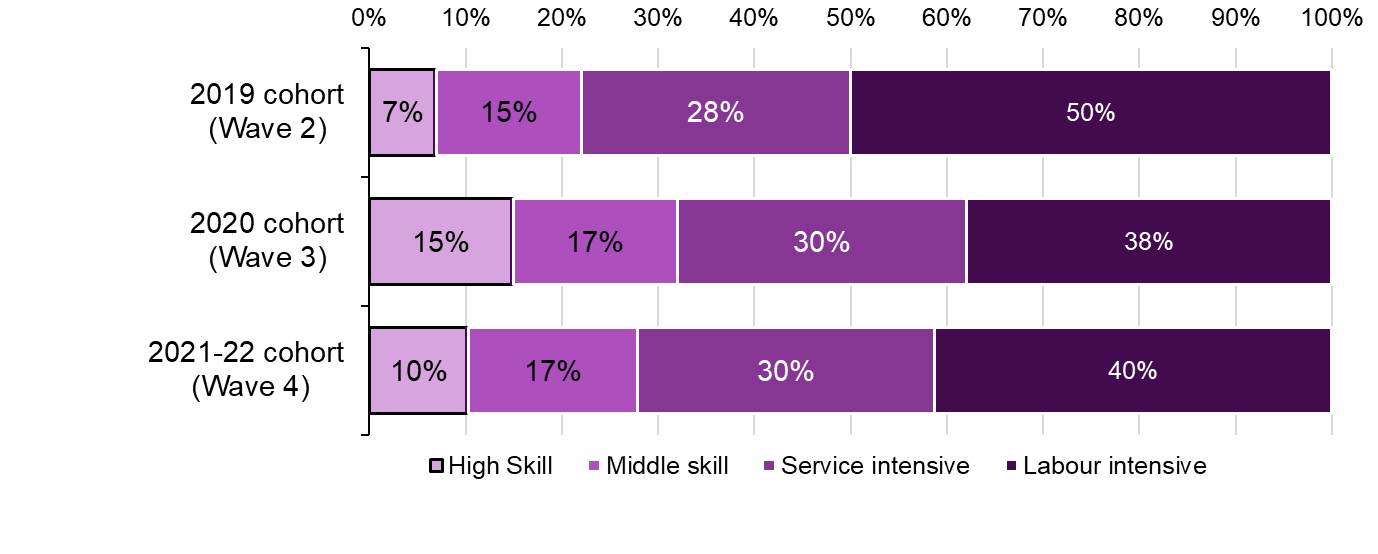
Source: IFF Research telephone survey of FSS customers. Taken from collating and coding answers from A5: What is/was your job title? And A6: What do/did you mainly do in your job? Base: Participants that were employed, self-employed or had worked in the last week 2021-22 cohort (298), 2020 cohort (247), 2019 cohort (341). Please note that this question was not asked of the 2018 cohort (Wave 1)
However, a change noted at the Wave 3 survey has continued into Wave 4. Previously, a shift to more highly skilled occupations between the 2019 cohort at Wave 2 and the 2020 cohort at Wave 3 was noted. This has lasted to some extent, as fewer of the 2021-22 cohort at Wave 4 were working in labour intensive occupations than the 2019 cohort at Wave 2 at the time of the survey (40 per cent compared to 50 per cent). However, while there were more participants from the 2020 cohort at Wave 3 working in highly skilled occupations than the 2019 cohort at Wave 2 (15 per cent, compared to 7 per cent), this proportion is similar across the 2021-22 (Wave 4) and 2019 (Wave 2) cohorts (10 per cent compared to 7 per cent).
5.3.3 Income
FSS participants who were employed, self-employed or who had done paid work in the last week were asked what their usual pay was including overtime, bonuses or tips but before tax and other deductions are taken out. This information on their usual gross (i.e. pay before tax or any other deductions) earnings reported by survey participants was coded to a pay range band in the survey[18]. This data was then analysed to benchmark participants’ usual pay against the thresholds for the National Living Wage and the Real Living Wage rates (see Figure 16)[19].
At the time of the Wave 4 survey, individuals who were classed as ‘workers’ and who were aged between 16 and 22 were legally entitled to the National Minimum Wage, whilst individuals classed as ‘workers’ who were aged 23 or above were legally entitled to the National Living Wage[20]. At the time of the survey, the National Living Wage was £9.50 per hour and the National Minimum Wage was between £4.81 and £9.18 (depending on the individual’s age). The Real Living Wage is a wage rate based on the cost of living (£10.90 at the time of the survey). It is set annualy by the Living Wage Foundation based on a basket of household goods and services. Employers are not legally required to pay their workers this wage.
As is shown in Figure 16, about one in eight (12 per cent)[21] of the 2021-22 cohort in work (those who were employed, self-employed or who had done paid work in the last week) reported earnings that indicated that they earned below the National Living Wage rate for those aged 23 and over. Participants aged between 16 and 24 years old were more likely than those aged 25 and over to report earnings that would be below the National Living Wage rate (24 per cent compared to 9 per cent). The majority (74 per cent) of the working cohort reported earnings that were at least the National Living Wage rate, with 30 per cent reporting earnings would be at least the Real Living Wage rate.
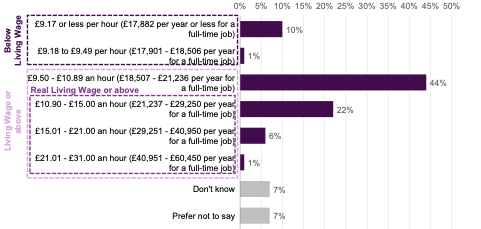
Source: IFF Research telephone survey of FSS customers, A7: Can you tell me your usual pay including overtime, bonuses, or tips (but before tax and other deductions are taken out)? Base: All employed self-employed or had worked in the last week (298)
* Please note that the National Living Wage is the legal minimum employers must pay workers if they are aged 23 or above. The Real Living Wage is a voluntary wage rate set by the Living Wage Foundation each year and is a rate that employers sign up to pay (i.e. it is not a legal minimum wage rate).
Unsurprisingly, as shown by Figure 17 below, age is a contributing factor to income with younger participants (aged 16 to 24) more likely to report earnings indicating that they were earning less than the National Living Wage rate for those aged 23 or above (24 per cent compared with 9 per cent for participants aged 25 and above). Furthermore those aged 25 and above were more likely to report earnings that were at least the Real Living Wage rate (32 per cent compared to 18 per cent for those aged 16 to 24).
We do not have a breakdown of income by individual age, only for age bands 16-24 and 25 or above. We cannot therefore be certain if or how many of those aged 16 - 24 who reported earnings that would be below the National Living Wage were legally entitled to it. However, everyone aged 25 or above who reported earning less than the National Living Wage was legally entitled to it. Further, as the survey did not collect data on whether the person was an apprentice we cannot state whether the apprenticeship status impacted on earnings.
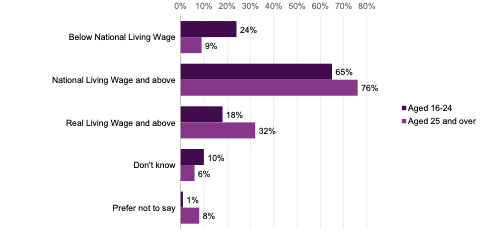
Source: IFF Research telephone survey of FSS customers, A7: Can you tell me your usual pay including overtime, bonuses, or tips (but before tax and other deductions are taken out)? Base: All employed self-employed or had worked in the last week (298)
*Please note that the National Living Wage is the legal minimum employers must pay workers if they are aged 23 or above. The Real Living Wage is a voluntary wage rate set by the Living Wage Foundation each year and is a rate that employers sign up to pay (i.e. it is not a legal minimum wage rate)
5.3.4 Differences in income between the 2021-22 cohort and previous cohorts
As discussed, fewer participants were working in labour intensive occupations amongst the 2021-22 and 2020 cohorts compared to the 2019 cohort.This has an implication for incomes. Compared to the 2019 cohort (at Wave 2), fewer participants from the 2021-22 (at Wave 4) reported earnings that were equivalent to or below the National Living Wage rate for those aged 23 or above (12 per cent compared to 31 per cent). Conversely, a considerably greater proportion of participants from the 2021-22 cohort reported earnings that indicated they were earning at least the National Living Wage rate, compared to the 2019 cohort (74 per cent compared to 60 per cent). Incomes across the 2020 (at Wave 3) and 2021-22 (at Wave 4) cohorts are similar in terms of the proportion of participants who reported earnings that were below the National Living Wage rate, at the National Living Wage rate and above, and at the Real Living Wage and above.
5.3.5 Type of employment contract
Participants in the 2021-22 cohort who had worked within the last week were asked what type of employment contract they had. The results can be seen in Figure 18. Almost three in five (57 per cent) had a permanent employment contract, while less than one in five (18 per cent) had a temporary contract. Those employed on a zero hour contract made up 12 per cent[22] of the working 2021-22 cohort and 5 per cent were self-employed.
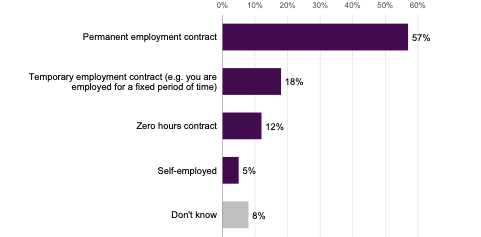
Source: IFF Research telephone survey of FSS customers, A8: Can you tell me what type of employment contract you have? Base: All employed, self-employed or have worked in the last week (298)
There were some sub-group differences between the types of contracts that participants held:
- those who were white were more likely than minority ethnic participants to be employed on a permanent contract (62 per cent, compared to 37 per cent)
- female participants were more likely to hold a permanent contract than male participants (64 per cent compared to 51 per cent)
- participants aged between 16 and 24 were more likely than average to be employed on a temporary employment contract (29 per cent compared to 18 per cent on average)
- participants from Lot 1: Glasgow were more likely than average to be employed on a zero hours contract (20 per cent compared to 12 per cent), while participants from Lot 6: South West were more likely to be employed on a permanent contract (76 per cent compared to 57 per cent on average)[23]
- participants categorised as belonging to a ‘priority family’ were more likely to be self-employed than those not from a priority family (11 per cent vs 4 per cent)
- participants categorised as ethnic minority were more likely than average to be on a zero hours contract (21 per cent vs 12 per cent on average)
- the type of employment contract held by participants did not significantly differ by the level of the qualification they held, the extent to which their health limits their day-to-day activity, their Lot (region), whether or not they were an early leaver of the programme, and whether they were a new joiner or had re-joined the programme
5.3.6 Types of employment contract for participants in 2021-22 cohort compared with previous cohorts
As a reminder, comparisons between the 2020 and 2021-22 cohorts should be approached with caution because on average, more time passed between when participants joined the service and when the survey took place for 2021-2022 cohort than for 2020 cohort. There was a considerable increase in the proportion of participants who are employed on a permanent contract in the 2021-22 cohort compared to the 2020 cohort (57 per cent compared to 43 per cent). This is reflected in fewer participants being employed on a temporary employment contract (18 per cent vs 33 per cent). This decrease was also seen among minority ethnic participants (19% held a temporary employment contarct in the 2021-22 cohort compared to 41% in the 2020 cohort), although among this group the proportion who were employed on a permanent contract did not increase. Types of employment across the 2021-22 cohort are similar to the 2019 cohort (e.g. those employed on a permanent contract, 57 per cent compared to 55 per cent amongst the 2019 cohort).
5.3.7 Employment history
The 2021-22 cohort were asked what their main activity was before they started receiving support from FSS. As would be expected, most participants were unemployed and looking for work (65 per cent). As shown in Figure 19, about one in eight participants indicated they were not in employment due to sickness or disability (12 per cent). Less than one in ten said they were looking after the home or family full time (7 per cent), while around half this number were caring for an adult relative or friend with a disability or long term illness (4 per cent). The remaining participants were working in a voluntary or unpaid role (3 per cent), in education or training (3 per cent), or retired and/or claiming a pension (1 per cent).
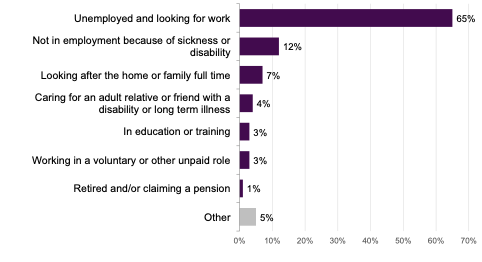
Source: IFF Research telephone survey of FSS customers, B1a: Can you tell me what your main activity was before you began receiving support? Were you [statement]? Base: All (750)
Participants who were not currently employed or self-employed were also asked if they had been in employment (either paid or unpaid) at any point in the last five years. A little over half (55 per cent) indicated they had been in employment at some point during that time. Participants with no qualifications were less likely to have been in employment in the last 5 years than the average for all participants (41 per cent compared to 55 per cent).
Participants from the 2021-22 cohort were less likely to have been in employment (either paid or unpaid) at some point in the last five years than participants from the 2020 cohort (55 per cent compared to 70 per cent). However, this proportion is in line with the 2019 cohort (58 per cent) and the 2018 cohort (53 per cent), suggesting the 2020 cohort is an outlier.
Participants in the 2021-22 cohort were also asked how long they had spent out of work in the past 5 years, prior to joining Fair Start Scotland. As shown in Figure 20 most participants had been out of work for the full time of five years, prior to joining FSS (35 per cent). One in five participants had spent less than one year out of work before joining the programme (21 per cent), with half of that number having spent less than six months out of work prior to joining FSS (11 per cent).
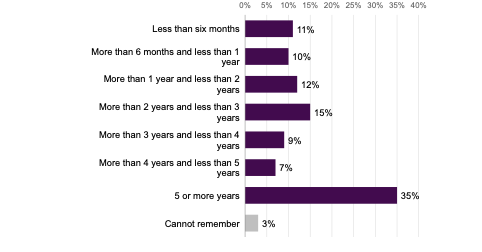
Source: IFF Research telephone survey of FSS customers, B3 Prior to Fair Start Scotland, approximately how long have you spent out of work in the past 5 years? Base: All (750)
There were some differences between groups regarding the length of time participants had been out of work in the last five years:
- female participants were more likely than male participants to have spent five or more years out of work prior to joining FSS (39 per cent compared to 32 per cent)
- younger participants (aged between 16 and 24) were more likely than average to have spent less than six months out of work prior to joining the programme (17 per cent compared to 11 per cent). Participants aged 50 and older were more likely than average to say they had stopped working in their most recent role five or more years ago (36 per cent compared to 29 per cent)
- participants who reported their health limits their day-to-day activities were less likely than average to have spent less than six months out of work in the last five years (8 per cent compared to 11 per cent)
- participants belonging to a minority ethnic group were more likely than white participants to have spent less than six months out of work within this period (19 per cent compared to 10 per cent)
- participants with a degree level qualification or higher were more likely to have only been out of work for less than six months than others (17 per cent compared to 11 per cent on average)
- early leavers of the programme were more likely to have been out of work for five or more years prior to joining FSS than those who did not leave early (45 per cent compared to 32 per cent)
- participants who were economically inactive prior to joining FSS[24] were more likely to have been out of work for five or more years than participants who were actively searching for work (19 per cent compared to 7 per cent)
- new joiners were slightly more likely than average to have spent between 6 months and a year out of work before joining FSS (12 per cent compared to 10 per cent)
- there were no significant differences in the duration of time spent out of work between participants from different Lots
Compared to the 2020 cohort, participants from the 2021-22 cohort were in general more likely to say they had not been in work for a longer period. Fewer said they had not been in work for less than six months (11 per cent compared to 18 per cent for the 2020 cohort) and more said they had not been in work for five years or more (35 per cent compared to 21 per cent).
Finally, participants from the 2021-22 cohort were asked how long ago they stopped working in their most recent role. As would be expected from the results of the previous question, a sizeable portion indicated that it had been five or more years since their most recent role (29 per cent). For around one in ten (9 per cent), it had been less than six months since they stopped working in their most recent role.
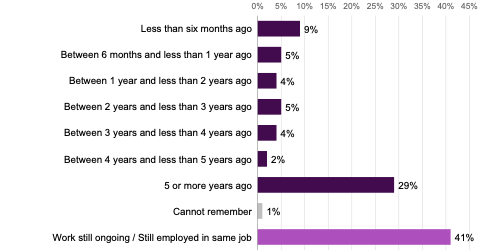
Source: IFF Research telephone survey of FSS customers, B4 How long ago did you stop working in your most recent role? Base: All (750)
Participants from the 2021-22 cohort were more likely to have stopped working in their most recent role five or more years ago than participants from the 2020 cohort (29 per cent compared to 19 per cent). In line with this trend, they were less likely to have stopped working between six months and a year ago (5 per cent compared to 9 per cent amongst the 2020 cohort) and particularly between one and two years ago (4 per cent compared to 17 per cent).