Fair Start Scotland - evaluation report 5: participant phone survey - years 4 and 5 - November 2023
Part of a series of reports on the evaluation of Fair Start Scotland (FSS) employability service. The report presents findings from a representative phone survey with FSS participants. The report covers years 4 and 5 (April 2021 to March 2023) of FSS delivery.
6. Service experiences
This chapter looks at participants’ experiences of signing-up for support, experiences of ‘re-joiners’ (those who have accessed Fair Start Scotland (FSS) support more than once) and the different types of pre-employment and in-work support participants were offered and took up. It also looks at how useful participants found different types of support and reasons participants left the FSS service.
The chapter focuses on experiences of participants from the 2021-22 cohort. It also includes analysis of how these participants’ experiences compared to those of the 2018 cohort (Wave 1 survey), the 2019 cohort (Wave 2 survey) and the 2020 cohort (Wave 3 survey) during the year after they first joined the service, in order to provide a comparison of experiences at the same point in their FSS journey.
6.1 Experience of joining the service
6.1.1 Experience of the sign-up process and awareness of the voluntary nature of the service
All 2021-22 cohort participants were asked whether they were aware that FSS was voluntary and what their experiences of signing up were like. The majority of participants (87 per cent) were aware that signing up for the service was voluntary, 10 per cent thought that they had to take part, and 3 per cent did not know. Minority ethnic participants were more likely than white participants to think signing up was mandatory (17 per cent, compared to 9 per cent), as were those aged between 25 and 34 (16 per cent, compared to 10 per cent on average).
The majority (74 per cent) of all 2021-22 cohort participants reported that it was ‘very easy’ to sign up for the service (a rating of one on a scale from one to five, where one meant ‘very easy’ and five meant ‘very difficult’). Just 4 per cent found it ‘difficult’ (a rating of four or five).
There was some variation across different demographic groups in views on the ease of signing up:
- those who had worked in the last five years before joining the service were more likely to have considered the sign up process ‘easy’ (90 per cent provided a rating of one or two out of five compared with 84 per cent of those who had not worked in the five years prior)
- almost one in ten (9 per cent) minority ethnic participants rated the process as ‘difficult’ (a rating of four or five out of five) compared to only 3 per cent of white participants
- participants from Lot 1 (Glasgow) were more likely to rate the process as difficult than others (8 per cent compared to 4 per cent overall)[25]
- when looking at those who found the process ‘easy’ (a rating of one or two) or ‘difficult’ (a rating of four or five) there was no significant difference as a result of gender, qualification level, or health limitations. Whether or not a participant was a member of a priority family, an early leaver, or a re-joiner also had no significant effect on their overall rating of the ease the process
- there was no significant difference in views of participants on the ease of signing up between Wave 3 and Wave 4
6.1.2 Differences in sign up experiences between the 2021-22 cohort and previous cohorts
Although the proportion of participants who reported being aware that signing up to the service was voluntary at Wave 4 has remained relatively high, the proportion who thought that signing up was mandatory, was double that of Wave 3 (10 per cent compared with 5 per cent).
The proportion of participants who found the sign up process easy remained consistently high across all cohorts.
6.1.3 Experiences of re-joining the service
Those who had previously received support from FSS were asked how they found out they could access the service again. The most commonly mentioned sources were were via the JobCentre (35 per cent), from a Work Coach (11 per cent). Around one in ten had heard directly from a FSS service provider that they were able to re-join (11 per cent). Other less frequently mentioned sources included social media or word of mouth (both 5 per cent), the DWP (4 per cent) or another, unspecified type of advisor (also 4 per cent). In all, half of those who had previously received support from FSS found out that they could re-join the programme from sources relating to Jobs and Skill Centres (JSC) (including the JobCentre, Work Coaches and the DWP).
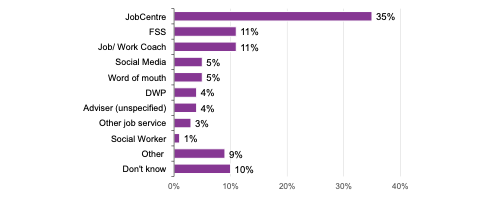
Source: IFF Research telephone survey of FSS customers, C1g How did you find out you could join the service again? Base: Those who re-joined FSS (198)
There were some differences by demographic groups in how participants found out they could re-join the service:
- those aged 50 or over were more likely to have heard this information from the JobCentre (47 per cent compared to 35 per cent on average), while those aged between 25 and 34 were more likely to have heard from a FSS provider (22 per cent compared to 11 per cent on average)
- those who had not worked in the last five years were more likely to have found out about re-joining through the job centre than those who had worked (46 per cent compared to 30 per cent)
- the channel through which participants found out about re-joining did not significantly differ by their gender, their ethnicity, the level of the qualification they held, the extent to which their health limits their day-to-day activity, their Lot (region), or whether or not they were an early leaver of the programme, or from a priority family
Of those in the 2021-22 cohort who were receiving support from FSS for the first time, three quarters (75 per cent) were aware that they would be able to access the service again, should they need to. Participants in the Highlands and Islands area (87 per cent) were particularly likely to be aware of this possibility compared to participants in other service areas[26].
6.2 Support received and usefulness
This section details the different types of pre-employment and in-work support participants were offered and took up, and how useful they found this support. The support offered by FSS can be split into two categories: pre-employment and in work support.
6.2.1 Pre-employment support
All providers delivering employment support for the FSS service are required to offer participants with a minimum level of support and provide support where relevant to participants’ individual needs, including specific elements detailed in the FSS Operational Guidance. These elements can be summarised as:
- one to one support from a dedicated key worker
- a formal monthly review with the key worker
- a quarterly distance travelled assessment and feedback with the key worker
- employability activities as detailed in the individual Employment Action Plan
- engagement with external, specialist or partner services as detailed in the individual Employment Action Plan
- access to work experience opportunities, mentoring and volunteering and appropriate monthly workplace reviews
- weekly job search activities as required by the individual
- employer engagement, including support for interviews and negotiations of reasonable adjustments
- financial guidance
In addition, if through engagement with a participant, a provider identifies that the participant requires specialist support to address a health problem, including professional help to manage mental or physical health conditions and wellbeing interventions, the service provider must contact the specialist supplier organisation on the day that the requirement is established to arrange interview assessment regarding access to specialist support.
For participants for whom the labour market is further away, providers are required to give additional support. This includes additional elements such as specialist support for specific physical or mental health conditions, or for those recovering from drug / alcohol / substance misuse.It also includes support addressing barriers due to records of previous convictions and explaining models such as the Supported Employment Model for Disabled People and the Individual Placement and Support (IPS). The IPS is a model of supported employment proven to work particularly well in offering assistance to people with additional support needs, especially those with severe and enduring mental ill health, to help them find or re-enter sustainable employment that fits their needs and interests. Figure 23 shows the different types of support that participants from the 2021-22 cohort reported that they were offered and how many went on to take up that support. It also shows the types of support that participants can expect to be offered as part of the service regardless of their personal circumstances, and the types of support that participants can expect to be offered depending on their specific needs and circumstances.
Of the 2021-22 cohort, 34 per cent reported they had a mental health condition and 38 per cent of those participants said they were offered specialist support for a mental health condition through the FSS service. By contrast, 19 per cent of 2021-22 participants reported a physical disability, and of those, 21 per cent reported that they were offered specialist support for their physical disability.
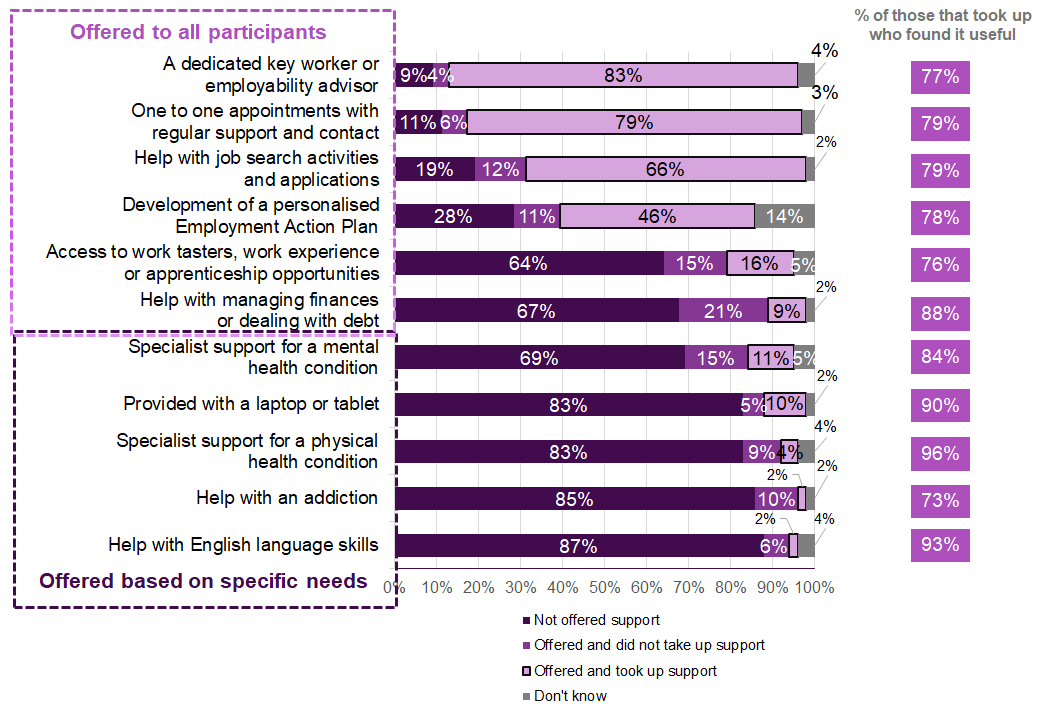
Source: IFF Research telephone survey of FSS customers. D5d: Were you offered the following support to help you remain move into work as part of the Fair Start Scotland service? D5e: Did you take up this support? Base: All 2021-22 cohort receiving support (745). D6: On a scale of 1 extremely useful to 5 not at all useful, how useful would you say that each of the types of support your received were to you? Base: All who used the support type: key worker (617), one to one appointment (594), help with job search activities (501), Employment Action Plan (348), work tasters etc. (117), specialist support with mental health (82), specialist support with physical health (28), specialist support with an addiction (16), help managing finances (71), help with English language skills (15), provided with laptop/tablet (78)
The dark purple bars in Figure 23 show the proportion of 2021-22 cohort that did not recall being offered each support type, for example 28 per cent reported that they were not offered a personalised Employment Action Plan.
Like participants in the 2020 cohort, participants in the 2021-22 cohort who were offered support most commonly took up more generic, widely applicable types of support:
- a dedicated key worker or employability advisor (94 per cent of those offered)
- one to one appointments with regular support and contact (91 per cent of those offered)
- help with job search activities and applications (85 per cent of those offered)
- development of a personalised Employment Action Plan (80 per cent of those offered)
Fewer participants reported being offered other types of support: help with managing finances (31 per cent were offered), access to work tasters, work experience or apprenticeship opportunities (31 per cent were offered), specialist support with a mental health (26 per cent) or physical health condition (13 per cent), and help with English language skills (9 per cent). This can be explained by more specialised support being relevant to fewer participants. Like the 2020 cohort, relatively few participants who were offered more specialised support went on to take it up (e.g. 18 per cent took up help with an addiction, 25 per cent help with English language skills), though 64 per cent of those offered a laptop or tablet accepted this.
Looking at the types of support which participants recall having been offered to them:
- those who had not worked in the last five years were less likely to have been offered a dedicated key worker compared to those who had worked in the last five years (84 per cent compared to 90 per cent) but more likely to have been offered help with English language skills than those who had worked in the last five years (11 per cent compared to 7 per cent)
- those who reported a health condition that limits their everyday activities were more likely to have been offered the development of a personalised Employment Action Plan than those with no condition (62 per cent compared to 54 per cent)
- white participants were more likely to have been offered the development of a personalised Employment Action Plan (61 per cent compared to 47 per cent) and help managing finances (33 per cent compared to 18 per cent) than participants belonging to an ethnic minority. Like the 2020 cohort, they were also more likely to have been offered specialist mental health support (28 per cent compared to 16 per cent) and specialist physical health support (14 per cent compared to 7 per cent)
- female participants were more likely to have been offered one to one appointments (92 per cent compared to 84 per cent for male participants) and specialist mental health support (31 per cent compared to 24 per cent)
- in line with the 2020 cohort, younger participants (aged 16 to 24) were more likely to recall being offered access to access to work tasters, work experience or apprenticeship opportunities (49 per cent compared to 31 per cent on average)
- participants aged 50 and above were more likely to have been offered a laptop or tablet (20 per cent compared to 15 per cent on average)
- in line with the 2020 cohort, participants from Lot 4, Forth Valley were more likely to recall being offered help with managing finances or dealing with debt (46 per cent compared to 31 per cent on average). They were also more likely to have been provided with a laptop or tablet (23 per cent compared to 15 per cent on average)[27]
Looking now at the level of take up for various types of support, there were some differences across participant groups. Take up of support for a mental health condition was lower among 35 to 49 year olds than for 25 to 34 year olds (27 per cent compared to 45 per cent). Older participants (aged 50 and above) were more likely to take up specialist support for a physical health condition than younger participants (50 per cent compared to 29 per cent). Older participants were also more likely to accept help with finances than average (45 per cent compared to 30 per cent on average).
Similar to the 2020 cohort, participants for whom the the labour market is further away tended to be more likely to take up the offer of developing a personalised Employment Action Plan than others. For example, 84 per cent of those who had not worked in the five years prior to joining the service took this up, compared to 77 per cent for those who had worked in recent year. Those with degree level qualifications or higher were also less likely to take this up (71 per cent, compared to 80 per cent on average).
There were some differences in take up of support across the different Lots. Lot 1, Glasgow, saw a lower take up of one to one appointments (85 per cent compared to 91 per cent on average). Take up of the development of a personalised Employment Action Plan was particularly low in Lot 7, North East (66 per cent compared to 80 per cent on average)[28].
Those re-joining the FSS programme were more likely to accept a dedicated key worker than those taking part for the first time (98 per cent compared to 94 per cent).
In Figure 23, the column on the far right shows the proportion of participants who found the support useful out of those who took it up. Similar to the 2020 cohort, around three quarters or more of those who took up each type of support from the 2021-22 cohort found it useful. Specialist support for a physical health condition and help with English language skills emerged as particularly useful to participants. It should be noted that findings on the usefulness of specialist support like help with an addiction, help with a physical health condition or help with English language skills are based on small numbers of participants, given that relatively few took up these types of support. There were some differences across groups regarding the usefulness of support:
- white participants were more likely to find a dedicated key worker useful than ethnic minority participants (79 per cent compared to 69 per cent), as well as one to one appointments (81 per cent compared to 70 per cent)
- early leavers of the programme were less likely than others to find a dedicated key worker useful (65 per cent compared to 77 per cent on average)
- participants with a qualification below degree level (National 1-5 level or equivalent) were more likely to find a dedicated key worker useful than participants with a degree level qualification or above (81 per cent compared to 72 per cent)
- older participants (aged 50 and above) were more likely to find the development of a personalised Employment Action Plan useful (86 per cent compared to 78 per cent on average)
- there was no significant difference between male and female participants, between participants with different levels of qualifications, or between participants who had re-joined the programme when it came to how useful they found these various support streams
- there was no significant difference between how useful participants found this support in Wave 3 and Wave 4
6.2.2 Meeting with a key worker or employability advisor
Participants were also asked how often they met with their key worker or employability adviser. Figure 24 shows that slightly more than half of participants met with their key worker about once a week and around a third met once a fortnight.

Source: IFF Research telephone survey of FSS customers. D7f: How often did you meet with your Adviser/ Key Worker? Base: All who received support from a dedicated adviser / key worker (617)
Only 4 per cent of all participants who were offered a key worker or advisor did not meet with one.
In Wave 4, participants were asked how they usually communicated with their key adviser to receive pre-employment support. Figure 25 shows communication over the phone was the most common method with nearly nine in ten participants (85 per cent) having communicated with their key advisor in this way. Face to face communication is the next most common method (57 per cent of participants spoke to their advisor face to face), followed by email and text messages which were used by half of participants. Only one in ten participants usually communicated with their key worker by video conference call (e.g. Zoom or Teams).
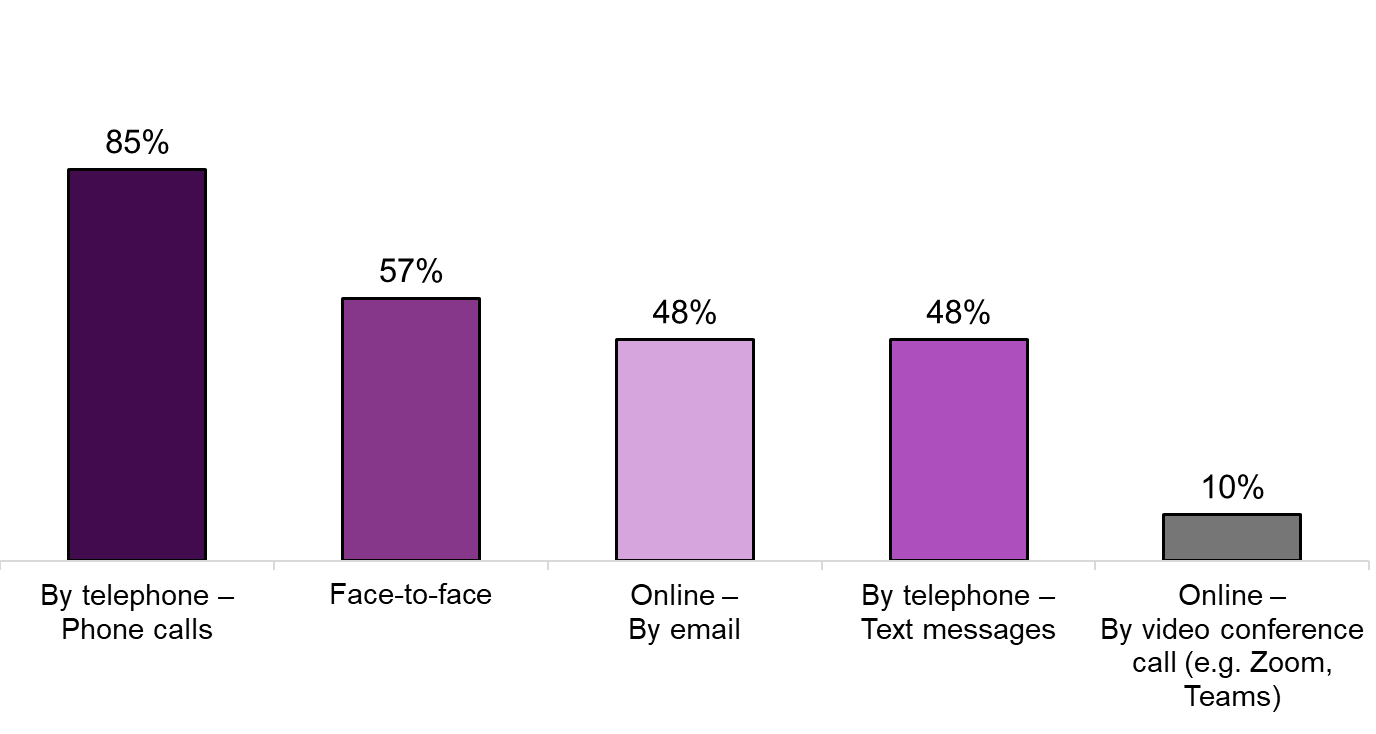
Source: IFF Research telephone survey of FSS customers. D7g: How do/did you usually communicate with your Adviser / Key Worker to receive pre-employment support? Base: All who received support from a dedicated adviser / key worker (617)
6.2.3 Differences in pre-employment support received between the 2021-22 cohort and previous cohorts
The various types of pre-employment support were received to a similar extent by the 2021-22 cohort, the 2020 cohort at Wave 3, the 2019 cohort at Wave 2 and the 2018 cohort at Wave 1[29]. Take up of the development of a personalised Employment Action Plan is consistent with Wave 3 (80 per cent compared to 82 per cent in Wave 3). However, it is lower than in Waves 1 and 2 where 89 per cent of participants recalled taking up the development of an Employment Action Plan.
Participants’ views about the usefulness of the pre-employment support they received was similar across Waves - in Wave 4, 79 per cent of participants found help with job search activities and applications to be useful.
The proportion of participants saying they met with their key advisor once a week has not returned to the level reported by the 2018 and 2019 cohorts (65 and 63 per cent) and remains in line with the 2020 cohort (55 per cent for the 2021-22 cohort compared to 50 per cent for the 2020 cohort). The proportion of participants who met with their key worker about once a month decreased among the 2021-22 cohort compared to the 2020 cohort (6 per cent compared to 12 per cent).
The proportion of participants who recalled being offered a key worker or advisor but who did not meet with one is similar to the proportion among the 2020 cohort (4 per cent compared to 5 per cent).
6.2.4 In-work support
Once a participant has moved into employment, they are entitled to up to 12 months in-work support[30]. The provider will work with the employer and participant, as appropriate and determined by the participant, to identify the support required for the participant to start and sustain employment. Thereafter the provider will provide a period of in-work support, which has the ambition of supporting job retention / progression in terms of skills and / or income. Participants have the choice as to whether they will access in-work support and may decide to take only certain elements of the support dependent on their individual needs. The following elements detail the range of support available:
- continued weekly contact with a dedicated key worker, reducing over time
- an In-work Support Action Plan detailing a timeline for workplace reviews with the employer and setting out future objectives
- support provided to the participant at their work induction
- financial guidance to the individual if necessary
- ensuring the participant is aware of changes to their benefit entitlement and that they are receiving all appropriate in-work benefit
- provide support to training at workplace (if necessary)
- giving information about travel options to and from work, taking into consideration the participants’ needs
- an exit plan for leaving the FSS service
For participants who are further removed from the labour market, providers should also provide Job and Task Analysis and deliver tailored support to match participants’ individual requirements. The Supported Employment Model and Individual Placement Support model should also be adhered to where applicable.
All FSS participants who are in work can expect to receive in-work support. However in order to gather the most relevant insights, the survey included questions pertaining to in-work support which were only asked of those who were working at least 16 hours per week. Within this group in the 2021-22 cohort, 54 per cent recalled being offered any type of in-work support. This is an increase compared to the 2020 cohort in Wave 3 (43 per cent) but is still lower than Wave 1 (67 per cent).
Figure 26 shows the proportion of the 2021-22 cohort who were working at least 16 hours per week at the time of the survey who were offered and took up the various forms of in-work support, and how useful they found it.
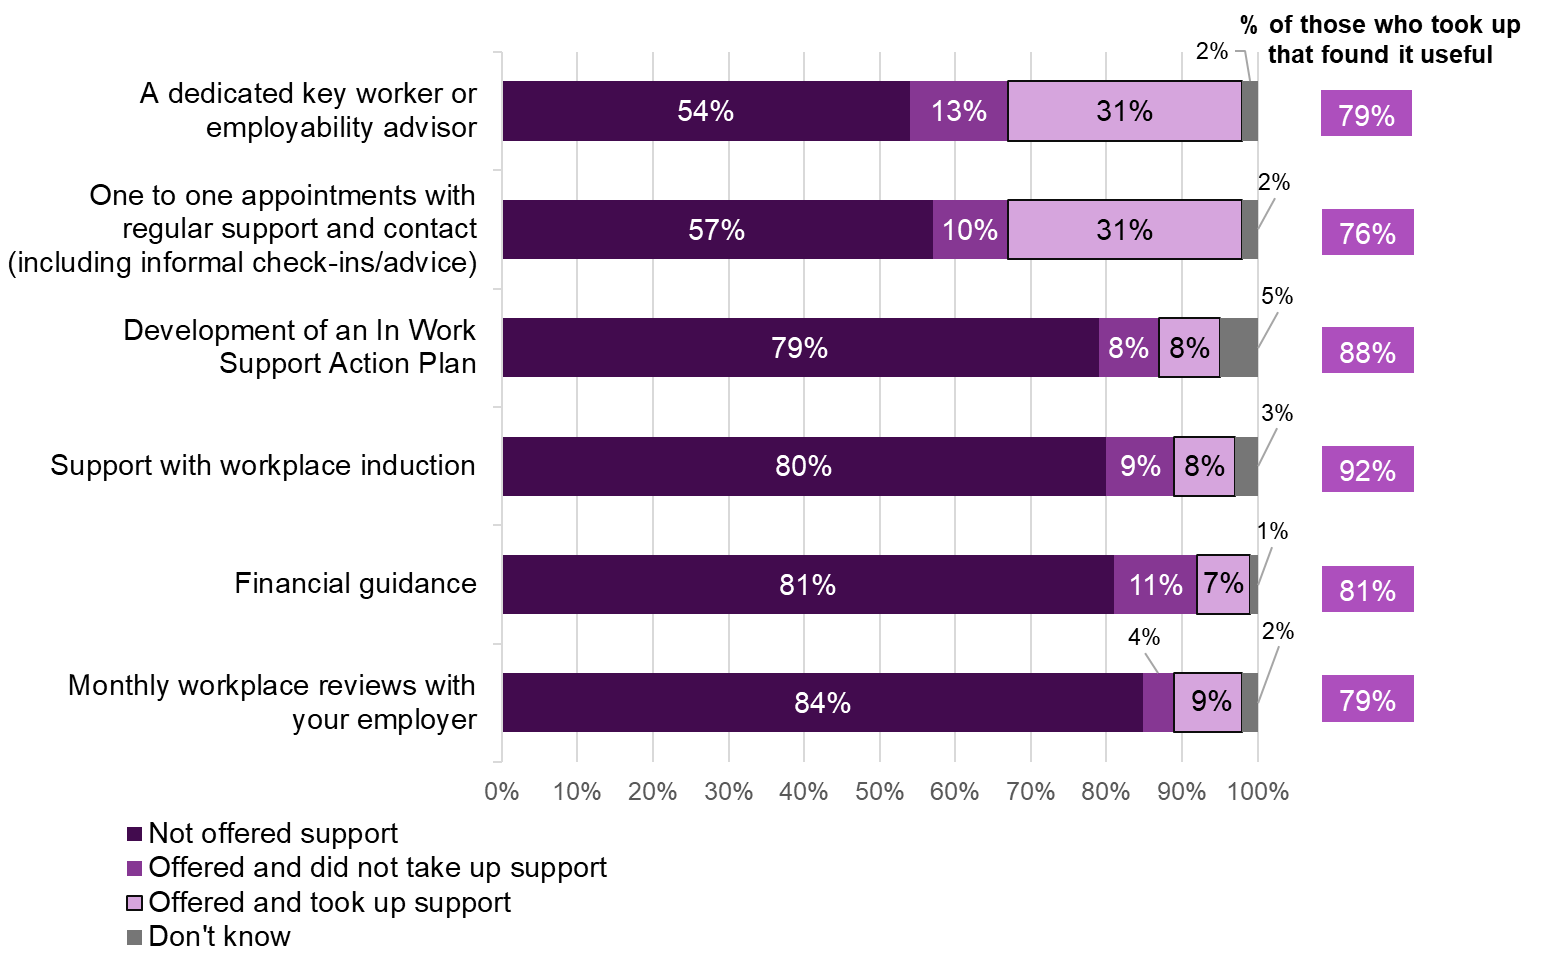
Source: IFF Research telephone survey of FSS customers. D11h: Were you offered the following in-work support to help you remain in work as part of the Fair Start Scotland service? Base: All 2021-22 cohort who were in work 16 or more hours a week (269) D11i: Did you take up this support? Base: All 2021-22 cohort who were in work 16 or more hours a week (269). D11j: On a scale of 1 extremely useful to 5 not at all useful, how useful would you say that each of the types of support your received were to you? Base: All 2021-22 cohort who used the support type: key worker (83), one to one appointment (83), workplace inductions (22), In Work Support Action Plan (23), financial guidance (19), monthly reviews (26)
Similar to Wave 3, participants were most likely to take up support from a dedicated key worker (31 per cent of all participants and 70 per cent of those offered), followed by one to one appointments with regular support and contact (31 per cent of all participants and 75 per cent of those offered), and monthly workplace reviews with their employer (9 per cent of all participants and 70 per cent of those offered). Due to very small base sizes it is not possible to comment on differences between groups of participants or among different FSS Lots for those who were offered or took up in-work support. It is also not possible to compare findings across waves.
The proportion of participants who were offered and took up in-work support is generally lower than pre-employment support, in line with previous waves. Perceptions of the usefulness of in-work support are high, similar to those for pre-employment support. Support with workplace induction was felt to be most useful (92%) followed by the development of an In Work Support Action Plan (88%). It should be noted that results on the usefulness of support types have small base sizes and should therefore be interpreted cautiously.
6.3 Overall views of support
The 2021-22 cohort were asked about different aspects of the support they received. The Fair Start Scotland service is built upon the Scottish Government’s key values for public services: Dignity and respect; Fairness and equality; Continuous improvement. To gather participants’ views about the support they received, the survey asks them to give their agreement with a list of statements based on these key values.
Figure 27 shows that most participants had a positive attitude towards the support they received from FSS. Between 79 and 93 per cent of participants agreed that the service provided was consistent with the Scottish Government’s key values. In line with the 2020 cohort, participants were most likely to agree they were treated with dignity and respect (93 per cent).

Source: IFF Research telephone survey of FSS customers. D13: To what extent do you agree with the following statements about the support you have received. Base: All 2021-22 cohort receiving support (745)
There were some differences in attitudes between demographic groups:
- those who had not worked in the last 5 years were less likely to agree that the service offered support to improve their general quality of life and wellbeing (77 per cent compared to 84 per cent among those who had worked in the last 5 years). They also felt less in control of their progress on the service (78 per compared to 83 per cent)
- those with a degree level qualification or higher were less likely than the average to agree with all but one of the statements (When receiving support from FSS I felt I was treated with dignity and respect)
- those who have a health condition which limits their day to day activities were less likely to agree that FSS offered support to improve their general quality of life and wellbeing compared to those whose day to day was not affected by their health condition (79 per cent compared to 90 per cent)
- minority ethnic participants were less likely than white participants to agree that the service they received took account of their individual needs and circumstances (71 per cent compared to 82 per cent). They also felt less in control of their progress on the service (68 per compared to 83 per cent). This difference is also seen in how much they feel they have choices about the type of support they receive and how much they feel they can set their own goals (71 per cent compared to 85 per cent). These differences are consistent with the 2020 cohort
- participants classified within ‘priority family groups’ were less likely to feel that FSS provided support that took account of their individual needs and circumstances compared to other participants (74 per cent compared to 81 per cent). This was similar for all parents compared to non-parents (73 per cent compared to 82 per cent)
- age and gender did not significantly influence participants likelihood to agree or disagree with the statements about the support they received from FSS
- overall, satisfaction with the FSS service has not changed over time and has remained high
6.4 Views on further support participants would have liked to receive
Participants were asked an open text question about whether there was any other type of support that they wished they could have received from FSS to help them move closer to work. Most participants (73 per cent) felt there was no other type of support they would have liked to receive. This has reduced slightly compared to Wave 3 (78 per cent). Of those that did wish they could have received another type of support, only a small proportion of participants mentioned specific support types, with no primary gap identified in the offer.
The types of support participants would have wanted to receive include:
- more training courses (25 participants)
- more personalised help (21 participants)
- for FSS to display greater consideration of participants’ health issues when offering support (20 participants)
- financial advice or support (15 participants)
- for FSS to be easier to get in contact with (12 participants)
- for FSS to provide more relevant employment opportunities (11 participants)
- face to face meetings (12 participants)
Views on types of support participants would have wanted to receive varied slightly between demographic groups. Female participants were more likely to have wanted face to face meetings (3 per cent compared to 1 per cent for male participants). Participants with a degree or above would have wanted more personalised help (7 per cent compared to 3 per cent on average) and relevant employment opportunities (4 per cent compared to 2 per cent on average).
Participants belonging to an ethnic minority group were more likely to say they would have wanted other types of support from FSS than white participants. For example, they were more likely to mention training courses (8 per cent compared to 3 per cent) and more personalised help (7 per cent compared to 2 per cent) than white participants. This trend is consistent with Wave 3.
6.5 Problems or concerns with FSS
Participants were asked whether their provider had explained to them what to do if they have a problem or a concern about the service. Just over half of participants (53 per cent) said they did recall receiving this information, however over a third (36 per cent) said they did not recall receiving this (11 per cent did not know). Participants aged 16 to 24 were more likely than average not to recall being told what to do if they had a problem or concern (45 per cent compared to 36 per cent). Participants from an ethnic minority were also less likely to recall this than average (47 per cent compared to 36 per cent).
Participants were also asked about whether they did experience any problems or concerns about the service during the time when they were receiving support. Just over one in ten (11 per cent) said they did have some type of problem or concern.
Groups who were more likely than on average to report that they experienced problem or concern about the service included:
- those with a degree level qualification or higher (16 per cent)
- those in Lot 5 (East) (17 per cent)[31]
- early leavers (18 per cent)
There were no differences in the likelihood of reporting a problem or concern by gender, age, employment status, health status, ethnicity, parental status or re-joiner status.
6.6 Reasons for ending engagement with FSS
Figure 28 below shows the proportion of 2021-2022 cohort participants who were still receiving support and those who were not, including a breakdown of those who were registered on FSS database as having left the support early. This shows that one in five participants were recorded as leaving the service early, and most of these (16 per cent) were not working more than 16 hours per week at the time of the survey. The proportion of early leavers has increased compared to the 2020 cohort (20 per cent compared to 13 per cent). According to the Fair Start Scotland annual report for Year 4 of service provision, the early leaver rate for those joining the service from April 2018 to September 2021 is 52 per cent, so the early leaver group is underrepresented in this research. This could be linked to difficulties in engaging with early leavers. That said, the number of early leavers surveyed (143 participants) is large enough to allow comparisons against other FSS participants.
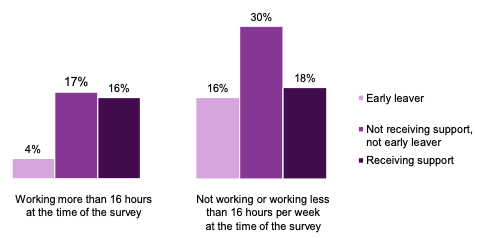
Source: IFF Research telephone survey of FSS customers. D1: Are you currently receiving support from Fair Start Scotland? and management information data on early leavers collected by FSS. Base: All participants for whom early leaver data was available (715)
All participants who had stopped receiving support from FSS were asked about why they left the service.Figure 29 shows that the most common reasons for participants having ceased engagement with the service were that they found work (30 per cent) and that the programme of support came to an end (14 per cent), in line with the previous wave.
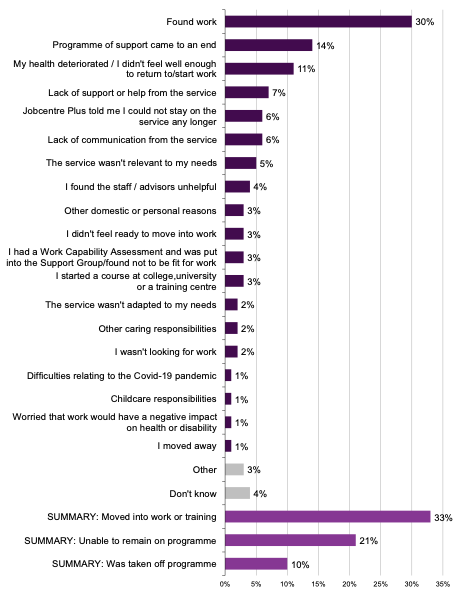
Source: IFF Research telephone survey of FSS customers. D4: Why did you leave the support service?[32] Base: All 2021-2022 cohort no longer receiving support (455)
Figure 29 represents responses from both participants who were recorded on FSS’s database as having left the service early and those who were recorded as having completed the support program. Like in Wave 3, those who were recorded as ‘early leavers’ were less likely to say they left the service because they found work, than those who were recorded as completing the program (19 per cent, compared to 34 per cent).
As shown in Figure 29, there were some differences between ‘early leavers’ and other participants in this wave: early leavers were more likely to say they left because of a lack of support or help from the service (13 per cent compared to 5 per cent), because the service wasn't relevant to their needs (10 per cent compared to 3 per cent), because they were found to be unfit for work (8 per cent compared to 1 per cent) and because they started a course at college, university or a training centre (5 per cent compared to 2 per cent).
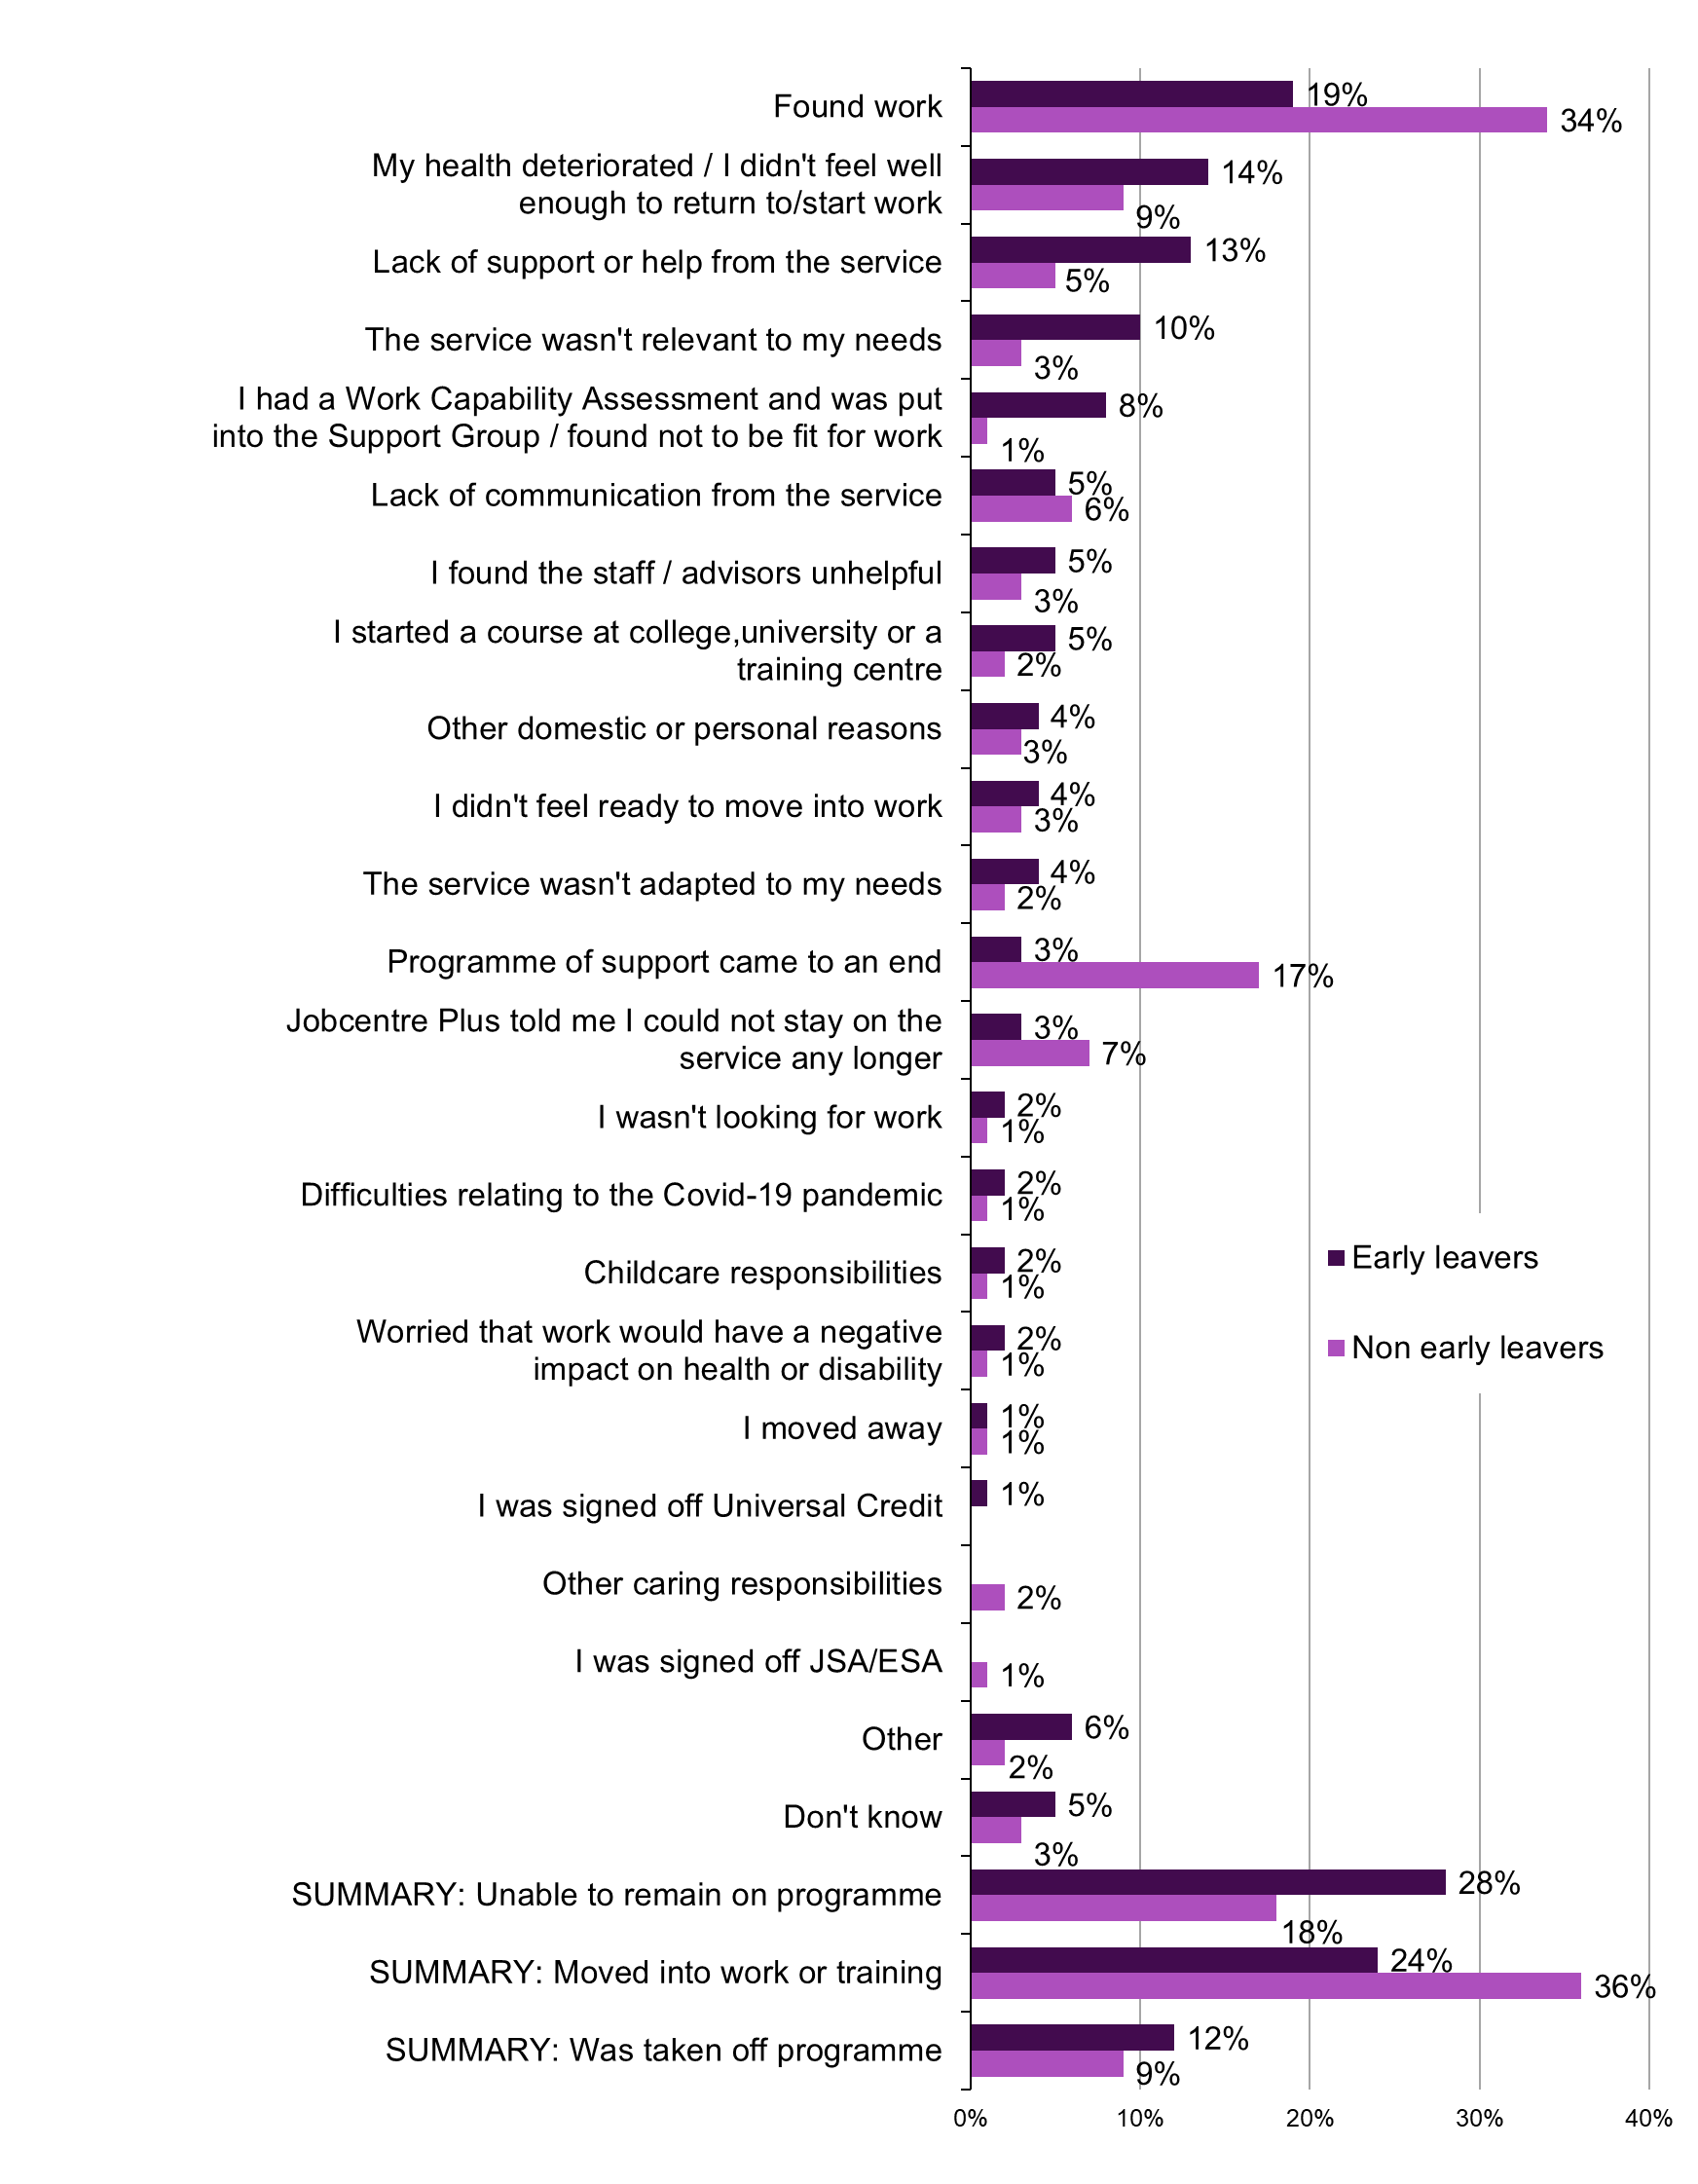
Source: IFF Research telephone survey of FSS customers. D4: Why did you leave the support service? Base: Early leavers from the 2021-2022 cohort no longer receiving support (123) Non-early leavers from the 2021-2022 cohort no longer receiving support (332)
Participants aged 50 and above were less likely to have left the service because they found work (16 per cent compared to 30 per cent on average) and more likely to have left because their health deteriorated (17 per cent compared to 11 per cent on average). Fewer older participants said they had left the service as a result of being found unfit for work in a Work Capability Assessment, compared to feeling their health had deteriorated (only 4 per cent compared to 17 per cent for the latter). Of all those who left early, participants with a qualification at degree level or higher were more likely to have left because they felt the service wasn't relevant to their needs (12 per cent compared to 5 per cent on average).
Similar to Wave 3, participants with a limiting health condition were less likely to have left the service because they found work than those whose condition did not limit their day to day activities (17 per cent compared to 49 per cent) and were more likely to have left because their health deteriorated (19 per cent compared to 3 per cent).
6.7 Reasons for leaving the service for the 2021-22 cohort and the previous cohorts
Figure 31 shows the most common reasons why participants left the FSS service among the 2018, 2019, 2020 and 2021-22 cohorts. Participants from the 2021-22 and 2020 cohorts were more likely to have left the service because they found work than participants from the 2019 or 2018 cohorts (30 and 29 per cent, compared to 19 per cent and 21 per cent respectively). It is worth noting that in the 2022 cohort, fewer participants were still receiving support at the time of the survey compared to previous waves (34 per cent compared to around 50 to 60 per cent in previous waves).
Similar to Wave 3, participants in the 2021-22 cohort were less likely to report that their programme of support had come to an end than those in the 2018 cohort (14 per cent compared to 22 per cent). Fewer participants indicated they left the service because the service wasn’t relevant to their needs than previous waves (5 per cent in Wave 4 compared to around 15 per cent in previous waves). However, more participants indicated they left the service because their health deteriorated (11 per cent compared to 5 per cent in the last wave).
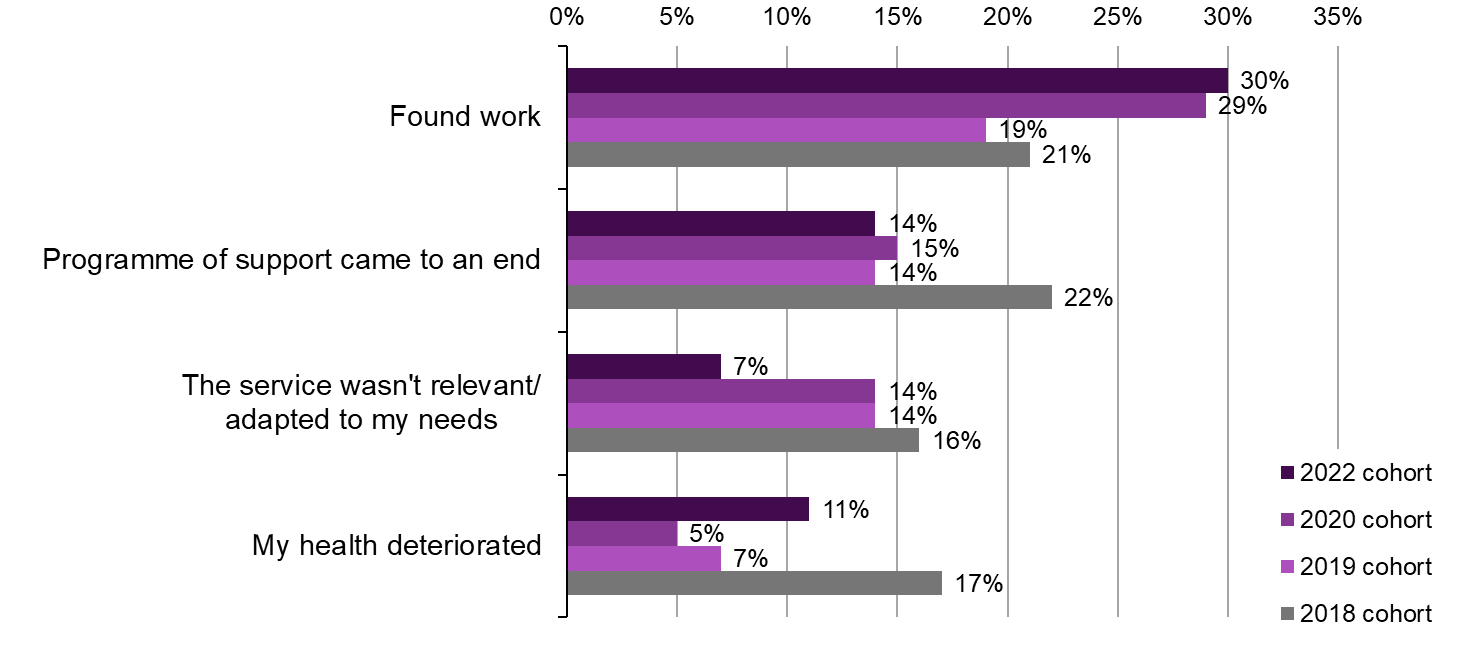
Source: IFF Research telephone survey of FSS customers. D4: Why did you leave the support service? Base: 2021-22 cohort no longer receiving support (455) 2020 cohort no longer receiving support (224) 2019 cohort no longer receiving support (233) 2018 cohort no longer receiving support (456)
6.8 Whether FSS helped participants to find a job
Participants in the 2021-22 cohort who were employed, self-employed, or had worked in the last week were asked whether the support they received from FSS helped them to get their job.Figure 32 shows that most participants (63 per cent) felt FSS had helped them to get their jobs, with a sizable proportion strongly agreeing (40 per cent). Agreement was the highest it has been across all waves except Wave 2 (72 per cent). One quarter (24 per cent) of participants in work or had worked in the last week disagreed that FSS helped them to get their job. Early leavers were less likely to agree that the support they had received had helped them get their job compared to those who had completed their programme of support (26 per cent compared to 69 per cent).There were no other notable differences between subgroups in the 2021-22 cohort.
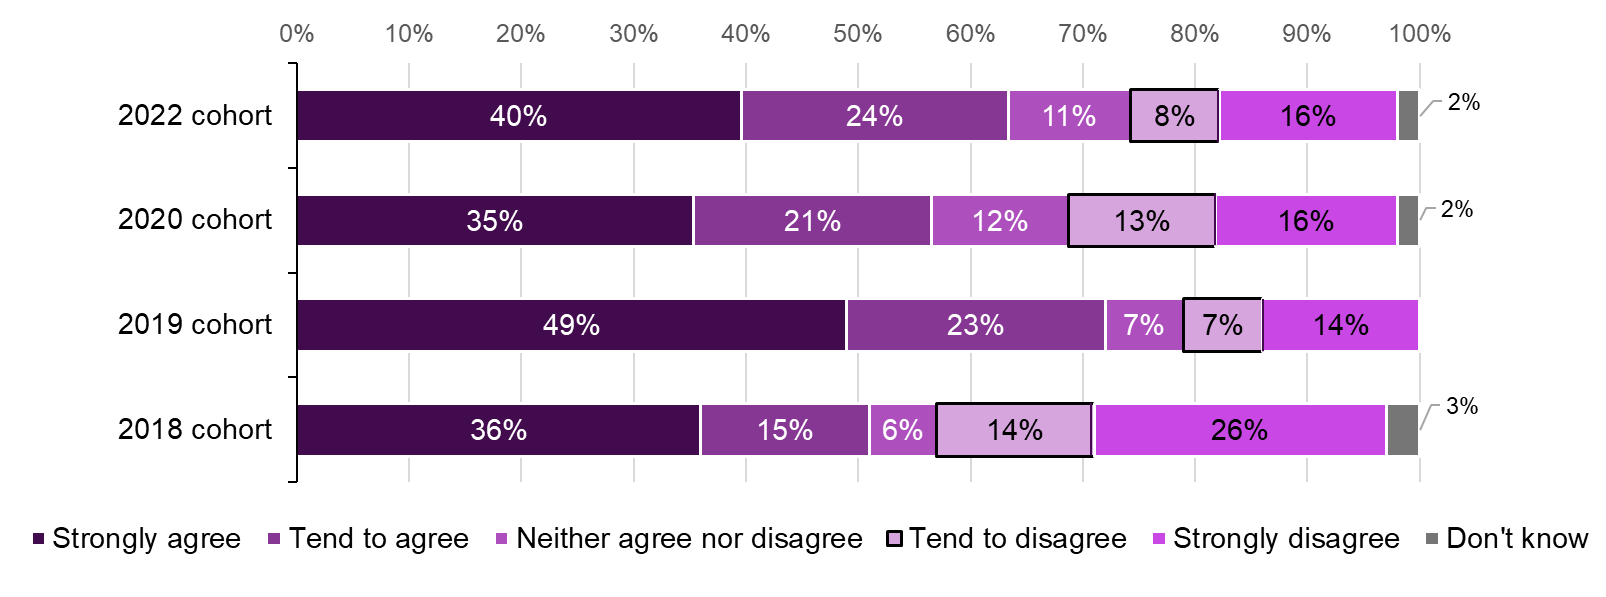
Source: IFF Research telephone survey of FSS customers. A9 To what extent would you agree that the support you received from Fair Start Scotland helped you to get your job? Base: All employed, self-employed or have worked in the last week 2018 cohort (47) 2019 cohort (64) 2020 cohort (247) 2021-22 cohort (298)