Fair Start Scotland: evaluation report 4 - participant phone survey - year 3
Part of a series of reports on the evaluation of Fair Start Scotland (FSS) employability services. The report presents more detailed findings from a representative telephone survey of FSS participants and explores their experiences in the third year of delivery
2018 cohort: Outcomes over time
The 2018 cohort were first surveyed at Wave 1 in June 2019, then again at Wave 2 in May 2020, and finally at Wave 3 in March 2021. 159 participants from the 2018 cohort took part in Wave 3, meaning that the base size is often low, and findings should be interpreted with caution. This chapter will look at the outcomes over time and any changes in responses of the 2018 cohort over the three Waves of the survey. It will follow a similar format to previous chapters highlighting the topline figures for the responses of the 2018 cohort at Wave 3, but it will also flag where responses of the 2018 cohort have changed across Waves.
Employment status of the 2018 cohort
At the time of the Wave 3 survey slightly over one quarter (28 per cent) of the 2018 cohort were either working for an employer in a paid role (26 per cent) or self-employed (2 per cent) in a typical week. However, the majority were not in work, with close to six in ten (57 per cent) not in work and claiming an out of work benefit and around one in twenty (6 per cent) not working and not claiming an out of work benefit (9 per cent). A further one in twenty-five were in education or training (4 per cent), as shown in Figure 47.
Among those who said they were not working for an employer and were not self-employed, 1 per cent said had done some paid work within the last week.
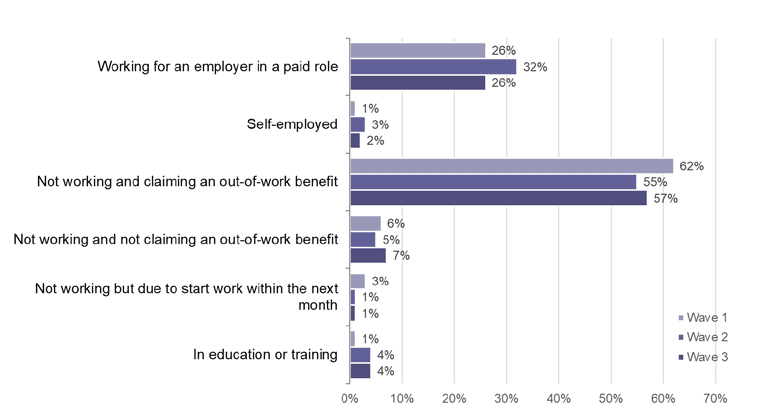
Source: IFF Research telephone survey of FSS customers. A1. Which of the following best describes what you are doing at the moment? Base: 2018 cohort Wave 1 (1005), Wave 2 (400), Wave 3 (159)
Figure 47 shows that between Wave 1 and 2 there was a significant increase in the amount of the 2018 cohort working for an employer in a paid role (26 per cent at Wave 1 compared to 32 per cent at Wave 2) and a significant decrease in the proportion of the cohort not working and claiming an out of work benefit (62 per cent at Wave 1 compared to 55 per cent Wave 2). At Wave 3, around a quarter were working for an employer (26 per cent) and over half were claiming an out of work benefit (57 per cent). Any changes to working status between Wave 2 and Wave 3 were not significant due to the lower base sizes.
As in the previous chapter we are able to look at the overall movement of working status for the cohort between Waves. Figure 48 shows the change in working status, using the FSS classification of pre-work and in-work (working less than 16 hours per week, or more than 16 hours per week.) Two-thirds (66 per cent) of the 2018 cohort interviewed at both Wave 1 and Wave 3 of the survey were not in employment at either Wave. One in ten (10 per cent) were not employed at Wave 1 but were employed at Wave 3 and a similar amount (11 per cent) were employed at Wave 1 but not employed at Wave 3. Sixteen per cent were employed at both Wave 1 and Wave 3.
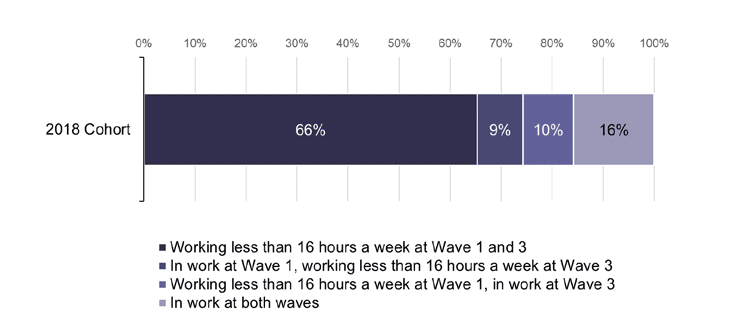
Source: IFF Research telephone survey of FSS customers. Change in employment status Base: All 2018 cohort interviewed at Wave 3 (158)
Similarly, Figure 49 shows the change in employment status of the 2018 cohort between Wave 2 and Wave 3. Two-thirds (66 per cent) of the cohort were not in employment at Wave 2 or Wave 3 and less than one in ten (8 per cent) were in employment at Wave 2 and not in employment at Wave 3. Just under a quarter were in employment at both Waves, but only two per cent were had moved from unemployment to employment between Wave 2 and 3.
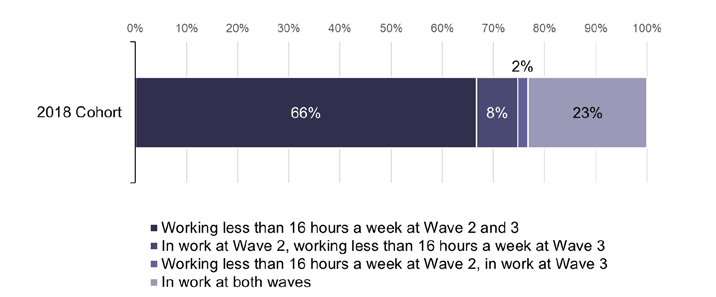
Source: IFF Research telephone survey of FSS customers. Change in employment status Base: All 2018 cohort interviewed at Wave 3 (158)
The 2018 cohort were asked at Wave 2 and Wave 3 what they had mostly been doing since they were last spoken to a year previously. At both Waves the majority said that their situation had remained the same (64 per cent at Wave 2 and 71 per cent at Wave 3). Figure 50 shows the reported change in employment status of the 2018 cohort split by number of hours working at Wave 2. Three-quarters (75 per cent) of the 2018 cohort working less than 16 hours per week at Wave 2 were still not working at Wave 3 and a further six per cent reported that they had mostly been out of work since Wave 2. Only one in twenty-five (4 per cent) said that they had mostly been working since Wave 2.
For those working more than 16 hours per week at Wave 2 there was also a majority (58 per cent) that were in the same situation as before, with a further fifteen per cent reporting they had mostly been in work since Wave 2. A small number (7 per cent) of the 2018 cohort that had been working for 16 hours or more at Wave 2 reported that they had mostly been out of paid employment in the year between the two surveys.
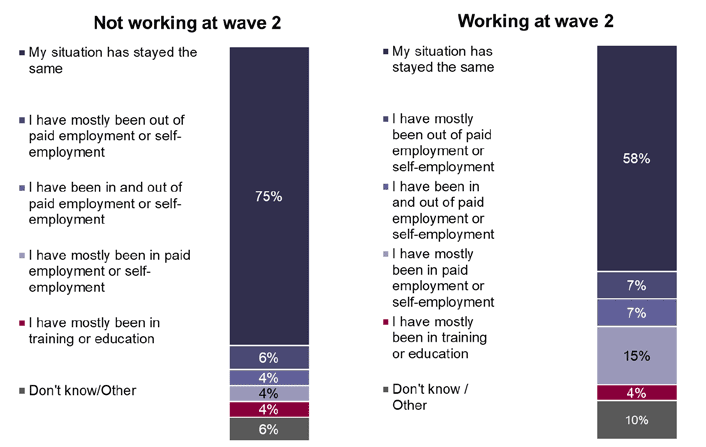
Source: IFF Research telephone survey of FSS customers. B1a_w3 Which of the following best describes what you have been doing since the last survey? Base: Pre-employment at Wave 2 (109) In employment at Wave 2 (50)
COVID-19
At Wave 3, a quarter (24 per cent) of the 2018 cohort said that their employment situation had changed as a result of the COVID-19 pandemic. Figure 51 shows the responses of the 2018 cohort at Wave 3 to how the Covid-19 pandemic affected their employment situation. Most were not affected (74 per cent), however eight per cent had lost their job and over one-in twenty (6 per cent) were on furlough. The only significant change between the responses at Wave 2 and Wave 3 was the 5 per cent at Wave 3 who said they were unable to find employment, which had not come up at Wave 2.
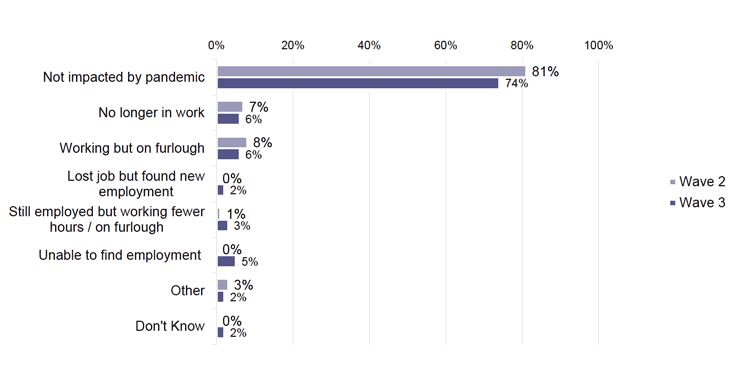
Source: IFF Research telephone survey of FSS customers A1c_W3. How has the COVID-19 pandemic impacted your employment situation? Base: All 2018 cohort Wave 3 (159) Wave 2 (400)
Quality of work
Questions were also asked to the 2018 cohort who were working about the quality of the work they were doing. As can be seen in Figure 52, of the 2018 cohort that had done some paid work in the week prior to the interview almost six in ten (58 per cent) were working thirty or more hours per week, almost three in ten (28 per cent) were working sixteen to twenty-nine hours per week and fifteen per cent were working fewer than sixteen hours per week. Working hours had not changed significantly between the Waves.
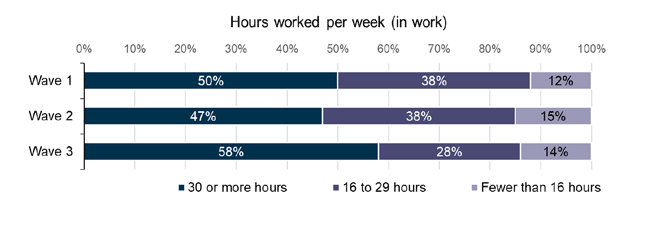
Source: IFF Research telephone survey of FSS customers A3_W3. How many hours per week do you usually work, or spend in education? Base: All working. Wave 1 2018 cohort (291) Wave 2 2018 cohort (145) Wave 3 2018 cohort (47)
Almost three-quarters (73 per cent) of the 2018 cohort that had done some paid work in the week prior to the interview had begun their job more than a year ago. There has been significant growth at each Wave in the proportion of the 2018 cohort to have started their job over a year ago suggesting those that find work were managing to sustain it. As shown in Figure 53, at Wave 1 just over one in twenty (6 per cent) had started work over a year ago, by Wave 2 this had risen to forty-four per cent and at Wave 3 almost three-quarters had begun over a year before the interview. These figures indicate, as they did at Wave 2, that those who have entered work were able to sustain it over a period of time.
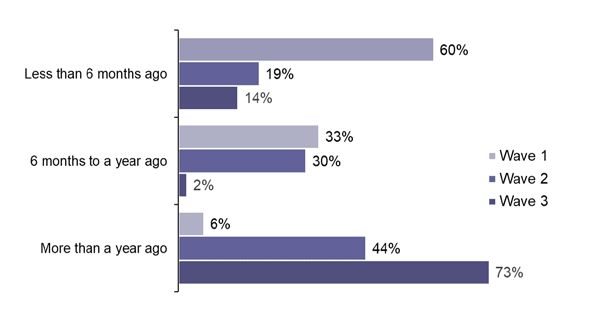
Source: IFF Research telephone survey of FSS customers A3B.When did you start working in your current or most recent job? Base: All working. Wave 1 2018 cohort (286) Wave 2 2018 cohort (146) Wave 3 2018 cohort (48)
The 2018 cohort who were working were also asked about their pay per hour at Wave 2 and Wave 3, as well as types of employment contract. Due to the low base sizes these questions were not charted, and no significant differences were found between waves.
Outcomes and motivation to return to work
Figure 54 shows that, when asked at Wave 3, most (86 per cent) of the 2018 cohort that were working fewer than sixteen hours per week wanted to return to work in the future at least at all (61 per cent to a great extent, 17 per cent to some extent, 9 per cent a little). Around one in fourteen (7 per cent) did not want to return to work at all.
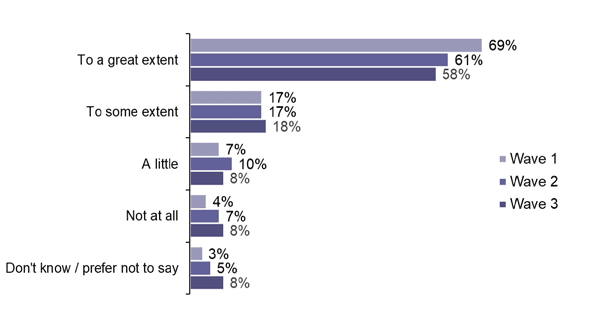
Source: IFF Research telephone survey of FSS customers, E2_W3. To what extent would you like to return to (full time) work in the future? Base: All who work fewer than 16 hours per week. Wave 1 (754) Wave 2 (274) Wave 3 (118)
The extent to which the 2018 cohort wanted to return to work has decreased to somewhat over the last three years. More than nine in ten (93 per cent) wanted to return to work at all at Wave 1 which fell by a small but significant amount at Wave 2 to eighty-nine per cent. The fall between Wave 2 (89 per cent) and Wave 3 (86 per cent) was not significant.
Similarly, there was a fall between Wave 1 and Wave 2 of the 2018 cohort in the number that wanted to return to work to a great extent. Around seven in ten (69 per cent) wanted to a great extent to return to work in the future this fell to around six in ten (61 per cent). This figure remained steady at Wave 3 (58 per cent).
The 2018 cohort were also asked at all three Waves whether their motivation to return to work had increased or decreased since they started receiving support from FSS, the results of which can be seen in Figure 55. Almost half (48 per cent) of the cohort at Wave 3 said that their motivation had increased (25 per cent a lot and 24 per cent a little). Slightly over one fifth said that their motivation had not changed since receiving support from the service and around a quarter (24 per cent) said their motivation had decreased, either a little (13 per cent) or a lot (11 per cent).
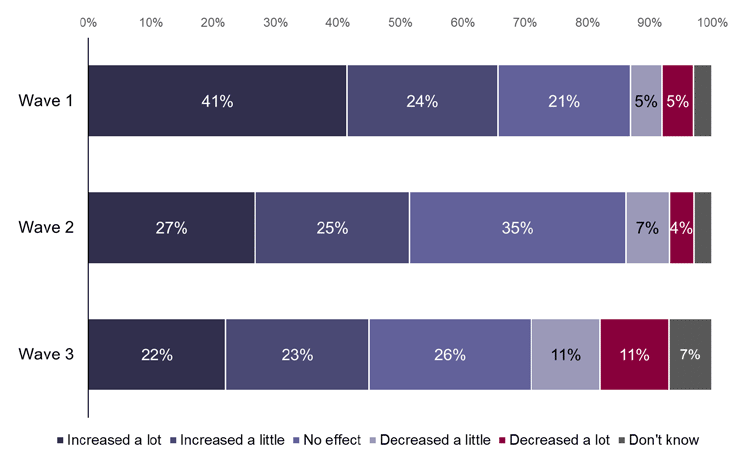
Source: IFF Research telephone survey of FSS customers, E8_W3. To what extent would you say your motivation to find (full time) work has increased or decreased from when you began receiving support from the Fair Start Scotland service? Base: 2018 cohort who work fewer than 16 hours per week. Wave 1 (754) Wave 2 (274) Wave 3 (118)
The positive impact that the service was having on motivation has stagnated over the three Waves of the survey for the 2018 cohort. At Wave 1 around two-thirds (65 per cent) had said that their motivation to find full time work had increased since joining the service. The proportion saying that their motivation had increased since joining the service fell to around a half at Wave 2 (52 per cent) and remained at that level through to Wave 3 (48 per cent).
Barriers to work
The 2018 cohort were asked at Wave 2 and Wave 3 what the main issues or barriers that were preventing them from working. Figure 56 shows the responses of the 2018 cohort. Consistent with Wave 2 the most common barrier facing the cohort was having a physical health condition that makes it difficult to carry out tasks at work (23 per cent at Wave 2 and 21 per cent at Wave 3). There were no other significant differences apart from that the COVID-19 pandemic made it difficult to work (8 per cent) which was only mentioned at Wave 3.
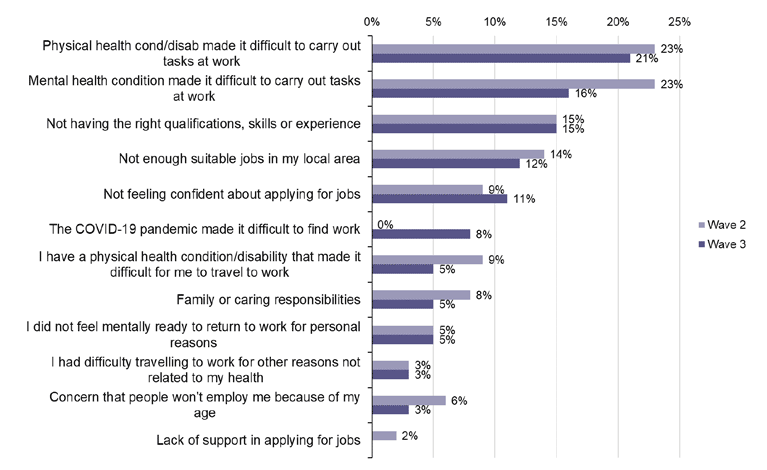
Source: IFF Research telephone survey of FSS customers F1A_w2/w3. What would you say were the main issues or barriers preventing you from working? Base: All 2018 cohort respondents Wave 2 (400) Wave 3 (149) Note, answers below 2 per cent are not shown due to small base sizes.
The impact of FSS support on overcoming barriers to work for the 2018 cohort
The 2018 cohort were then asked at both Waves 2 and 3 to what extent they thought the support received from FSS had helped them to overcome each of their reported barriers, on a scale from one, 'had no impact' to five, 'helped a lot'.
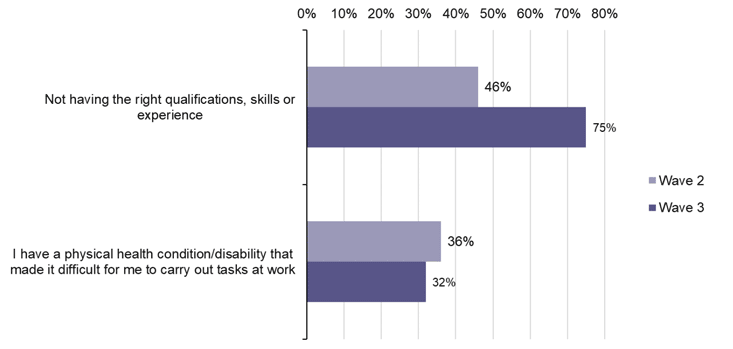
The proportion of participants who said, that the support had helped them to overcome the barrier at Wave 3 (i.e. scored either a 4 or 5) are shown in Figure 57 for the most commonly experienced barriers.
In this case, the only barrier with a large enough base size for analysis was "I have a physical health condition that made it difficult for me to carry out tasks at work". There was no significant change between Wave 2 and Wave 3 for this barrier (36 per cent Wave 2, 32 per cent Wave 3). Also included in Figure 57 was the barrier "not having the right qualifications, skills or experience". The proportion who reported that FSS support had an impact on this barrier at Wave 3 was significantly higher than at Wave 2 (75 per cent compared to 46 per cent at Wave 2), despite the low base size (24 participants at Wave 3).
There were no other significant changes, likely due to the low base sizes.
Source: IFF Research telephone survey of FSS customers F1B-1-W2. To what extent do you think the support you received from Fair Start Scotland helped you to overcome these barriers? All of 2018 cohort that answered; Not having the right skills qualifications or experience Wave 2 (50), Wave 3 (24I have a physical health condition / disability that made it difficult for me to carry out tasks at Wave 2 (94) Wave 3 (34)
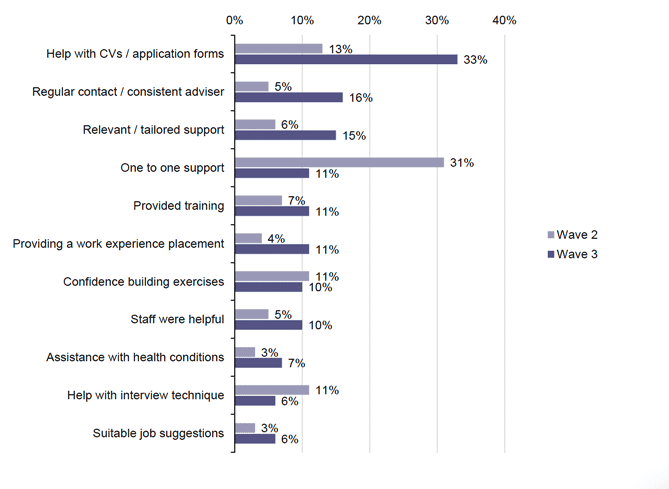
The 2018 cohort were also asked at Wave 2 and Wave 3 about which parts of the support they felt made the most difference to them. The types of support mentioned at Wave 3 were broadly the same as at Wave 2, although some support types were mentioned more or less frequently at the different Waves, as shown in Figure 58.
At Wave 2, participants were most likely to mention the one to one nature of the support (31 per cent at Wave 2 compared to 11 per cent at Wave 1). This may be due to the changing nature of delivery of support due to the pandemic.
At Wave 3, the 2018 cohort were more likely to mention help with CVs / application forms (33 per cent at Wave 3 compared to 13 per cent at Wave 2); regular contact or a consistent advisor (16 per cent Wave 3 compared to 5 per cent at Wave 2); and relevant or tailored support (15 per cent at Wave 3 compared to 6 per cent at Wave 2).
Job search skills
Participants were asked at each Wave to rate how confident they felt about completing nine different job-search related activities successfully on a scale of 1 to 5, where 1 is 'not at all' and 5 is 'a great deal'. This is known as the Job Search Self Efficacy (JSSE) Index[20]. The proportion of participants who felt confident in each activity (scored 4 or 5) are shown in Figure 59.
The 2018 cohort were likely to feel confident about doing most activities at Wave 3, however less than half (48 per cent) felt confident contacting and persuading potential employers to consider you for a job.
The figure also shows that generally confidence is Job searching had stayed consistent across the Waves with limited differences. However, there were some elements where confidence had fallen between Wave 1 and Wave 3, interestingly, all of these involved the communication and social elements of job searching. They were:
- Talking to friends or contacts to discover promising job openings suitable for you (65 per cent at Wave 1 compared to 53 per cent at Wave 2)
- Talking to friends or other contacts to find potential employers who need your skills (65 per cent at Wave 1 compared to 51 per cent at Wave 3)
- Contacting and persuading potential employers to consider you for a job (51 per cent at Wave 1 compared to 42 per cent at Wave 2)
The average score on the JSSE didn't vary significantly across the Waves, at Wave 3 it was 3.7, at Wave 2 it was 3.8 and at Wave 1 it was also 3.8.
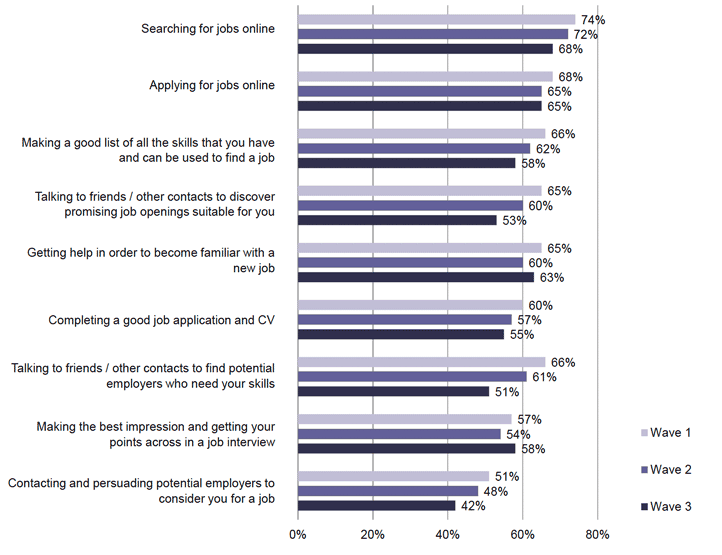
Source: IFF Research telephone survey of FSS customers. F2-W3. How confident do you feel about doing the following things successfully? Base: All 2018 cohort Wave 1 (1005), Wave 2 (400) Wave 3 (159)
There have been limited changes of the 2018 cohort over the three Waves of the survey and this chapter has shown that employment status and quality of work has remained reasonably consistent. However, there does appear to have been a stagnation in the impact that FSS is having on motivation and desire to return to work.
Contact
Email: Arfan.iqbal@gov.scot