Fair Start Scotland: evaluation report 4 - participant phone survey - year 3
Part of a series of reports on the evaluation of Fair Start Scotland (FSS) employability services. The report presents more detailed findings from a representative telephone survey of FSS participants and explores their experiences in the third year of delivery
2019 cohort: outcomes over time
The 2019 cohort joined FSS between January and December 2019 and was first surveyed in the Wave 2 survey and then followed up in this year's Wave 3 survey. At the Wave 2 survey a total of 607 of the 2019 cohort were interviewed, 205 of these were also interviewed at wave 3. This chapter explores the experiences of the 2019 cohort over the two survey Waves, including working status, quality of work and employment history. It then reports on the change in outcomes and motivation for this cohort.
Employment status of the 2019 cohort
As shown in Figure 32, there was no significant change in working status for the 2019 cohort between Wave 2 and Wave 3. Almost one-in-three (31 per cent) participants in the 2019 cohort were in work at Wave 2, with a further 3 per cent having worked in the last week. Over half (53 per cent) were claiming an out of work benefit, while 5 per cent were in education. These proportions were quite stable between Waves. At Wave 3, over one-third (34 per cent) of the 2019 cohort were either working for an employer or self-employed, with a further 1 per cent having worked at some point in the last week (35 per cent in some form of work). As before, the majority were not in work, with over half (51 per cent) claiming an out-of-work benefit, and 8 per cent in education at wave 3.
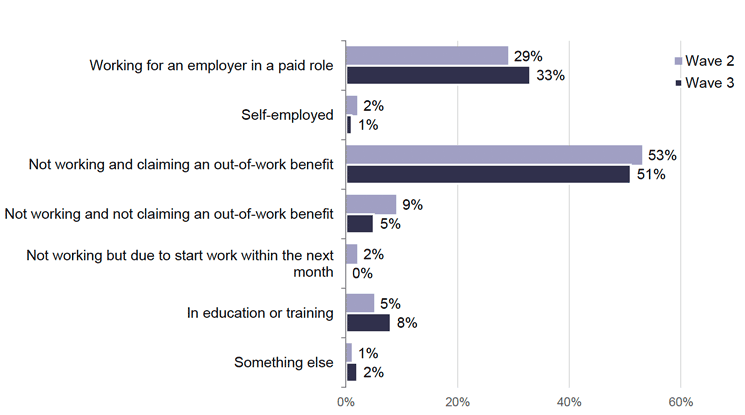
Source: IFF Research telephone survey of FSS customers. A1. Which of the following best describes what you are doing at the moment? Base: 2019 cohort Wave 2 (607) Wave 3 (205) A1A. In a typical week do you do any paid work, either as an employee or self-employed? Base: 2019 cohort, all other than employed and self-employed Wave 2 (427) Wave 3 (143)
Taking into account hours worked per week, around two-thirds (68 per cent) of the 2019 cohort were at the 'pre-employment' stage (working less than 16 hours per week), with a third (32 per cent) in-work (working 16 or more hours per week). At Wave 3, the following groups were more likely to be in-work:
- Female compared to male participants (45 per cent vs. 24 per cent)
- Those who had worked in the last 5 years compared to those who had not (42 per cent vs. 12 per cent)
- Those who had not left the FSS service early (41 per cent vs.11 per cent of early leavers)
As the 2019 cohort were asked about their employment situation at Wave 2 and Wave 3, we can look at the overall movement of working status for the cohort between Waves. Figure 33 shows the change in working status, using the FSS classification of pre-work and in-work (working less than 16 hours per week, or more than 16 hours per week). Around two-third (63 per cent) of the 2019 cohort were not working more than 16 hours per week at Wave 2 or Wave 3. However, almost one-in-five (18 per cent) were working more than 16 hours per week at both Waves. Encouragingly over one-in-eight (13 per cent) of the 2019 cohort moved into work between Wave 2 and Wave 3, while only one-in-twenty moved out of work (5 per cent).
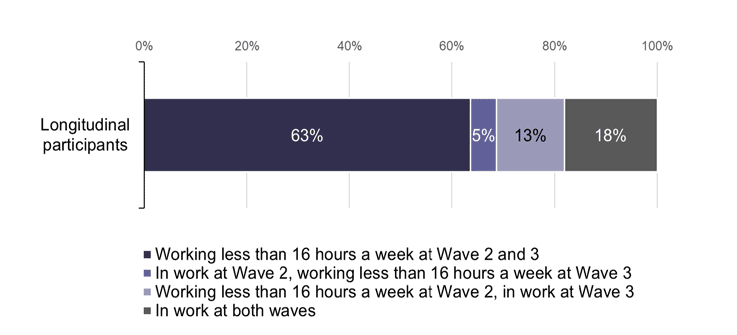
Source: IFF Research telephone survey of FSS customers. Combination of A1_W2/W3. Which of the following best describes what you are doing at the moment? And A3_W2/W3. How many hours per week do you usually work, or spend in education? Base: 2019 cohort (205)
Those aged 25-34 were more likely than average to have been in work at both Waves (31 per cent). Female participants were more likely than male participants to have moved into work during this period (20 per cent, vs. 10 per cent). Those who had worked in the last 5 years were also more likely to have moved into work in this period, than those who had not (17 per cent vs. 6 per cent). Those who left the service early were less likely to have moved into work between Waves (5 per cent vs. 17 per cent who had not) and to have been in work at both Waves (6 per cent, vs. 24 per cent who had not).
The 2019 cohort were asked what they had mostly been doing since they were surveyed the previous year. The majority of the cohort said that their situation had stayed the same (59 per cent). As shown in Figure 34, for those who were working less than 16 hours at Wave 2, most (59 per cent) were still not working, with a further 11 per cent saying they had been mostly out of paid employment or self-employment. However, some had moved into work: around one-in-ten (11 per cent) said they had mostly been in employment or self-employment, and a further 7 per cent were mostly in training or education.
For those who were working more than 16 hours at Wave 2, the majority were either in the same situation (56 per cent) or had mostly been in employment or self-employment (13 per cent). However, over one-in-seven (15 per cent) had been mostly out of paid employment or self-employment in the past year.
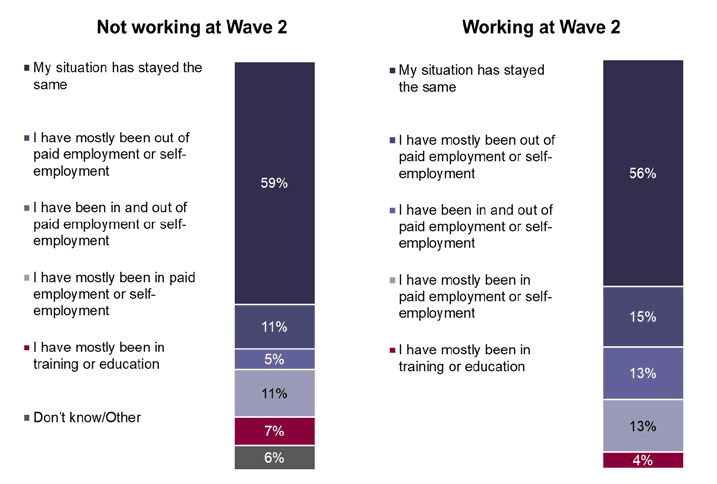
Source: IFF Research telephone survey of FSS customers. B1a_w3 Which of the following best describes what you have been doing since the last survey? Base: Pre-employment at Wave 2 (157) In employment at Wave 2 (48). Note working here refers to working more than 16 hours per week, and not working is less than 16 hours per week.
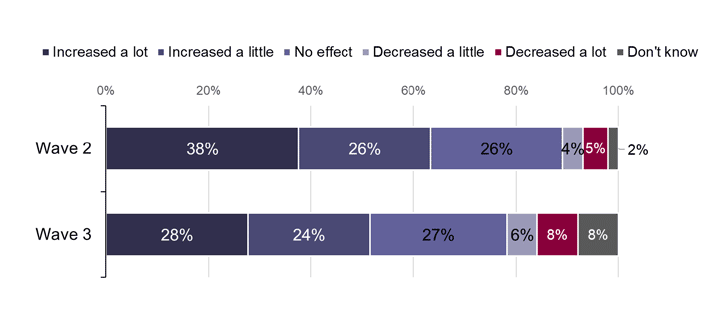
Participants were also asked how the COVID-19 pandemic had affected their employment situation. Overall, the impact of the pandemic did not change dramatically between Wave 2 and Wave 3. As shown in Figure 35 around three-quarters (73 per cent) of the 2019 cohort felt that their employment situation had not been impacted by the COVID-19 pandemic, which was similar to the proportion who said this at Wave 2 (77 per cent). The proportion who said they were on furlough at Wave 3 had decreased since Wave 2 (1 per cent, compared to 9 per cent). Other outcomes such as no longer being in work (10 per cent) and still working but fewer hours (3 per cent) were also not changed to a statistically significant degree.
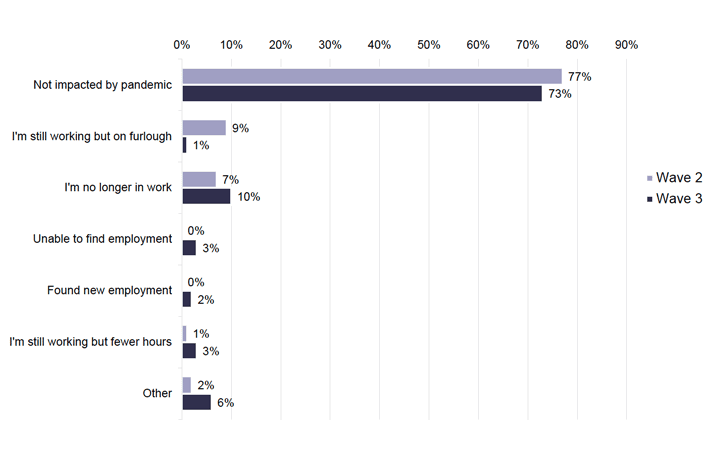
Source: IFF Research telephone survey of FSS customers A1c_W3. How has the COVID-19 pandemic impacted your employment situation? Base: All Wave 3 2019 cohort (205) Base All Wave 2 2019 cohort (607)
Quality of work
As well as working status, the Wave 2 and Wave 3 surveys covered working hours and other measures for quality of work. As shown in Figure 36 around two-thirds (64 per cent) of those who were working at Wave 3 in the 2019 cohort were working 30 or more hours per while 27 per cent were working 16 to 29 hours per week. These working hours had not changed significantly compared to Wave 2.
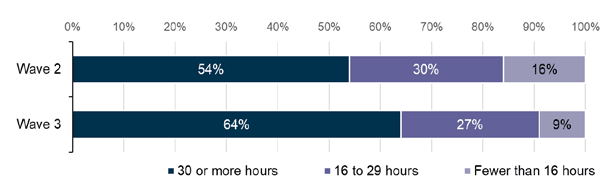
Source: IFF Research telephone survey of FSS customers A3_W3. How many hours per week do you usually work, or spend in education? Base: All working. Wave 2 2019 cohort (195) Wave 3 2019 cohort (64)
As shown in Figure 37 below, at Wave 3 the majority of the 2019 cohort that were in work, worked in either service intensive (33 per cent) or labour intensive (36 per cent) jobs. The proportion in high skill, middle skill and service intensive jobs did not show a statistically significant change between Wave 2 and Wave 3. However, participants were less likely to work in labour intensive jobs at Wave 3 than at Wave 2 (37 per cent vs. 52 per cent).
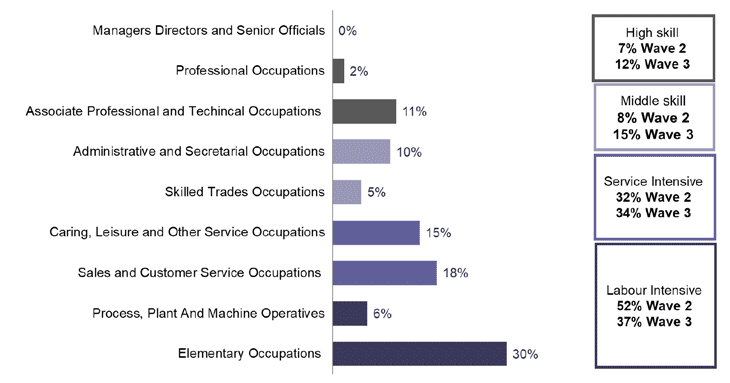
Source: IFF Research telephone survey of FSS customers. Taken from collating and coding answers from A5: What is/was your job title? And A6: What do/did you mainly do in your job? Base: 2019 cohort that were employed, self-employed or had worked in the last week Wave 2 (195) Wave 3 (64).
Participants were also asked about their hourly pay at both Wave 2 and Wave 3. As shown in Figure 38, the majority of the 2019 cohort who were in work at Wave 3 were paid between £9.30 and £15.00 an hour (53 per cent). This represents a statistically significant shift in the proportion of those who were paid at this level compared to Wave 2 (53 per cent, vs. 22 per cent). However, 15 per cent of the 2019 cohort reported being paid £8.71 per hour or less at Wave 3, which was below the minimum wage at the time.
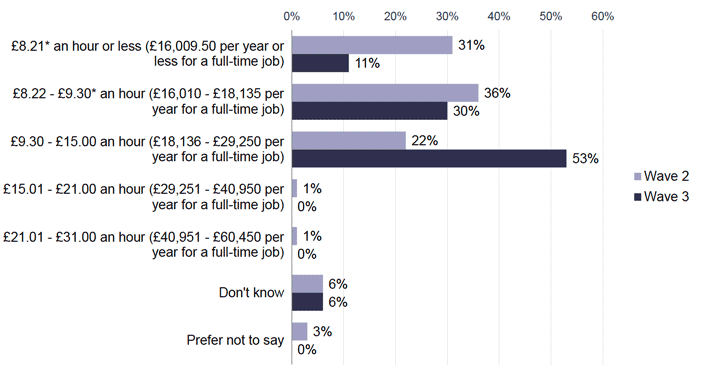
Source: IFF Research telephone survey of FSS customers, A7: Can you tell me your usual pay including overtime, bonuses, or tips (but before tax and other deductions are taken out)? Wave 2 Base: All 2019 cohort employed self-employed or had worked in the last week (195) Wave 3 Base: All 2019 cohort employed self-employed or had worked in the last week (64) *Note the low scale was £8.20 in the Wave 3 survey, and there was an additional scale from £8.21-£8.72 which has been combined here for comparison.
Participants were also asked about the types of contract they had at both Wave 2 and Wave 3. As shown in Figure 39, the majority of the 2019 cohort who were in work were on either permanent employment contracts (52 per cent) or temporary employment contracts (34 per cent). Although the differences appear fairly large in temporary employment contracts, due to the low base size, there were no statistically significant changes in employment contact types between Waves.
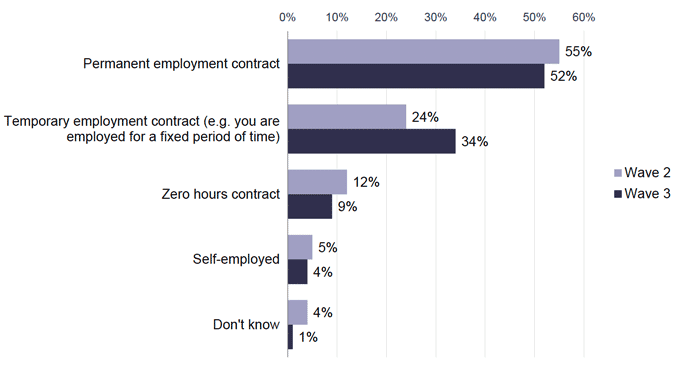
Source: IFF Research telephone survey of FSS customers, A8: Can you tell me what type of employment contract you have? Wave 2 Base: All 2019 cohort employed, self-employed or have worked in the last week (195). Wave 3 Base: All 2019 cohort employed, self-employed or have worked in the last week (64)
As shown in Figure 40, two-in-five (40 per cent) of the 2019 cohort that were working (had done some paid work in the week prior to the interview) had begun their job more than a year ago. There was a significant increase in the proportion who had started their job over a year ago at Wave 3 compared to Wave 2, suggesting those that find work were managing to sustain it.
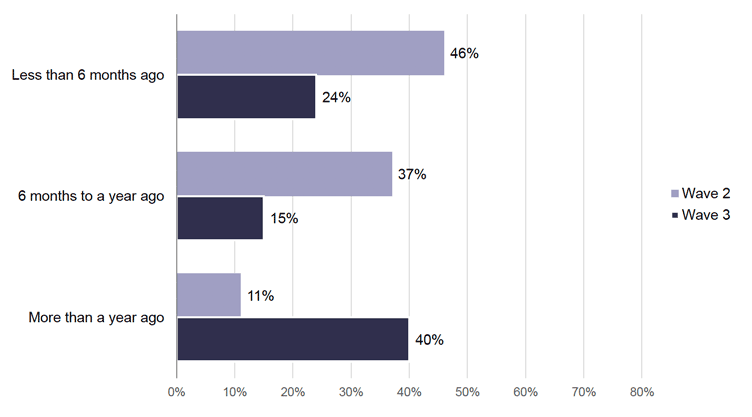
Source: IFF Research telephone survey of FSS customers A3B. When did you start working in your current or most recent job? Base: All working (employed, self-employed, or worked within the last week). Wave 2 2019 cohort (195) Wave 3 2019 cohort (68)
Outcomes and motivation to return to work
This chapter explores 2019 cohort participants' motivation to return to work and any impact that FSS has had on their motivation. It then describes the barriers and issues preventing participants from working and the extent to which FSS support has helped them to overcome these barriers, and then specifically how confident participants feel in carrying out job search activities. Findings in this chapter focus on outcomes for the 2019 cohort and how they have changed between Wave 2 and Wave 3.
Views on returning to work
Participants who were not in work (63 per cent of the 2019 cohort) were asked about their motivation to return to work. The questions were phrased as either 'returning to work' or 'returning to full time work' depending on whether they were not working at all or working less than 16 hours[17].
As shown in Figure 41 below, the proportion of those not working (or working fewer than 16 hours) who felt motivated to work 'to a great extent' was 75 per cent at Wave 2 but had reduced to 62 per cent by Wave 3.
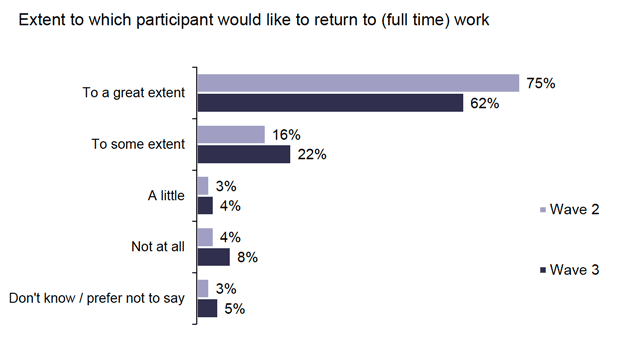
Source: IFF Research telephone survey of FSS customers, E2_W2. To what extent would you like to return to (full time) work in the future? Base: All who work fewer than 16 hours per week). Wave 2 (444) Wave 3 (147)
There were differences in motivation by participant sub-group at Wave 3, which were consistent with the patterns seen at Wave 2:
- Those aged 50 and over were less likely than average to want to return to work 'a great extent' (40 per cent).
- Male participants were more likely than female participants to want to return to work 'to a great extent' (70 per cent vs. 39 per cent). Those with a health condition which limited their day-to-day life a lot or a little were also less likely to want to return to work to a great extent (53 per cent).
Impact of FSS on motivation
As shown in Figure 42, at Wave 3, over half of the 2019 cohort (52 per cent) felt that the FSS service had increased their motivation. However, the perceived impact of FSS support on participants' motivation had reduced over time (52 per cent at Wave 3, compared to 63 per cent at Wave 2.) It should be noted though that one-in-three (33 per cent) of those asked about motivation at Wave 3 had left the service early. Early leavers were more likely to say that FSS had no effect on their motivation (40 per cent).
Source: IFF Research telephone survey of FSS customers, E8_W3. To what extent would you say your motivation to find (full time) work has increased or decreased from when you began receiving support from the Fair Start Scotland service? Base: All who work fewer than 16 hours per week). Wave 2 (444) Wave 3 (147)
At Wave 3, male participants were more likely than female participants to say that FSS had increased their motivation to find work (59 per cent vs. 37 per cent). Those over 50 years of age were less likely than average to say their motivation had increased (33 per cent).
Barriers to work
Participants were asked about barriers preventing them from working at both Wave 2 and Wave 3. The barriers reported by the 2019 cohort were similar at Wave 2 and Wave 3. As shown in Figure 43 at Wave 3 around one-in-five (21 per cent) said not having the right qualifications, skills or experience was the main barrier preventing them from working, the same proportion as at Wave 2. At Wave 3, around one-in-seven said that their mental (14 per cent) or physical (13 per cent) health condition made it difficult to carry out work. Just over one-in-ten said there were not enough suitable jobs in their local area (11 per cent), or that they did not feel confident about applying for jobs (11 per cent).
At Wave 3, a smaller proportion reported that there were not enough or not many suitable jobs in their local area compared to Wave 2 (11 per cent vs. 18 per cent). Additionally, just under one-in-ten (8 per cent) said that the COVID-19 pandemic made it difficult to find work, which had not been present at Wave 2.[18]
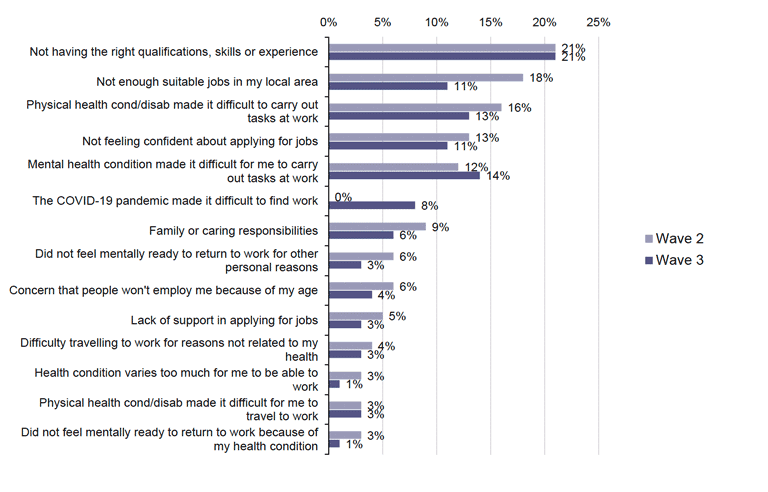
Source: IFF Research telephone survey of FSS customers F1A_w3. What would you say were the main issues or barriers preventing you from working? Base: All 2019 cohort respondents Wave 2 (607) Wave 3 (205)
Some sub-groups were more likely than others to report particular barriers at Wave 3:
- Female participants were more likely than male participants to say that they did not feel confident applying for jobs (19 per cent vs. 6 per cent).
- Those aged 50 and over were more likely than average to say there were not enough suitable jobs (14 per cent), or that people would not employ them due to their age (13 per cent).
- Participants with a health condition that limited their day-to-day activities were more likely to say that they had a mental (28 per cent) or physical (24 per cent) condition which made it difficult for them to carry out tasks at work.
The impact of FSS support on overcoming barriers to work
Participants were asked to what extent they thought the support received from FSS had helped them to overcome each of their reported barriers, on a scale from one, 'had no impact' to five, 'helped a lot'. Due to the low base size for the 2019 cohort at these questions, only two of the barriers are reported on here.[19]
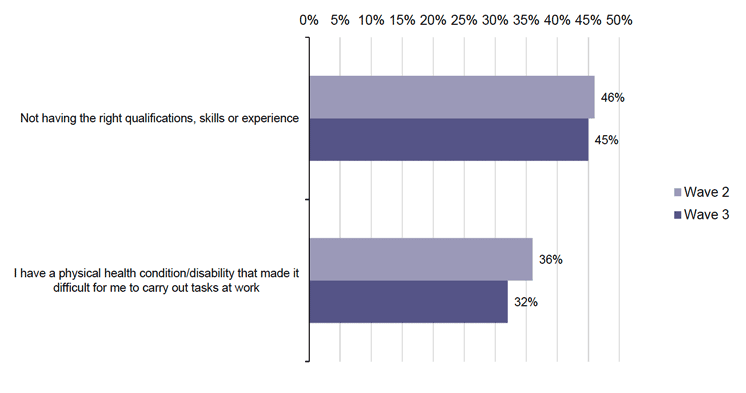
The proportion who rated the impact of the support 4 or 5 are shown in
Figure 44, for barriers where 30 or more answered, for those who said 'not having the right qualifications, skills or experience' around a third (32 per cent) said that the support they received helped to overcome this barrier, while 30 per cent said the support had no impact.
For those who said 'I have a physical health condition/disability that made it difficult for me to carry out tasks at work' almost half (45 per cent) said that the support helped them to overcome this barrier, while two-fifths (39 per cent) said it did not.
The impact of support on both barriers had not changed significantly since Wave 2.
Participants were also asked at Wave 2 and Wave 3 about which parts of the support they felt made the most difference to them. The types of support mentioned at Wave 3 were broadly the same as at Wave 2, although some support types were mentioned more or less frequently at the different Waves, as shown in Figure 45.
At Wave 2, participants were most likely to mention the one to one nature of the support (31 per cent), while only one-in-five (19 per cent) mentioned this at Wave 3. This may be due to the changing nature of delivery of support due to the pandemic. A similar proportion mentioned help with CVs and application forms (22 per cent at Wave 2 and 23 per cent at Wave 3).
Confidence building exercises were more likely to be cited as making the most difference at Wave 3 compared to Wave 2 (8 per cent at Wave 2 compared to 18 per cent at Wave 3), as was having regular contact or a consistent adviser (6 per cent at Wave 2 compared to 19 per cent at Wave 3).
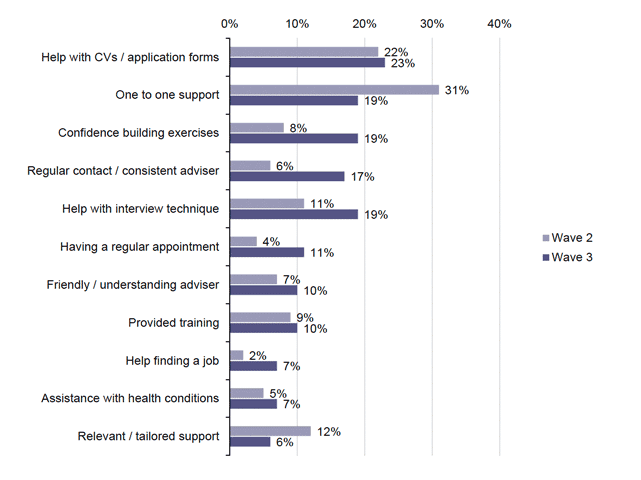
Source: IFF Research telephone survey of FSS customers. F1A_w3. What would you say were the main issues or barriers preventing you from working? Base: All 2019 cohort who thought the support was helpful Wave 2 (301) Wave 3 (97)
Job search skills
At both Wave 2 and Wave 3, participants in the 2019 cohort were asked to rate how confident they felt about completing nine different job-search related activities on a scale of 1 to 5, known as the Job Search Self Efficacy (JSSE) Index . Findings are reported in Figure 46.
There was no significant change in the overall scores on the JSSE for the 2019 cohort between Wave 2 and 3. The average score on the JSSE (1-6) at Wave 2 was 3.9, while their average score at Wave 3 was 3.8.
Although most of the measures show that there was a decrease in between wave 2 and wave 3 none of the skills decreased significantly statistically.
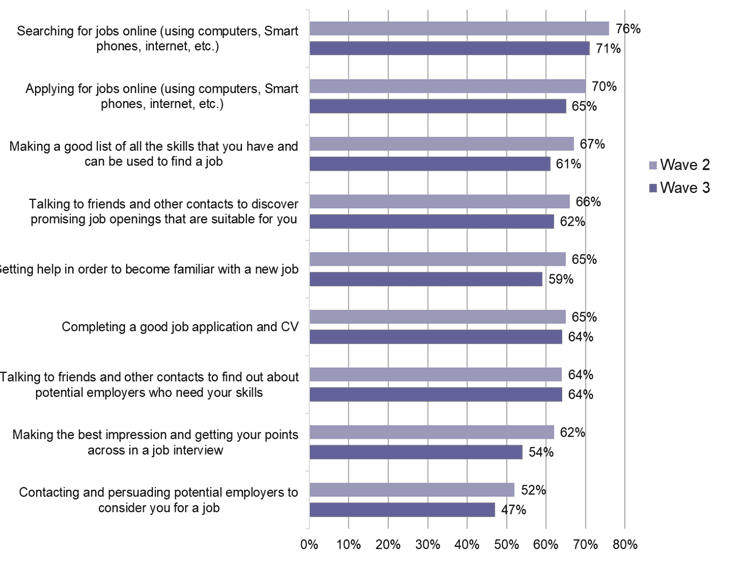
Source: IFF Research telephone survey of FSS customers. F2-W3. How confident do you feel about doing the following things successfully?? Base: All 2019 cohort Wave 2 (607) Wave 3 (205)
Contact
Email: Arfan.iqbal@gov.scot