Fair Start Scotland: evaluation report 4 - participant phone survey - year 3
Part of a series of reports on the evaluation of Fair Start Scotland (FSS) employability services. The report presents more detailed findings from a representative telephone survey of FSS participants and explores their experiences in the third year of delivery
Service experiences and changes over time
This chapter begins by examining why participants signed up for support from Fair Start Scotland and how they found the sign up process. It then looks in detail at the different types of pre-employment and in-work support participants were offered and took up, and how useful participants found this support. Lastly the chapter describes participants overall views of the support they received particularly during COVID-19 restrictions, and participants reasons for ending their engagement with Fair Start Scotland.
The chapter focuses on experiences of participants from the 2020 cohort. It also includes analysis of how these participants' experiences compared to those of the 2018 cohort the year they first joined the service (Wave 1 survey), and the 2019 cohort the year they first joined the service (Wave 2 survey), in order to provide a comparison of experiences at the same point in their FSS journey.
Reasons for signing up and experiences of the sign-up process
Reasons for signing up for support
Participants who joined the service after July 2020 were asked whether they were aware that FSS was voluntary and their reasons for and experiences of signing up. Nine in ten (90 per cent) of these participants knew the service was voluntary, five per cent thought it was mandatory and five per cent did not know. In total this meant that 17 participants believed the service was mandatory. For these participants, the most common reasons for believing this was that their Jobcentre Plus Work Coach or advisor told them it was mandatory, they assumed it was mandatory based on previous benefits experienced, or that they assumed it was mandatory for other reasons.
Excluding those who thought the service was mandatory, most participants joined FSS because they liked the idea of receiving additional help and support (53 per cent). Around a quarter joined because they really wanted a job (26 per cent) and a fifth joined because they felt it would help them get back to work (22 per cent). Figure 9 shows the full list of reasons why 2020 cohort participants joined the FSS service.
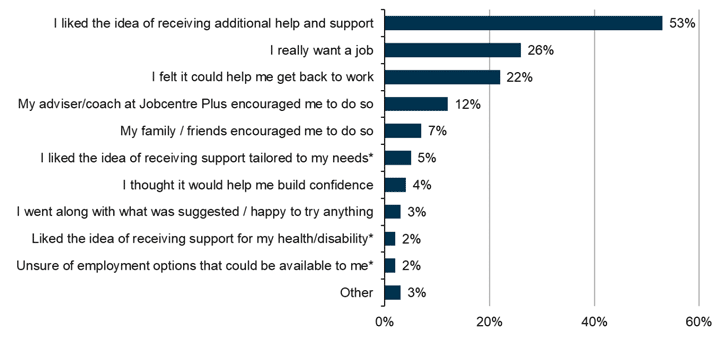
Source: C4: Why did you sign up for support? Base: All who started receiving support after July 2020 and thought the service was voluntary or were unsure (316)
*Full text of response options:
I liked the idea of receiving help and support that was tailored to my individual needs
I liked the idea of receiving support specific to my health condition / disability
I was unsure of employment options that could be available to me, so I wanted to get some support
There was some variation across different demographic groups in why participants signed up:
- Male participants were more likely than female participants to have been encouraged to sign up by their Jobcentre Plus adviser (16 per cent, compared to 7 per cent).
- Those aged between 25 and 34 were more likely to have been encouraged to join the service by their family and friends than other age groups (14 per cent, compared to 7 per cent on average).
- Although only a small proportion, some participants with a health condition joined the service to help build their confidence; this was not a factor for any participants who did not have a health condition (5 per cent of those who were limited by their health condition and 8 per cent of those who had a health condition that was not limiting, compared to 0 per cent of those with no health condition).
- The idea of receiving additional support was much more likely to be a factor for white participants than minority ethnic participants (57 per cent, compared to 37 per cent).
Experiences of signing up for support
Experiences of the sign up process were generally very positive. Three quarters of 2020 cohort participants (76%) rated the process as one out of five and a further 13 per cent gave a rating of two out of five, where one meant 'very easy' and five meant 'very difficult'.
As shown in Figure 10 below, nearly a third of these participants (30 per cent) found it easy because the process was simple, while the same proportion had help from someone else to sign up.
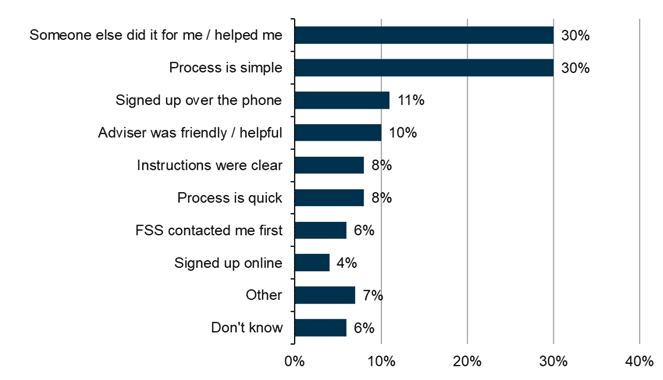
Source: C6: Why did you find it easy to sign up? Base: All 2020 cohort who found it easy to sign up (297)
There were however two groups who were less likely to find the sign up process easy. Only 77 per cent of minority ethnic participants found the process easy compared to 92 per cent of white participants, and 85 per cent of those with a limiting health condition found it easy compared to the average of 89 per cent.
Only two per cent of all 2020 cohort participants described the process as difficult while six per cent said they did not find the process either easy or difficult (gave a score of three on a scale of one to five).
Differences in sign up experiences between the 2020 cohort, the 2019 cohort at Wave 2 and the 2018 cohort at Wave 1
The findings described above demonstrating the high proportion of participants who were aware that the FSS service was voluntary, and who found the sign up process easy were consistent with FSS cohorts from previous Waves.
Participants' reasons for signing up to the FSS service however varied between cohorts.[4] As shown in Figure 11, the 2018 cohort at Wave 1 were more likely to have signed up to FSS for the following reasons:
- they felt that the service could help them get back to work (45 per cent of the 2018 cohort at Wave 1, compared to 22 per cent of the 2020 cohort,
- they liked the idea of receiving support tailored to their needs (14 per cent of the 2018 cohort at Wave 1 compared to 5 per cent of the 2020 cohort)
- they liked the idea of receiving support specific to their health condition/disability (7 per cent of the 2018 cohort at Wave 1 compared to 2 per cent of the 2020 cohort).
Conversely, the 2020 cohort were more likely to have signed up to FSS than the 2018 cohort at Wave 1 for the following reasons:
- they liked the idea of receiving additional help and support (53 per cent of the 2020 cohort compared to 40 per cent of the 2018 cohort at Wave 1),
- their Jobcentre Plus adviser/coach encouraged them to (12 per cent of the 2020 cohort compared to 7 per cent of the 2018 cohort at Wave 1)
- their family encouraged them to (7 per cent of the 2020 cohort compared to 1 per cent of the 2018 cohort at Wave 1).
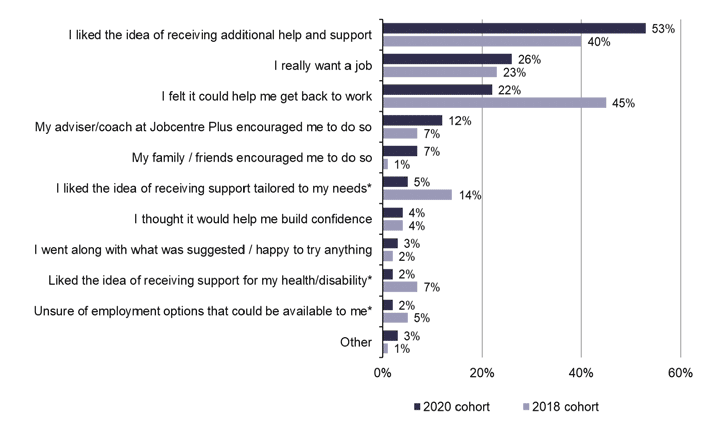
Source: C4: Why did you sign up for support? Base: 2020 cohort: All who started receiving support after July 2020 and thought the service was voluntary or were unsure (316) 2018 cohort: All who joined the service after July 2018 and understood the service was voluntary or were unsure (506) *Full text of response options: I liked the idea of receiving help and support that was tailored to my individual needs; I liked the idea of receiving support specific to my health condition / disability; I was unsure of employment options that could be available to me so I wanted to get some support
The proportion of participants who found the sign up process easy remained consistently high between the 2018 cohort and the 2020 cohort.
Pre-employment support
Turning now to the types of support that participants received, all providers delivering employment support for the FSS service are required to provide participants who are not in full time work with a minimum level of support, including specific elements detailed in the FSS Operational Guidance. These elements can be summarised as:
- One to one support from a dedicated key worker who understands the participant's disability where they have one, and their barriers to employment.
- The development of a Participant Employment Action Plan, to be delivered in the first eight weeks. This is a person-centred plan which details how the support will be delivered and gives information on the participants' skills, attributes, aspirations and needs.
- The provision of specialist support, that meets the participant's specific needs.
- Presentations by employers giving advice about working in and applying for jobs in different sectors.
- The teaching of intensive job search skills, job application support, and skills development.
- Help with personal development addressing the participant's self-esteem, confidence and perceived barriers to work.
- Support with a mentor.
- Vocational or employability skills training appropriate to the participant's aspirations.
- Work experience or placement opportunities and volunteer opportunities.
- Self-employment support for those interested.
For participants with higher levels of need, providers are required to give further help. This includes additional elements such as specialist support for specific physical or mental health conditions, or for those recovering from drug / alcohol / substance misuse and support addressing barriers due to records of previous convictions and explaining models such as the Supported Employment Model for Disabled People. Figure 12 shows the different types of support that participants from the 2020 cohort reported that they were offered and how many went on to take up that support.
Of all the 2020 cohort, 32 per cent reported that they had a mental health condition and nearly half of those participants (47 per cent) said they were offered specialist support with a mental health condition through the FSS service. By contrast, 15 per cent of 2020 participants had a physical health condition or disability and of those, less than a quarter (24 per cent) recalled being offered specialist support for a physical health condition through the FSS service.
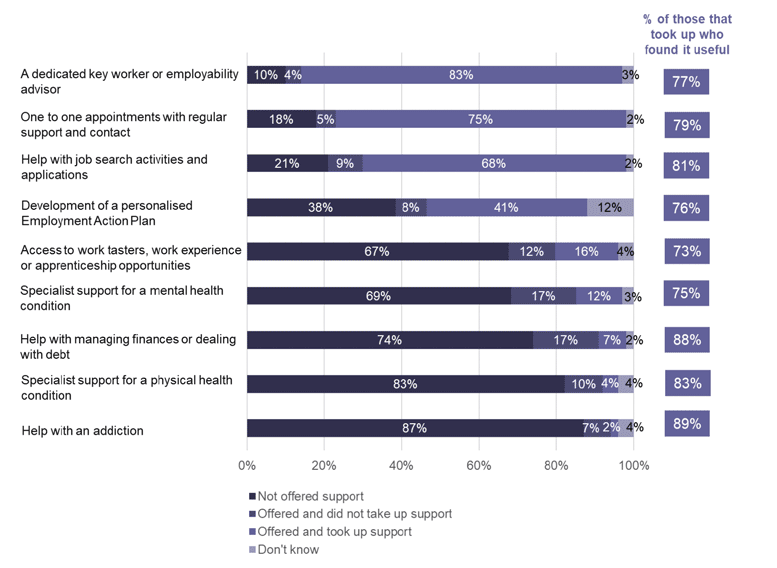
Source: D5d: Were you offered the following support to help you remain move into work as part of the Fair Start Scotland service? D5e: Did you take up this support? Base: All 2020 cohort respondents (644). D6: On a scale of 1 extremely useful to 5 not at all useful, how useful would you say that each of the types of support your received were to you? Base: All who used the support type: one to one appointment (484), key worker (533), help with job search activities (441), Employment Action Plan (264), work tasters etc. (104), specialist support with mental health (74), specialist support with physical health (23), specialist support with an addiction (13), help managing finances (45)
The dark purple bars in figure 12 show the proportion of 2020 cohort that did not recall being offered each support type, for example 21 per cent reported that they were not offered help with job search activities and applications.
Looking just at participants who were offered each type of support, the most common types of support that participants took up tended to be the more generic, widely relevant activities:
- A dedicated key worker or employability advisor (95 per cent of those offered).
- One to one appointments with regular support and contact (93 per cent of those offered).
- Help with job search activities and applications (87 per cent of those offered).
- Development of a personalised Employment Action Plan (82 per cent of those offered).
Smaller proportions reported being offered access to work tasters, work experience or apprenticeships opportunities (28 per cent), specialist support with a mental health (29 per cent) or physical health condition (14 per cent), help with managing finances or dealing with debt (24 per cent), or help with an addiction (9 per cent). This is likely to be because these forms of support would only be relevant to certain participants. Relatively small proportions of participants who were offered these forms of support went on to take them up. One in four took up specialist support for a mental health condition (40 per cent), and between 20 and 30 per cent took up help with a physical health condition (27 per cent), help managing finances and dealing with debt (29 per cent) and help with an addiction.
There was some variation by participant group, in terms of the support services they reported / recalled having been offered:
- Younger participants were more likely to recall being offered access to access to work tasters, work experience or apprenticeship opportunities (39 per cent compared to 29 per cent on average). By contrast, older participants aged 50 and above were less likely to recall being offered help with job search activities and applications (69 per cent compared to 78 per cent on average) or help with a mental health condition (19 per cent vs 29 per cent on average).
- White participants were more likely than minority ethnic participants to recall being offered specialist support for a mental health condition (32 per cent compared to 19 per cent), or a physical health condition (16 per cent compared to 6 per cent).
- Participants from Lot 4, Forth Valley were more likely than others to recall being offered various types of support including access to work tasters, work experience or apprenticeship opportunities (43 per cent compared to 29 per cent on average), help for a physical health condition (24 per cent compared to 14 per cent on average) and help with managing finances or dealing with debt (44 per cent compared to 24 per cent on average).
There were also differences in the level of take up by participant groups. As might be expected, younger participants, aged between 16-24 years were slightly more likely to take up the offer of access to work tasters, work experience and apprenticeship opportunities (72 per cent compared to 55 per cent on average).
Participants who were further from the labour market tended to be more likely to take up the offer of developing a personalised Employment Action Plan than others. For example, 94 per cent of those who had not worked in the five years prior to joining the service, and 97 per cent of those with no formal qualifications took up this offer (compared to 82 per cent on average). Whereas those with degree level qualifications or higher were less likely to take this up (73 per cent, compared to 82 per cent on average).
Those who had been out of work for five years prior to joining the service were also more likely to take up the offer of work tasters, work experience or apprenticeship opportunities (68 per cent, compared to 55 per cent on average).
Minority ethnic participants were considerably more likely to take up the offer of access to work tasters, work experience or apprenticeship opportunities than white participants (71 per cent, compared to 50 per cent). While take up of one to one appointments with regular support was slightly higher among white participants (94 per cent take up among white participants compared to 89 per cent take up among minority ethnic participants).
There were also some variations in take up of support by different Lots. Lot 5, East, saw a slightly lower take up of support with job search activities and applications (81 per cent compared to 87 per cent on average) but a higher take up of specialist support for a mental health condition (56 per cent compared to 40 per cent on average). While take up of one to one appointments was slightly lower in Lot 7, North East (85 per cent compared to 93 per cent on average), and take up of a dedicated key worker/employability adviser was lower in Lot 6, South West (83 per cent compared to 95 per cent on average).
The column on the far right of figure 12 shows the proportion of participants who found each type of support useful, out of those that took it up. This demonstrates that at least three quarters of participants found each type of support useful.
Again there was significant variation between demographic groups. White participants were more likely to find several types of support useful compared to minority ethnic participants, including a dedicated key worker/employability adviser (80 per cent compared to 65 per cent), one to one appointments with regular support and contact (81 per cent compared to 71 per cent) and access to work tasters, work experience or apprenticeship opportunities (81 per cent compared to 55 per cent).
Participants who had a limiting health condition were less likely to find help with job search activities and applications useful compared to participants on average (76 per cent compared to 81 per cent on average). Female participants were more likely than male participants to find access to work tasters, work experience or apprenticeship opportunities useful (87 per cent compared to 65 per cent)
Meeting with a key worker or employability advisor
Participants were also asked how often they met with their key worker or employability adviser. As shown in Figure 13, half of participants met with their key worker about once a week and over a quarter (27 per cent) met once a fortnight.
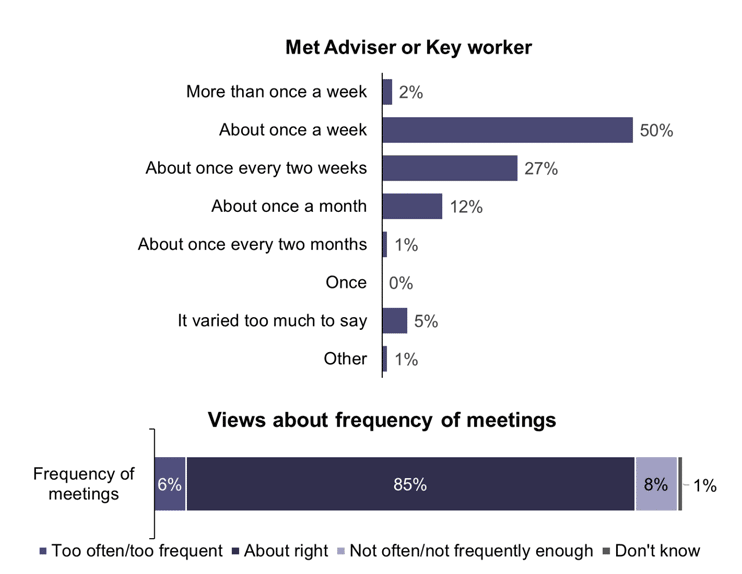
Source: D7f: How often did you meet with your Adviser/ Key Worker? D8: Would you say that the frequency of your meetings was…? Base: All who met with a key worker (534)
Four per cent of all 2020 participants had not met with their key worker or advisor despite being offered one. While this only represented 29 participants it should be noted that 41 per cent of these participants said that the COVID-19 pandemic had prevented them meeting with their adviser and this was the most common reason given by this group.
Most (85 per cent) of those who met with their key worker said the frequency was about right. There were some differences by sub-group:
- Participants aged 25-34 years old were more likely to think that their meetings with their adviser were too frequent (11 per cent compared to 6 per cent on average).
- Minority ethnic participants were less likely than white participants to be happy with the frequency of their meetings, with 16 per cent finding them too frequent, and 14 per cent finding them to not be frequent enough (compared to 3 per cent and 6 per cent of white participants respectively).
- Nearly two fifths of participants (18 per cent) who left the service early said that the meetings with their advisers were too frequent compared to 5 per cent of those who did not.
Differences between pre-employment support received by the 2020 cohort, the 2019 cohort at Wave 2 and the 2018 cohort at Wave 1
Participants' take up of the different types of pre-employment support remained broadly consistent across the 2020 cohort at Wave 3, the 2019 cohort at Wave 2 and the 2018 cohort at Wave 1.[5]
There was however one exception to this in that take up of the development of a personalised Employment Action Plan reduced slightly among the most recent cohort. Among 2020 cohort participants, 82 per cent took up this type of support, compared to 89 per cent of the 2018 cohort at Wave 1 and the same proportion (89 per cent) of the 2019 cohort at Wave 2.
Participants' views about the usefulness of the support they received also remained consistent across the three Waves, except that 2020 cohort participants were more likely to find help with job search activities and applications useful than the 2019 cohort (81 per cent, compared to 74 per cent). The proportion that found it useful among the 2018 cohort was in line with the 2020 cohort (80 per cent of the 2018 cohort found it useful).
The frequency with which participants met with their key workers has reduced slightly in the last two years. Around six in ten participants from the 2018 cohort (65 per cent) and 2019 cohort (63 per cent) met with their key workers once a week, while among the 2020 cohort this dropped to five in ten (50 per cent). However, participants' satisfaction with the frequency of their meetings has remained consistent across all Waves.
In-work support
Participants who move into employment for 16 hours a week or more[6] are entitled to up to 12 months in-work support to help them sustain that employment. The aim of this is to increase job retention and progression in terms of skills and / or income. The in-work support provided must include the following elements (as above, these have been summarised from the FSS Operations Guidance):
- Continued weekly contact with a dedicated key worker, reducing over time,
- An In-work Support Action Plan detailing a timeline for workplace reviews with the employer and setting out future objectives,
- Support provided to the participant at their work induction,
- Financial guidance to the individual if necessary,
- Ensuring the participant is aware of changes to their benefit entitlement and that they are receiving all the possible in-work benefits,
- Support at other stages of work such as during training if necessary,
- Giving information about travel options to and from work considering the participants' needs,
- An exit plan for leaving the FSS service.
For participants with higher levels of need, providers should also provide Job and Task Analysis and deliver tailored support for the participant's needs in accordance with their Job Analysis.
Of the 2020 cohort who were working at least 16 hours per week, 43 per cent recalled being offered any type of in-work support. This proportion has decreased over previous Waves, from 67 per cent of the 2018 cohort at Wave 1, and 57 per cent of the 2019 cohort at Wave 2.
Figure 14 shows the proportion of the 2020 cohort who were offered and took up the various forms of in-work support, and how useful they found it. This shows that participants were most likely to take up support from a dedicated key worker (29 per cent of all participants and 76 per cent of those offered), one to one appointments with regular support and contact (25 per cent of all participants and 73 per cent of those offered), and monthly workplace reviews with their employer[7] (10 per cent of all participants and 69 per cent of those offered).
Figure 14 also shows that, while the proportion of participants who were offered and took up in-work support is generally lower than pre-employment support, participants who used in-work support were even more likely to find it useful. Satisfaction with the usefulness of support ranged from 77 per cent for the development of an In-work Support Action Plan to 100 per cent for financial guidance.[8]
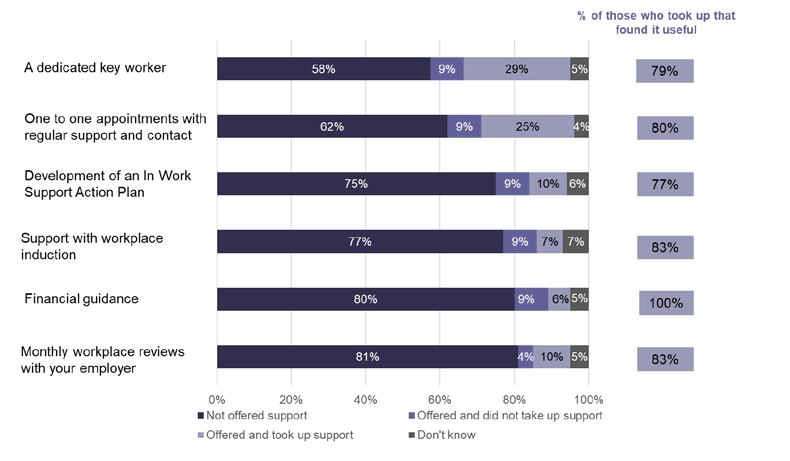
Source: D11h: Were you offered the following in-work support to help you remain in work as part of the Fair Start Scotland service? Base: All 2019 cohort who were in work 16 or more hours a week (214) D11i: Did you take up this support? Base: All 2019 cohort who were in work 16 or more hours a week (214). D11j: On a scale of 1 extremely useful to 5 not at all useful, how useful would you say that each of the types of support your received were to you? Base: All 2019 cohort who used the support type: key worker (63), one to one appointment (54), workplace inductions (15), In Work Support Action Plan (22), financial guidance (13), monthly reviews (22)
Overall views of support
The 2020 cohort were also asked about various other aspects of the support they received. The Fair Start Scotland service is built upon the Scottish Government's key values for public services[9]: Dignity and respect; Fairness and equality; Continuous improvement. To gather participants' views about the support they received, the survey asks them to give their agreement with a list of statements based on these key values.
As shown in Figure 15, participants were very positive about the support received from FSS. Between 82 and 95 per cent of participants agreed that the service they received aligned with each of these values, and they were most likely to agree that they were treated with dignity and respect (95 per cent).
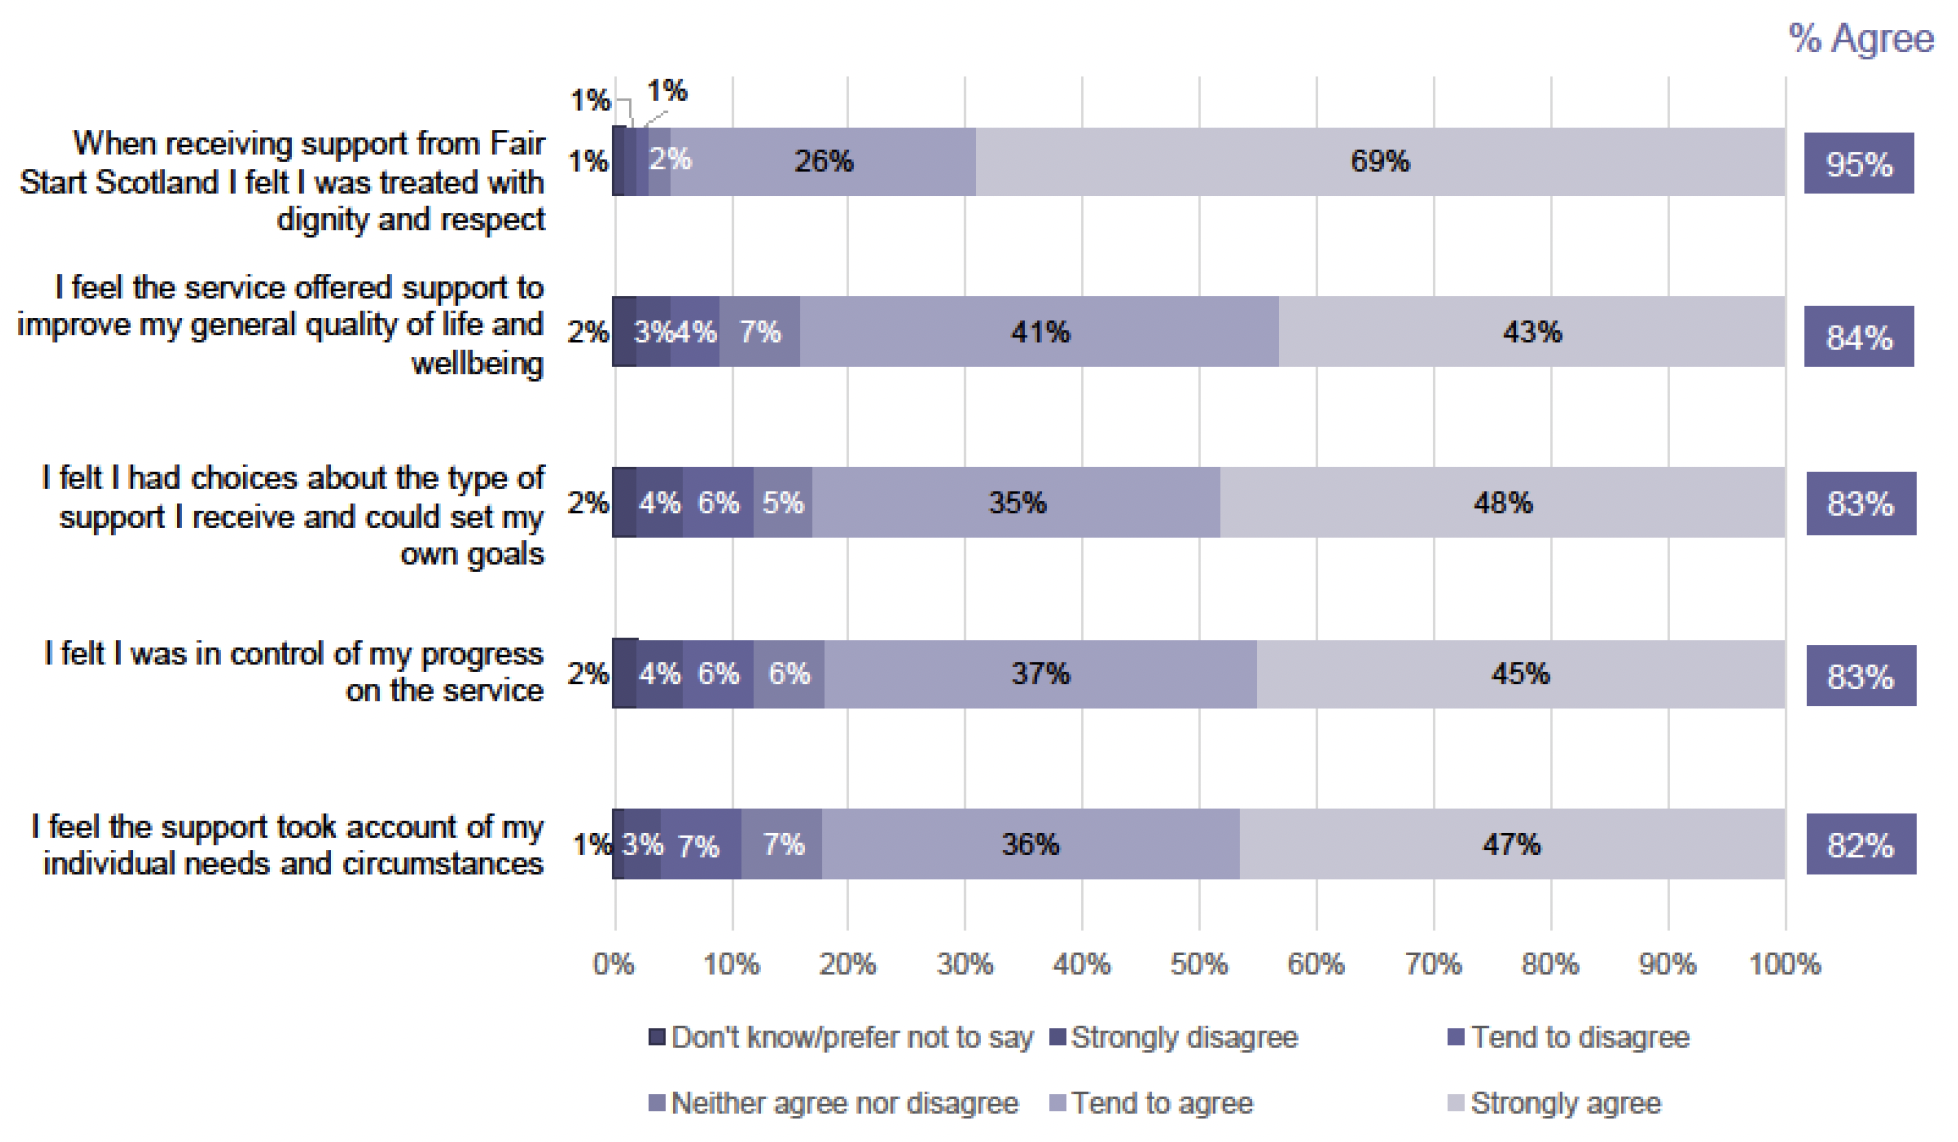
Source: D13: To what extent do you agree with the following statements about the support you have received. Base: All 2020 cohort (644)
There were a few differences in attitudes about the service by gender and ethnicity. White participants were more likely than minority ethnic participants to feel positively about several aspects of the support:
- that the support took account of their individual needs and circumstances (85 per cent, compared to 74 per cent),
- that they were in control of their progress on the service (86 per cent, compared to 72 per cent)
- that they had choices about the type of support they received and could set their own goals (86 per cent, compared to 74 per cent)
Male participants were more likely than female participants to feel the service offered them support to improve their general quality of life and wellbeing (86 per cent, compared to 80 per cent).
Participants were also asked an open text question about whether there was any other type of support that they wished they could have received from FSS to help them move closer to work. Nearly four fifths of participants felt that there was no other type of support they would have liked to receive from FSS (78 per cent). Five per cent said they would have liked to have been offered training courses. Other common responses given by smaller proportions of participants included more personalised help, support and feedback, help with getting a job placement or work experience, financial advice or support, more contact with employers, for FSS to be easier to get in contact with or to have a dedicated contact, face to face meetings and one-to-one support and to have more consideration of health issues when offering support.
Again, views here varied by ethnicity. Minority ethnic participants were more likely than white participants to have wanted more help, in particular to be offered training courses (10 per cent, compared to 5 per cent on average), help getting a placement or gaining work experience (7 per cent, compared to 3 per cent on average) and more contact with employers (3 per cent, compared to 1 per cent on average).
Participants aged 35-49 years, and those with a degree level qualification or above were slightly more likely to have wanted help with getting a placement or gaining work experience (5 per cent compared to 3 per cent on average).
Differences in overall views about support between the 2020 cohort, the 2019 cohort at Wave 2 and the 2018 cohort at Wave 1
Satisfaction with the FSS service has remained consistently high throughout Waves 1, 2 and 3 and was slightly higher among the most recent cohort in the following areas:
- Being treated with dignity and respect (agreement rose from 92 per cent among the 2018 cohort at Wave 1, to 95 per cent among the 2020 cohort at Wave 3)
- Being offered support to improve general quality of life and wellbeing (agreement rose from 78 per cent among the 2018 cohort at Wave 1, to 84 per cent among the 2020 cohort at Wave 3)
- Feeling in control of progress on the service (agreement rose from 79 per cent among the 2018 cohort at Wave 1, to 83 per cent among the 2020 cohort at Wave 3)
The proportion who agreed with the statements has in fact increased every year across all of the five attitudinal statements, suggesting satisfaction in all areas has increased, however only those stated above had increased enough to be statistically significant.
Accessing support during the COVID-19 pandemic
As the 2020 cohort had joined the service in the year that the COVID-19 pandemic impacted the UK, these participants were asked about how they accessed support during periods when government guidelines restricted their ability to receive FSS support in person.
Figure 16 shows that during these periods nine out of ten participants (90 per cent) accessed support by phone and over half (55 per cent) accessed support online through email, messaging or video services. A minority of participants (6 per cent) said that they did not access any support during these periods.
Positively, two thirds of participants did not experience any difficulty accessing support during this time. Nearly a fifth (17 per cent) however said that they did not feel comfortable using technology/video conferencing, while 12 per cent lacked internet access and the same proportion did not have access to a device or the technology they needed.
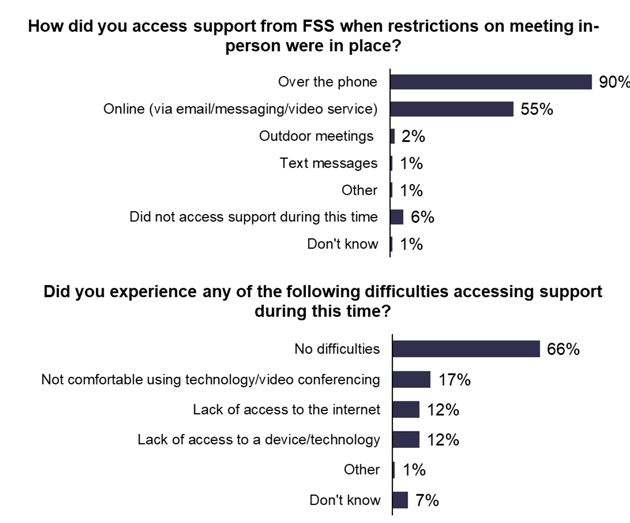
Source: D4B: How have you accessed / did you access support from Fair Start Scotland during the time when restrictions on meetings in-person were in place due to the COVID-19 pandemic? Base: All 2020 cohort (644) D4c: Did you experience any of the following difficulties accessing support during this time? Base: All except those who did not access support during this time (618)
There were a few differences in how participants accessed support by Lot. Participants in Lot 1, Glasgow were more likely to have missed out on support during the restrictions (12 per cent, compared to 6 per cent on average), while those in Lot 4, Forth Valley were more likely to have accessed support online (74 per cent, compared to 55 per cent on average).
Participants who had limiting health conditions were more likely to have had difficulties accessing a device or technology to engage with support online compared to those with a non-limiting health condition or no health condition (17 per cent, compared to 8 per cent and 9 per cent respectively). They were also more likely to have felt uncomfortable using technology or video conferencing to access support than those with no health condition (24 per cent, compared to 10 per cent).
Reasons for ending engagement with FSS
Figure 17 below shows the proportion of 2020 cohort participants who were still receiving support and those who were not, including a breakdown of those who were registered on FSS database as having left the support early. This shows that only 11 per cent of participants were recorded as leaving the service early, and the majority of these (9 per cent) were not working more than 16 hours per week at the time of the survey.
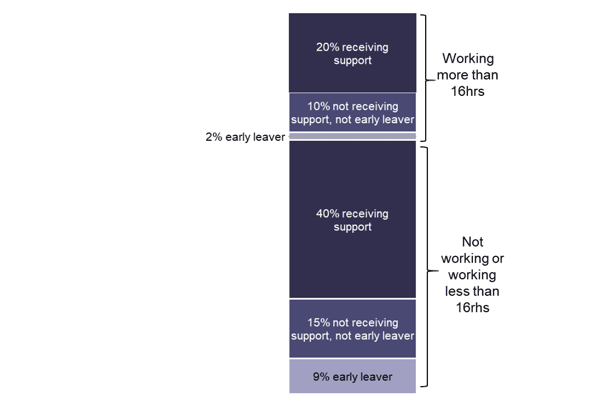
Source: D1: Are you currently receiving support from Fair Start Scotland? and management information data on early leavers collected by FSS Base: All participants for whom early leaver data was available (631)
All 2020 cohort participants who had stopped receiving support from FSS were asked about why they left the service. As shown in Figure 18, the most common reasons for participants having ceased engagement with the service were that they found work (29 per cent), the programme of support came to an end (15 per cent) or that the service was not relevant to their needs (14 per cent).
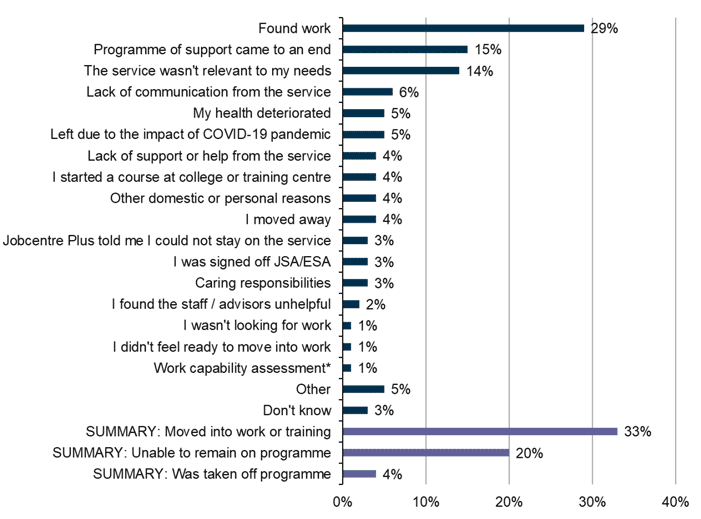
Source: D4: Why did you leave the support service? Base: All 2020 cohort no longer receiving support (224)
*Full response option wording: I had a Work Capability Assessment and was put into the Support Group / found not to be fit for work
Figure 18 represents responses from both participants who were recorded on FSS's database as having left the service early and those who were recorded as having completed the support program. There were no significant differences between the reasons given for leaving between these two groups except that those who were recorded as 'early leavers' were less likely to say they left the service because they found work, than those who were recorded as completing the program (17 per cent, compared to 35 per cent).
Participants with no health conditions were more likely to have left the programme because they moved into work or training than those with a limiting health condition (41 per cent, compared to 22 per cent). They were also more likely than participants on average to feel the service was not relevant for their needs (19 per cent, compared to 14 per cent). Those with a limiting health condition were more likely to have left due to their health deteriorating (12 per cent, compared to 5 per cent on average), and to have left because they found the staff / advisers unhelpful (5 per cent, compared to 2 per cent on average).
Reasons for leaving the service across the 2020 cohort, the 2019 cohort at Wave 2 and the 2018 cohort at Wave 1
Figure 19 shows the most common reasons for ceasing engagement with the FSS service among the 2018, 2019 and 2020 cohorts. It demonstrates that participants from the most recent cohort were more likely to have left the service because they found work than participants from the 2018 or 2019 cohorts (29 per cent, compared to 19 per cent and 21 per cent respectively). There are two factors that may have contributed to this increase.
Firstly, 2020 cohort participants were more likely to have moved into work than those from the 2018 cohort at Wave 1 or the 2019 cohort at Wave 2 (38 per cent compared to 29 per cent and 34 per cent respectively). This difference is explored further in the Working Status and Quality of Work chapter. Secondly, 2020 cohort participants were more likely to still be receiving support from FSS at the time of the survey than previous cohorts. At the time of the survey, 61 per cent of the 2020 cohort were still receiving support, compared to 52 per cent of the 2018 cohort at Wave 1. This may suggest that participants from the most recent cohort were less likely to leave the service before they had found work than the 2018 cohort.
Furthermore the first Wave of FSS participants were more likely than both subsequent Waves to report that their programme of support came to an end (22 per cent, compared to 14 per cent of the 2019 cohort and 15 per cent of the 2020 cohort), and that they left due to a deterioration of their health (17 per cent of the 2018 cohort compared to 7 per cent of the 2019 cohort and 5 per cent of the 2020 cohort). This may indicate that the service improved its support for people with health conditions across the three Waves, to enable them to remain on the programme.
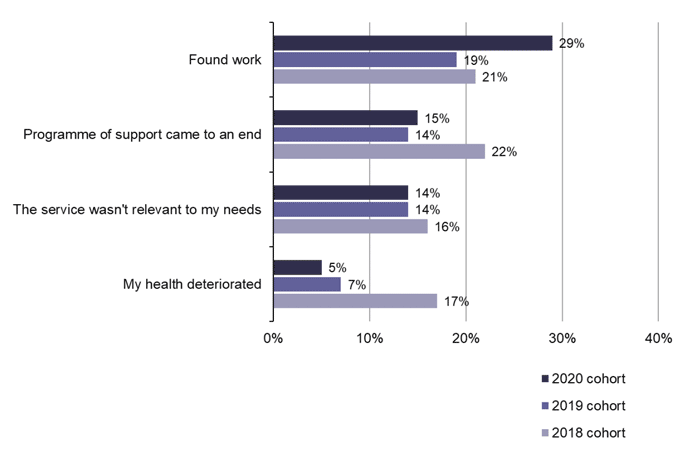
Source: D4: Why did you leave the support service? Base: 2020 cohort no longer receiving support (224) 2019 cohort no longer receiving support (233) 2018 cohort no longer receiving support (456)
Whether FSS helped participants to find a job
Participants in the 2020 cohort who were employed, self-employed, or had worked in the last week were asked whether the support they received from FSS helped them to get their job.
As shown in Figure 20, for the 2020 cohort the majority (57 per cent) agreed that FSS has helped them to get their job, with over one-in-three (35 per cent) strongly agreeing with this. Less than one-in-three (29 per cent) disagreed. For the 2019 cohort, over seven-in-ten (72 per cent) agreed that FSS helped them get their job, while 14 per cent disagreed. For the 2018 cohort half (50 per cent) thought that FSS helped them get their job, while two-fifths (40 per cent) disagreed.
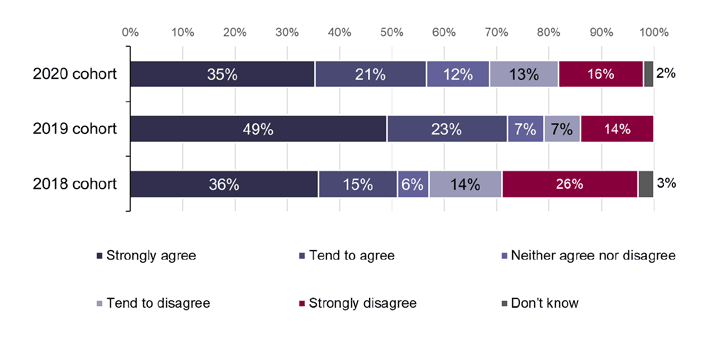
Source: IFF Research telephone survey of FSS customers, A9_w3 To what extent would you agree that the support you received from Fair Start Scotland helped you to get your job? Base: All employed, self-employed or have worked in the last week 2018 cohort (47) 2019 cohort (64) 2020 cohort (247)
Those in the 2019 cohort were more likely than those in the 2020 or 2018 cohorts to agree that FSS support helped them to get their job (72 per cent vs. 57 per cent and 50 per cent respectively).
In the 2020 cohort, employed participants aged 50+ were more likely than those aged 16-24 to disagree that FSS support helped them to get their jobs (42 per cent vs. 16 per cent).
Contact
Email: Arfan.iqbal@gov.scot