Fair Start Scotland: evaluation report 4 - participant phone survey - year 3
Part of a series of reports on the evaluation of Fair Start Scotland (FSS) employability services. The report presents more detailed findings from a representative telephone survey of FSS participants and explores their experiences in the third year of delivery
Working status and quality of work
Employment status of the 2020 cohort
This chapter will look at the working status of the 2020 cohort at the point of survey and the quality of work that they undertake. Throughout the chapter comparisons will be made to previous cohorts to assess how the working status and quality of work for new participants has changed over the three Waves of this survey.
At the time of the Wave 3 survey thirty-six per cent of the 2020 cohort were either working for an employer or self-employed (see Figure 21). A further two per cent had done some paid work in the week leading up to the interview. This was around the same as the proportion of the 2019 cohort participants that were in work at the point of the Wave 2 survey (in May 2020), which was 35 per cent.
More than half of the 2020 cohort were not working and either claiming an out of work benefit (46 per cent) or not working and not claiming and out of work benefit (9 per cent). A similar number of participants were in education or training (5 per cent) or were not working but due to start work within the next month (4 per cent).
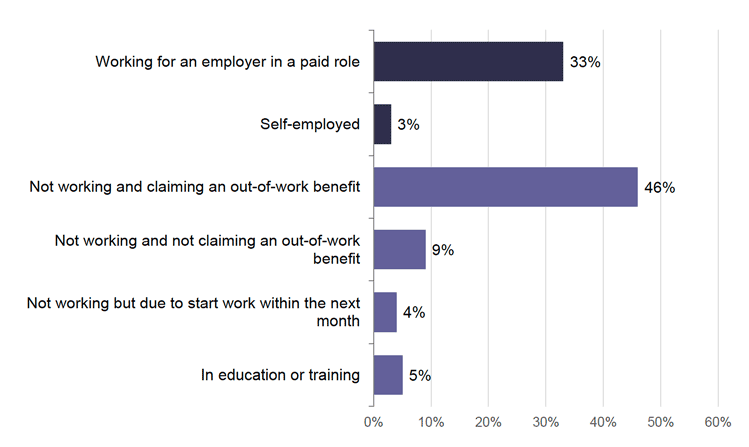
Source: IFF Research telephone survey of FSS customers. A1_W3. Which of the following best describes what you are doing at the moment? Base: 2020 cohort (663) A1A_W3.
There were several factors that affected participants' likelihood of having done some paid work in the week previous to the interview:
- Gender was one factor with female respondents were more likely than male respondents to be working (43 per cent, compared to 35 per cent)
- Education was also a contributing factor and respondents who had achieved a degree or higher were more likely than average to be in employment (48 percent compared to 38 per cent).
- Respondents who had not worked in the last 5 years were far less likely than average to be working (11 per cent compared to 38 per cent)
- Respondents with no health conditions were more likely to be working than respondents with a health condition that limits their day-to-day activity (46 per cent vs 28 per cent)
- Whether or not respondents left the service early was also a contributing factor, with those leaving early much less likely to be in employment than those who did not (24 per cent, compared to 40 per cent)
In terms of the forms of work undertaken, female participants were more likely than male participants to be working for an employer in a paid role (39 per cent vs 29 per cent)
Regarding benefits, male participants were more likely than female participants to be claiming an out of work benefit (50 per cent vs 40 percent).
Figure 20 shows that, among the 2020 cohort who had worked in the last week, one in ten (10 per cent) were working fewer than 16 hours, under a quarter (23 per cent) were working between 16 and 29 hours per week and around six in ten (61 per cent) were working 30 or more hours per week.
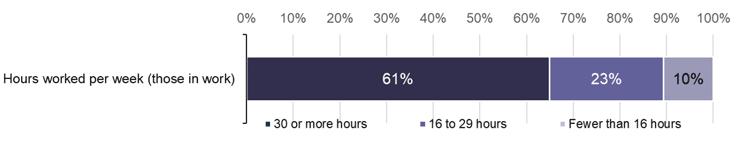
Source: IFF Research telephone survey of FSS customers. A3_W2. How many hours per week do you usually work, or spend in education? Base: 2020 cohort in work (247)
Participants who had done some paid work in the week prior to the interview were asked when they began their job. Six-in-ten respondents (58 per cent) said they had started working in the current job less than 6 months ago. Half as many (30 per cent said they had started between six months and a year ago and one in ten (10 per cent) said they had started more than one year ago.
Regarding number of hours usually spent working per week ethnicity appeared to be a factor with participants who were white more likely than those from a non-white background to be working 30 hours or more per week (63 per cent, compared to 42 per cent).
Employment status: comparison between cohorts in their first year
The employment status of the 2020 cohort has been compared to the 2018 and 2019 cohort, to assess differences between the cohorts in employment status during the year after joining the service[10].
The proportion of the 2020 cohort to have done some work in the last week (38 per cent) did not vary significantly from the proportion of the 2019 cohort (34 per cent), as can be seen in Figure 23. However, there was a significant increase between the 2020 cohort and the 2018 cohort in the proportion that had done some paid work in the last week (38 per cent compared to 30 per cent).
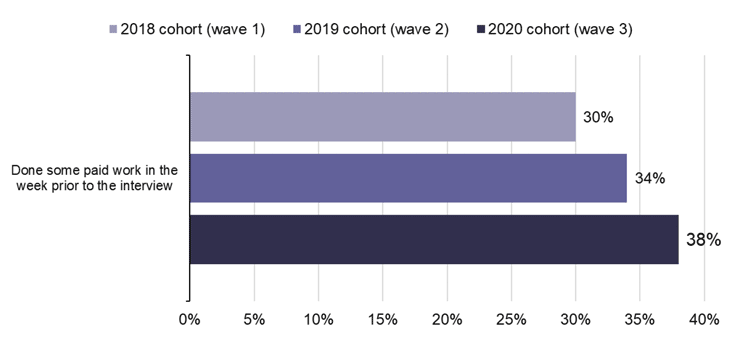
Source: IFF Research telephone survey of FSS customers. A1_W3. Which of the following best describes what you are doing at the moment? Base: 2020 cohort (663) 2019 cohort (607) 2018 cohort (1005) A1A_W3. In a typical week do you do any paid work, either as an employee or self-employed? Base: all other than employed and self-employed 2020 cohort, Wave 3 (427), 2019 cohort , Wave 2 (427), 2018 cohort, Wave 1 (733)
There was some improvement between the 2019 and 2020 cohort as fewer participants in the 2020 cohort were not working and claiming an out of work benefit than were in the 2019 cohort at Wave 2 (53 per cent compared to 46 per cent).
There was a greater difference between the 2018 cohort at Wave 1 and the 2020 cohort at Wave 3 in relation to employment status. Significantly more of the 2020 than the 2018 cohort were:
- Working for an employer in a paid role (33 per cent of the 2020 compared to 26 per cent of the 2018 cohort);
- Self-employed (3 per cent of the 2020 cohort compared to 1 per cent of the 2018 cohort);
- In education or training (5 per cent of the 2020 cohort compared to 1 per cent of the 2018 cohort).
Additionally, significantly fewer of the 2020 cohort than the 2018 cohort were not working and claiming an out of work benefit (46, per cent compared to 62 per cent); or not working and not claiming an out of work benefit (9, per cent compared to 6 per cent).
There was also an indication that the 2020 cohort were working in more full-time roles than the 2018 cohort were at Wave 1. Significantly more new participants at Wave 3 were working thirty or more hours per week than were at Wave 1 (58 per cent, compared to 49 per cent), though this difference was not reflected between the 2019 and 2020 cohort.
COVID-19
The ongoing COVID-19 pandemic impacted the employment situation in some way for one third (34 per cent) of the 2020 cohort. Figure 24 shows that almost one-in-six (16 per cent) of the 2020 cohort reported losing their job because of the pandemic, a further one in twenty (5 per cent) reported having lost their job because of the pandemic but that they were employed again by the time of the survey.
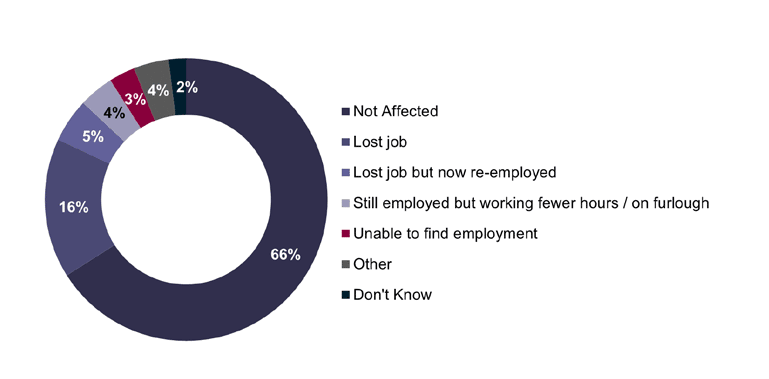
Source: IFF Research telephone survey of FSS customers. A1b_W3 and has your employment status changed at all as a result of the Coronavirus outbreak? & A1c_W2. What is your employment situation at the moment? Base: All participants (663)
Participants' age was a factor in how the COVID-19 pandemic impacted participants' employment status. More 16–24-year old's than average lost their job because of the pandemic (22 per cent compared to 16 per cent), however, fewer 25–34-year old's than average lost their job (11 per cent compared to 16 per cent).
Respondents with no health condition were more likely to have lost a job but be re-employed again (8 per cent, compared to 5 per cent overall). By Lot those in Lanarkshire (9 per cent) and Tayside (11 per cent) were also more likely to have found themselves in that position.
Participants from the 2019 cohort interviewed at Wave 2 were asked the same questions as participants at Wave 3 about how the COVID-19 pandemic had impacted their working status. Given the pandemic was still in its relative infancy during the spring of 2020 it is perhaps unsurprising that significantly more of the 2020 cohort than the 2019 cohort agreed that the COVID-19 pandemic had impacted their employment situation (34 per cent, compared to 23 per cent).
Quality of work
The Wave 3 survey asked participants about their job roles, how much they earned and the type of contract they were employed on. These questions were asked of all participants who were employed at the time of the survey.
Occupation
Figure 25 shows the profile of participants that were either employed, self-employed or had worked in the last week, by occupation. The occupations are ordered based on the ONS hierarchy which moves from highly skilled professionals at the top, to less skilled professions at the bottom. Similarly, they are colour-coded, based on the broad occupational group they fall into.[11]
The most common occupational group of the 2020 cohort was labour intensive occupations (38 per cent) with three in ten working in elementary occupations (28 per cent) and nine per cent working as process, plant, and machine operatives. Following this, a further three in ten (30 per cent) worked in service intensive occupations split by sales and customer services (16 per cent) and caring, leisure and other services (14 per cent). Slightly more than one sixth of the 2020 cohort (17 per cent) worked in middle skill occupations and a similar proportion (15 per cent) worked in high skill occupations.
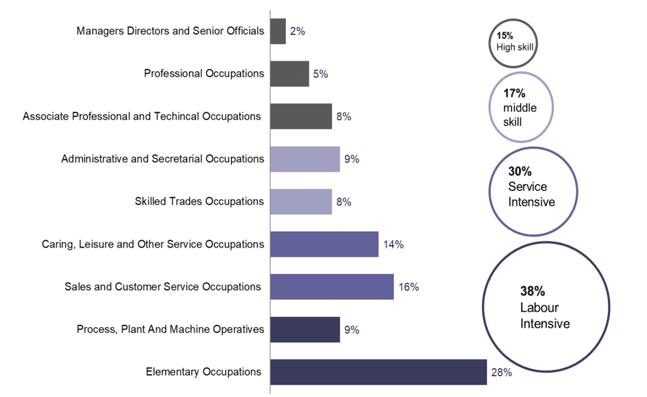
Source: IFF Research telephone survey of FSS customers. Taken from collating and coding answers from A5: What is/was your job title? And A6: What do/did you mainly do in your job? Base: 2020 cohort that were employed, self-employed or had worked in the last week (247).
Several factors had an impact on the type of occupations in which participants were working. Female participants were more likely than males to work in service intensive occupations (45 per cent, compared to 18 per cent) and were less likely to work in labour intensive occupations (27 per cent, compared to 46 per cent).
Age also had an impact on occupation with the youngest participants, aged 16-24, being more likely to work in labour intensive occupations (51 per cent compared to 38 per cent), while respondents aged 35-49 were less likely than average to work in those occupations (28 per cent compared to 38 per cent).
Qualification levels was also a factor and those with national level 1-5 or equivalent were more likely than average to work in labour intensive jobs (51 per cent) and less likely than average to work in in high skilled jobs (4 per cent). Conversely, those with a degree or higher were more likely to work in high skilled occupations (33 per cent), and less likely than average to work in labour intensive occupations (21 per cent).
Ethnicity played a smaller part with participants from a white background being more likely that participants from a minority ethnic background to work in service intensive occupations (34 per cent compared to 19 per cent). Similarly, parents were less likely to work in labour intensive occupations that non-parents (26 per cent compared to 41 per cent).
Occupation, comparison between cohorts
Occupations of the 2020 cohort have been compared to the 2019 cohort, to assess differences between the two cohorts' occupational levels, in the year after joining the service.[12] Fewer of the 2020 cohort were working in labour intensive occupations than the 2019 cohort at the same point in their FSS journey (38 per cent, compared to 50 per cent). Meanwhile, more of the 2020 cohort at Wave 3 were working in highly skilled occupations than the 2019 cohort (15 per cent, compared to 7 per cent).
Income
As is shown in Figure 26, one in seven (14 per cent) of the 2020 cohort in work were earning below the national living wage (£8.71 at the time of the survey).
The majority (76 per cent) of the working cohort were earning above the national minimum wage with more earning between £9.31 - £15.00 per hour (42 per cent) than any other wage.
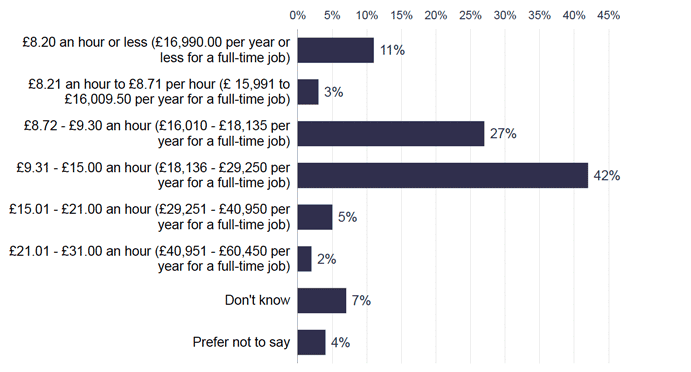
Source: IFF Research telephone survey of FSS customers, A7: Can you tell me your usual pay including overtime, bonuses, or tips (but before tax and other deductions are taken out)? Base: All employed self-employed or had worked in the last week (247)
As would be expected age is a contributing factor to income with the youngest of the cohort, aged 16-24, being much more likely to be earning £8.21 or less (24 per cent).
Income, comparison between cohorts
As discussed, there appears to have been a shift to more highly skilled occupations amongst the 2020 cohort, which is reflected in higher incomes. Compared to the 2019 cohort, surveyed at Wave 2, there has been a large drop in the proportion of participants earning national living wage or below at Wave 3 (31 per cent at Wave 2, compared to 11 per cent at Wave 3). Similarly at Wave 2 only a quarter (24 per cent) of new participants were earning more than £9.30 an hour (£18,136 or more per year for a full-time job), whereas at Wave 3 half (49 per cent) of participants were earning roughly that figure or higher - significantly more than at Wave 2.[13]
Type of employment contract
Participants in the 2020 cohort who had worked within the last week were asked what type of employment contract they had. The results can be seen in Figure 27. More than four in ten (43 per cent) had a permanent employment contract, while a third (33 per cent) had a temporary contract. Those employed on a zero hour contract made up 10 per cent of the working 2020 cohort, while a similar number (8 per cent) were self-employed.
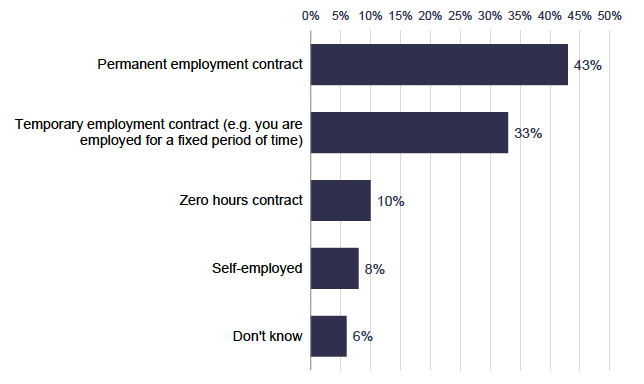
Source: IFF Research telephone survey of FSS customers, A8: Can you tell me what type of employment contract you have? Base: All employed, self-employed or have worked in the last week (247)
There were some sub-group differences between the types of contacts that participants held. Those who were white were more likely than minority ethnic participants to be employed on a permanent contract (47 per cent, compared to 30 per cent). Male participants were more likely than female participants to be self-employed (12 per cent compared to 4 per cent), additionally participants from lot 5: East were more likely than average to be self-employed (18 per cent).
Types of employment comparisons between cohorts
Interestingly the shift towards more skilled jobs and higher income, was not matched by more respondents being employed on a permanent contract. In fact, significantly fewer new participants at Wave 3 who had worked in the last week were employed on a permanent contract than new participants at Wave 2 (43 per cent, compared to 55 per cent).
Contact
Email: Arfan.iqbal@gov.scot