Fair Start Scotland - evaluation report 3: year two - overview
Third report in a series of evaluation reports of Fair Start Scotland employability services which covers the second full year of service delivery (April 2019 - March 2020) and summarises findings from a participant phone survey, local area case studies and analysis of management information.
2. Reach of Fair Start Scotland, April 2019 – March 2020
This chapter focuses on who FSS has reached in the second year of delivery. It does this by looking at the various different data sources that collected demographic information on people starting FSS support between April 2019 and March 2020. It begins by looking to address the following questions:
- Who started on FSS, what barriers might they face, and how does this compare with the unemployed population in Scotland?
- Have there been changes in the demographics of FSS between the first and second year of FSS?
The analysis to answer these questions focuses on protected characteristics (as defined by the Equality 2010 Act; such as age and gender) and FSS early entry groups[2]. It uses data collected by the Fair Start Scotland service providers, and from the Office for National Statistics (ONS) Annual Population Survey (APS). Further information can be found in Appendix 4.[3]
The chapter then goes on to look at further demographic information collected through a telephone survey of participants, giving us further detail about qualifications, employment history and family circumstances. It finishes with an overview of what worked well, what could be improved, and what we are doing to make these improvements.
2.1 Who started on FSS, what barriers might they face and how does this compare with the unemployed population in Scotland?
FSS received 17,139 referrals in the second year, with 12,077 people joining (70%). This is an increase from the 10,063 that joined in the first year of FSS.
Not only has the number of people starting FSS increased, but the percentage of people referred who went on to start FSS (i.e. the start rate) has increased from year 1 to year 2. 58% of referrals to FSS in the first year went on to start on the service, rising to 70% in the second year.
Figure 1 shows that compared with the unemployed population of Scotland, the second year of FSS had:
- A lower proportion of females
- A lower proportion of young people
- A lower proportion of minority ethnic individuals
- A lower proportion of individuals from rural areas
- A higher proportion of lone parents
- A higher proportion of disabled people
- A higher proportion of individuals from 15% most deprived areas
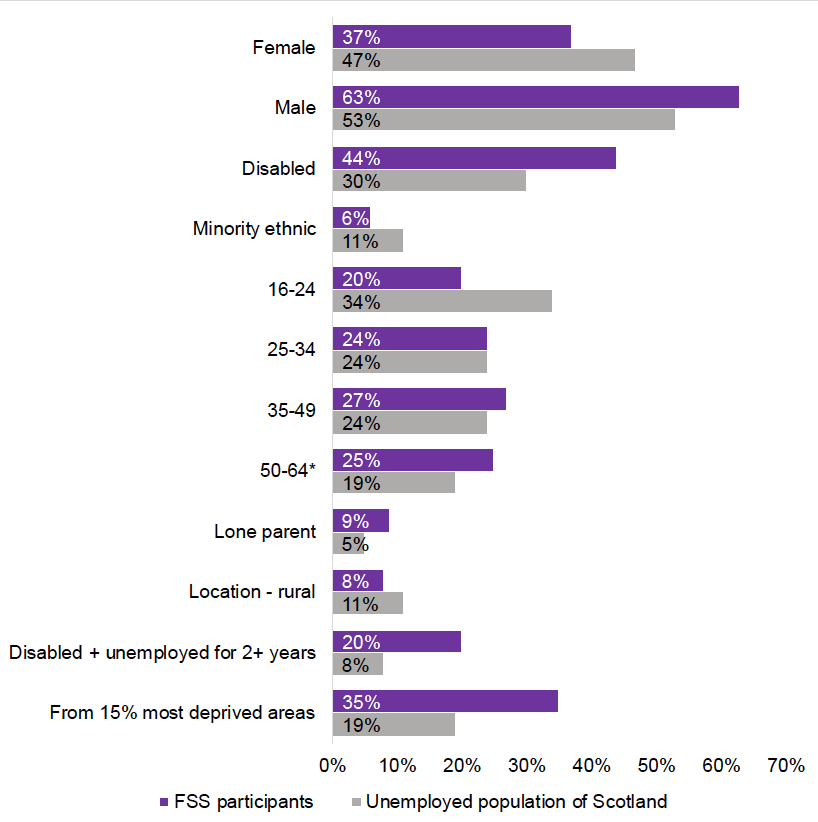
Sources:
Annual Population Survey, ONS (Apr 19-Mar 20 dataset) for all categories except lone parents
Annual Population Survey Household dataset, ONS (Jan-Dec 2019) for lone parent category only
*APS data is 50+ rather than 50-64.
Unfortunately there is no reliable data on the proportions of the unemployed population in Scotland who are care experienced, are refugees or have convictions. Nonetheless for year 2 of FSS, we know that:
Care experienced 6%
Refugees 3%
Convictions 12%
2.2 Have there been changes in the demographics of FSS between the first and second year of FSS?
Figure 2 illustrates that compared with the first year of FSS, the second year was generally similar to the first year. The second year had a slightly higher proportion of: females, young people, lone parents, people with convictions, refugees, and people who have experienced care. There were also lower proportions of people with disabilities and people in the older age groups.
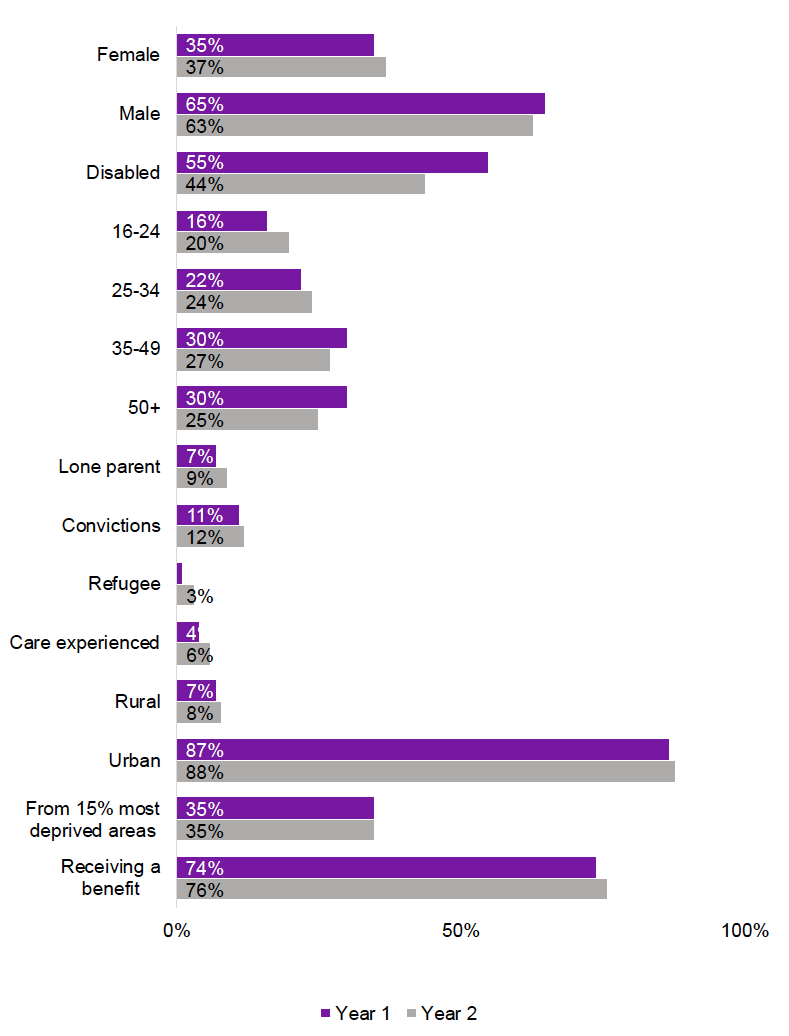
* A comparison over time is not presented due to an increase in missing information on ethnicity in year 2
2.3 Additional demographic information
The telephone survey gathered additional data on the characteristics of year 2 participants in order to provide us with demographic data in instances where we have incomplete or limited data from FSS management information sources. For example this includes areas such as qualifications, employment history, and whether participants were part of a priority family group[4].
Around three-quarters (77%) of the year 2 participants had achieved equivalent to National 1-5 or higher, with almost a fifth (18%) having the highest level of qualification of level 8 or above (degree or above, Higher National Diploma, SVQ4 or SVQ5). One in ten (10%) had no formal qualifications. The qualification levels of the year 2 participants were broadly in line with the year 1 participants.
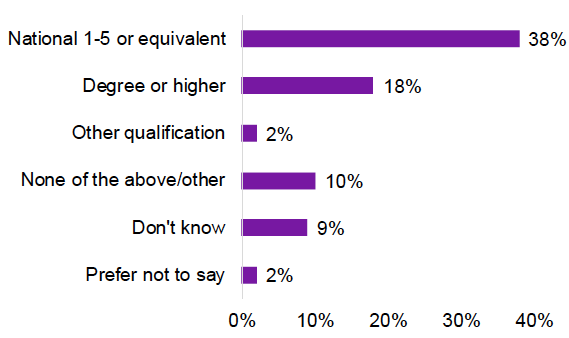
Source: IFF Research telephone survey of FSS customers, H3: What is the highest level of qualification that you have achieved? Base: All 2019 cohort (607)
Around a third (34%) of the year 2 telephone survey participants had been out of work for the whole of the five-year period prior to receiving support from FSS.
Three in ten (30%) stopped working in their most recent role over five years ago, and for one in ten (10%) it was between one and two years since they had last been in work.
Both the time that participants had spent out of work and the length of time since their last role was correlated with qualification level. Year 2 participants with a degree level qualification or above were less likely to have been out of work for five or more years (2%) and to have stopped working in their most recent role five or more years ago (19%), compared to participants overall.
Health condition also played a role in employment history, with participants who had not worked in the last five years more likely to say that they were impacted by their health condition a lot (37% compared with 22% who had worked in the last five years).
The year 2 telephone survey participants were broadly similar to the year 1 group in terms of their employment history.
Just over a fifth (21%) of the year 2 telephone survey participants were identified as part of a priority family group. As proportions of the overall cohort, 13% were parents with a disability/health condition, 11% of the cohort were lone parents, 5% were large families, 4% were parents from minority ethnic groups, 2% were young parents and 1% were a family with a child under 12 months.
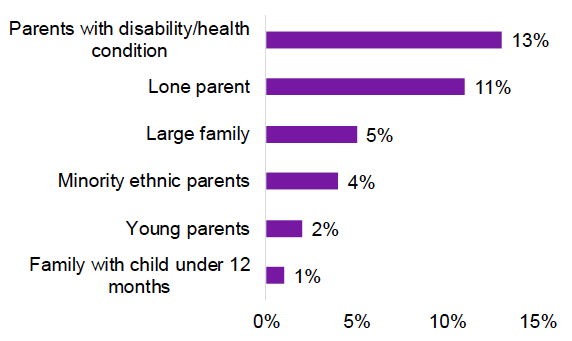
Source: IFF Research telephone survey of FSS customers, Base: All 2019 cohort (607)
What worked well?
Fair Start Scotland appears to be reaching participants who have a broad range of social and economic characteristics, including those that may face barriers to finding employment.
Proportions of women and younger people joining FSS were higher in year 2 than in year 1, which was identified as an area for improvement in the year 1 evaluation.
FSS continues to serve a higher proportion of those with disabilities and those from the most deprived areas than the overall unemployed population of Scotland, groups who are more likely to have barriers to employment.
Telephone survey results indicate that around a fifth of FSS participants are part of priority family groups, a key target group as they have a higher than average risk of child poverty.
What could be improved?
Although there have been areas of improvement, some people with particular barriers and characteristics are not as well represented as they could be. There is still scope to improve on the proportions of women, people from minority ethnic backgrounds and rural residents who are engaging with FSS services.
What are we doing?
Scottish Government continue to adopt initiatives and align policy to extend the reach of FSS.
In the summer of 2019, a simplified eligibility pilot was launched in seven Jobcentre Plus locations specifically chosen due to their high level of deprivation. The pilot meant that anyone in receipt of a working age benefit who lives in a postcode served by the pilot JCPs was eligible for FSS from day one of unemployment.
The pilot was originally agreed for 3 months and early in 2020 it was agreed that it would run indefinitely across the existing pilot locations and a further delivery area.
In early 2020, we worked in partnership with JCP to extend the eligibility criteria to allow day 1 access to the service for our most vulnerable citizens. This ensured an earlier intervention was available to provide intensive support to those who want help to find and remain in work, including lone parents, minority ethnic groups and refugees.
In 2019, a pilot commenced in Glasgow aimed at providing FSS support to a cohort of minority ethnic women. This has proved to be successful and we continue to monitor how participants are progressing within their employability journey.
FSS is intrinsically linked to wider SG ambitions such as:
- Tackling the Gender Pay Gap - FSS providers are committed to and actively promote the Fair Work Agenda and work with many employers who pay the Scottish Living Wage.
- Race Employment Gap – FSS are represented on the BME Employability Steering Group where we actively promote the services of FSS to support this group.
Contact
Email: socialresearch@gov.scot