Expansion of funded early learning and childcare to 1140 hours: 2018-2025 national outcomes evaluation
This is the overarching report on the national programme of evaluation from 2018 to 2025 of the expansion of funded early learning and childcare in Scotland to 1140 hours. It presents the main findings across all the strands of research and analysis that together form the outcomes evaluation.
5. To what extent has the ELC expansion achieved its intermediate outcomes?
As set out in the Introduction and the Evaluation Strategy, the expansion of funded ELC to 1140 hours is expected to realise six intermediate outcomes:
- ELC is high quality
- ELC is accessible for all and parents are aware of it
- ELC is sufficiently flexible to meet parents’ needs
- Take-up is maximised
- ELC is affordable for all parents
- Parents’ confidence and capacity is increased through enhanced nurture and support.
According to the logic model for the ELC expansion (see Section 1.3), these intermediate outcomes must first be realised in order for the programme’s high-level outcomes to be achieved.
This chapter summarises the available evidence on the extent to which the first five of these intermediate outcomes have been achieved. The sixth intermediate outcome – increased parental confidence and capacity – is discussed in Section 6.4. Further detail on the analysis for this section can be found in the Supporting Tables or the relevant report referenced.
5.1 Quality of funded ELC
Most settings providing funded ELC achieve all grades of good or better in Care Inspectorate quality evaluations, although there has been a slight decrease since the expansion. The proportion of private sector settings achieving grades of good or better is lower than for the public and third sectors, and has fallen since the pandemic. The number of teachers and graduates has increased substantially over the period of the expansion.
Most parents were satisfied with funded ELC provision in 2024, similar to previous years. There was, however, an increase in the proportion of parents reporting they were very satisfied.
International research evidence (Melhuish et al. 2015; OECD, 2017; Scobie & Scott, 2017), including from Scotland (Scottish Government, 2015; Knudsen et al, 2017), identifies the quality of ELC as the key determinant of improved children’s outcomes. The National Standard for funded ELC providers sets out what children and families should expect from their funded ELC experience in Scotland.
High quality ELC not only provides nurturing care for children but also supports their learning and development from an early age. Because of this, both the Care Inspectorate and HM Inspectors of Education (HMIE) have statutory roles in relation to inspection. All daycare of children services and childminders must be inspected by the Care Inspectorate, regardless of whether they provide funded ELC hours, while nursery settings that provide funded ELC hours can be inspected by both the Care Inspectorate and HMIE.[12] In addition to data from inspections, measures of whether funded ELC meets the needs of children with ASN and parental perceptions of quality are also important (and are considered by HMIE as part of the inspection process).
5.1.1 Care Inspectorate quality grades
Around nine in 10 settings providing funded ELC achieved grades of good or better across all four key Care Inspectorate quality questions in 2024. The proportion has fallen slightly between 2016 and 2024, from 91% to 89%. There has been a more marked fall in the percentage of services with the highest evaluations (very good and excellent) for every key question. In 2024, 32% of services providing funded ELC achieved grades of very good or excellent in all four key questions, a decrease from 46% in 2016. It should be borne in mind when interpreting the data on quality gradings that the Care Inspectorate quality framework and inspection model have changed since 2020, which may impact on comparability over time. [13]
As shown in Figure 3, the proportion of services providing funded ELC that achieved grades of good or better in all four key questions has been consistently highest among public sector settings (93% in 2024) and relatively lower among private settings (81% in 2024). The proportion of private sector settings achieving grades of good or better has also fallen, from 85% in 2017 to 80% in 2021, rising slightly to 81% in 2024.
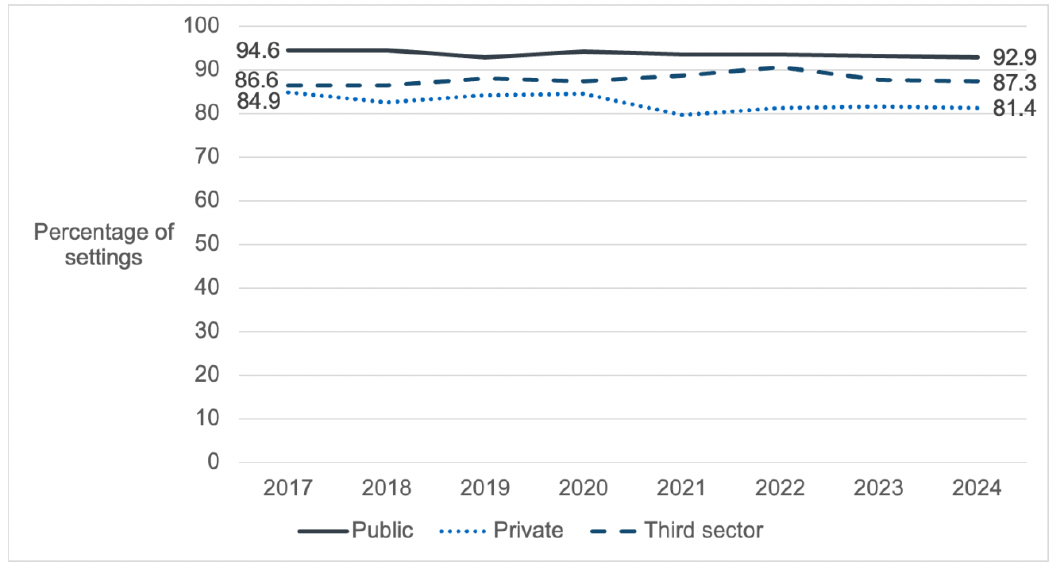
Source: Care Inspectorate Early Learning and Childcare Statistics
Overall, the quality of services providing funded ELC is high across all SIMD quintiles, although there is some variation. In 2024, when looking at the most recent evaluations for funded services by SIMD of the service, services in the fourth quintile, as well as the first quintile (the most deprived 20% of areas) had the lowest proportion of services that had evaluations of good and better (88%). Services in the second quintile and fifth quintile (least deprived 20% of areas) had the highest proportion of services that had evaluations of good and better (91%). This variation by SIMD has fluctuated over time, but with generally little variation in the quality of services across different levels of deprivation, and no distinct trend between deprivation level and quality. SIMD analysis is based on the location of the service rather than the home postcodes of children using the service. Most international research finds a negative relationship between quality of ELC and level of deprivation of a location. It is a positive finding that there appears to be little variation in Scotland, and this has not changed notably since the expansion.
There was some variation in the proportion of services achieving grades of good or better across all key questions between urban and rural areas in 2024: the difference between the lowest (large urban areas – 87% of services), and highest (accessible rural areas – 95% of services), was 7.6 percentage points in 2024. This was an increase in variation compared with 2023 when the same classification of areas represented the highest and lowest percentages, but the difference was 6.3 percentage points. Again, the variation by urban rural classification has fluctuated over time, but with accessible rural areas and accessible small towns tending to have a higher proportion of services achieving grades of good or better than other areas. There is also some variation between local authorities, with the proportion of settings achieving good or better grades ranging from 71% to 98% in 2024. This does suggest that quality of ELC may be lower in some areas than others although, again, there has been no notable change since the expansion.
5.1.2 Staff qualifications
At the outset of the expansion, the Scottish Government recognised that the single most important driver of the quality of a child’s ELC experience is a high quality workforce. The Expansion of ELC Quality Action Plan (Scottish Government, 2017b) and Skills Investment Plan (Skills Development Scotland, 2018) set out actions required to ensure a skilled workforce was in place to deliver the expanded provision. These included both building new workforce capacity and enhancing the learning and development offer for the workforce. The Quality Action Plan also underlined the importance of strong leadership of learning in settings. In particular, the Equity and Excellence Lead commitment aimed to ensure nurseries in the most deprived areas benefitted from an additional graduate practitioner or teacher.
Scotland has the only registered childcare profession in the UK, which brings a number of benefits for registrants and service users (Early Education, 2025). All childcare staff in Scotland, who are registered with the SSSC, must complete specific qualifications relating to the role they are registered to undertake (the three categories of registration for childcare staff are: support worker, practitioner and manager).[14] A registered profession helps ensure consistent standards for service users and raises the status and professionalism of those supporting children and families. Childcare professionals are required to complete their necessary qualifications within three years of taking up post. If the relevant qualification is not achieved within three years that individual is removed from the register and cannot work in support of children in ELC.
Anyone working toward a relevant qualification has a ‘qualification condition’ on their registration until is it completed. Around two-thirds of those joining the sector do so by gaining a Scottish Vocational Qualification (SVQ), allowing them to study, and earn a wage, as they develop their skills and knowledge on the job. With a high proportion of those joining the sector utilising vocational training pathways, and all childcare professionals required to register within a few months of taking up a role, there will always be registrants with qualification conditions.
The Scottish Government worked with partners including Skills Development Scotland, the Scottish Funding Council, universities, colleges, and private training providers, to increase provision of training opportunities for the large number of additional people joining the sector for the expansion.
Registration and qualifications of professionals delivering funded ELC
The SSSC publish information on the percentage of individuals who are qualified by register type. Data from October 2025 show that 77% of daycare of children registrants have achieved the required qualification for their role, showing that the childcare profession is more qualified than any other part of the SSSC register.[15] When comparing the whole daycare of children workforce registered with SSSC, the proportion of those who have achieved the qualification necessary for their role is higher in services providing funded ELC than non-funded childcare.
Across the three categories, the proportion of ELC staff who have a qualification condition is considerably lower in the public sector, compared to the private and third sectors. Many local authorities seek to employ fully qualified staff in their settings, which means that private and third sector settings have more staff still working toward achieving a relevant qualification. Across all parts of the sector, the proportion of ELC setting managers with a qualification condition has declined by at least ten percentage points since 2019, indicating a growing cohort of qualified managers as the expansion took effect. There has been much less change among the other staff roles – support worker and practitioner – when comparing changes over time by sector type.
Teachers and graduates delivering funded ELC
As shown in Figure 4 below, the total full time equivalent (FTE) of teachers and other early years graduates working to deliver funded ELC was 4,808 in 2025, an increase of 49% since 2017. In 2025 there were 696 FTE teachers working in funded ELC and 4,112 FTE graduates, other than teachers, with degrees relevant to early years.
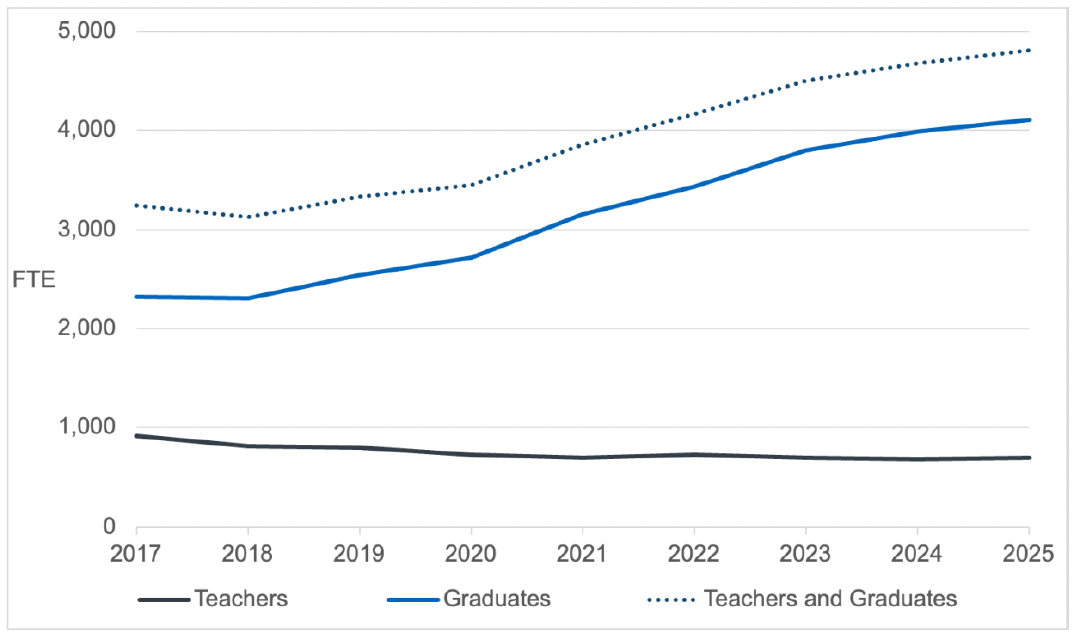
Source: Scottish Government Early Learning and Childcare census
Since 2017, the FTE of teachers has decreased by 24% from 921, despite a 2% increase between 2024 and 2025. However, the FTE of graduates has increased by 78% over the same period, from 2,316 in 2017 (see Figure 4).
In 2025, there were also 1,090 FTE funded ELC staff working towards the SSSC benchmark degree level qualifications for registration as a manager of a daycare of children service. This is a decrease from 1,565 in 2020, and the lowest since 2017 – as may be expected post-expansion, following a period during the expansion when many additional managerial roles were created.
Overall, when the number of those working towards relevant degree level qualifications is combined with the number of teachers and graduates, the total is the highest with the exception of 2023. There was a total of 5,898 FTE for teachers, graduates, and those working towards relevant degree level qualifications in 2025, an increase of 39% from 4,230 in 2017. This suggests many across the childcare profession are undertaking degree level qualifications simply to enhance their practice without necessarily doing so to progress to a managerial role.
5.1.3 Parental satisfaction with the quality of funded ELC
Data from the SHS show that most parents (91%) were very or fairly satisfied in general with the funded ELC provision they received in 2024. This was similar to previous years. However, looking at overall satisfaction with funded ELC masks an increase in the proportion of parents reporting they were very satisfied with funded provision: from 57% in 2018 to 72% in 2024. There was no clear pattern in level of satisfaction by area deprivation.
When asked how satisfied they were specifically with the quality of the provision from their main provider of funded ELC, most (88%) respondents to a 2025 survey of parents of ELC-age children were very (62%) or fairly (26%) satisfied. However, this fell from 97% in 2022 (70% very and 27% fairly satisfied). In 2025, parents who were more likely to be satisfied included those living in the 80% least deprived areas (94%, compared with 79% of those in the 20% most deprived areas), those living in remote areas (97%, compared with accessible areas 90%) and those with a child with ASN (96%, compared with 87% of households with no child with ASN).
5.1.4 Parental satisfaction with provision for children with ASN
In the 2025 parent survey, just under a fifth (18%) of parents said they had an eligible children with ASN – this is similar to the proportion of children with ASN registered for funded ELC (see Section 5.4.1). Most of these parents (89%) were satisfied that their funded ELC met their child’s ASN in 2025, which was similar in 2022. Only 6% were dissatisfied in 2025. Results from 2017 are not directly comparable as there was also a ‘neither satisfied nor dissatisfied’ option, but at that time 57% of parents of children with ASN said that they were satisfied and 18% were dissatisfied, indicating a general improvement since the expansion.
Reported challenges in provision for children with ASN in 2025 included: staff not having sufficient training, experience, skills, or time to provide sufficient support to children with ASN; not enough staff available to meet the needs of the child, and ELC environments not being suitable for children with ASN.
5.2 Accessibility of funded ELC
Findings on accessibility are generally positive, and awareness of funded ELC among parents of three- and four-year-olds is high. However, awareness of the offer or transport difficulties are barriers for a small minority of parents. A substantial minority of parents of children with ASN also still experience difficulties accessing funded ELC.
The programme logic model highlights that the intermediate outcome of accessibility for families is a key determinant of take-up of ELC. Whether or not ELC is accessible for families includes aspects such as: whether parents know about the entitlement and how to apply; ease of registration; whether ELC is conveniently geographically located and any transport barriers (e.g. cost or availability of public transport); whether there are barriers in terms of the needs of the child (including ASN or language barriers); and the ability to combine different providers of funded ELC, or funded ELC with childcare for other children.
Accessibility and flexibility are also closely linked, with the flexibility of provision (e.g. in terms of opening hours) impacting on whether it is accessible for parents – Section 5.3 discusses flexibility. This section discusses those aspects of availability where relevant data are available.
5.2.1 Parental awareness of the availability of funded ELC
Awareness of funded ELC has improved in recent years, though the data suggest a very small minority of households are unaware of its availability. As set out in Section 5.4.1, ELC Census data show that almost all eligible three- and four-year-olds are registered for funded ELC. In 2024, of the respondents to the SHS who said they were not using funded ELC to which they were entitled, none said this was because they were not aware of it. Between 2018 and 2023 there were small numbers of households who reported that they were not aware of the offer. However, the sample size for this question was small and these figures should therefore be treated with caution.
In the 2025 parent survey only 5% of respondents with a three- to five-year-old were not using funded ELC at the time of the survey. Among those who were eligible for funded ELC at the time of the research and not using it, 15% said this was because they were unaware of the availability and 10% did not know how to apply or found applying too difficult. In the 2017 survey these figures were 21% and 14%. Comparisons between the surveys should be treated with caution as the sample size for this question was small.
Both the 2022 parent survey and qualitative research from the same period found that awareness of the availability of funded ELC or how to apply was lower for two-year-olds than for children aged three-to-five.[16] In the 2025 parent research, there was a perceived lack of clarity on the eligibility criteria for two-year-olds in qualitative interviews.
5.2.2 Travel and other barriers to access
According to the SHS, a very small percentage of households (usually around 2% or 3% each year) have reported transport difficulties with accessing funded ELC since 2018.
In the 2017, 2022 and 2025 parent surveys, only a very small proportion (less than 5%) of respondents who were not accessing any or all of their funded ELC selected travel issues as a reason for this.
When respondents to the 2025 parent survey were asked about issues in accessing ELC in general, around three-fifths of respondents (61%) said they had not experienced any issues. The most common issue mentioned was that there were not enough places available locally or they couldn’t find any available providers near to them (19%). Only 6% said that their travel time to their preferred setting was too long, while public transport was not available for 5%. Those living in remote areas were more likely to say that there were ‘not enough places available locally or I couldn’t find any available providers near me’ (25%, compared with 19% living in accessible areas). Thompson et al., in the Rural and Islands Insights Report (2025) also note challenges with accessibility of childcare in rural areas.
The accompanying qualitative research with parents in 2025 suggested that choice of provider was largely determined by accessibility, including closeness to home or work, or through choosing a nursery attached to a sibling's school. When discussing challenges with accessibility, the availability of funded ELC placements was a central issue discussed. Some interview participants described not being able to access ELC close to home because there were no spaces available, while others reported a lack of choice of ELC settings locally.
5.2.3 Parents' experiences of funded ELC for children with ASN
In the 2025 ELC parent survey, of around the one-fifth of parents who had an eligible child with ASN, around two-thirds (65%) said they had no difficulties in finding funded ELC that meets their child’s ASN. This was consistent with 2022 (69%) and compared with 52% in 2017.
The difficulties most commonly reported in 2025 were: lack of information on support available to children with ASN and how to access it (14%), or on how settings support children with ASN (10%), and lack of confidence that staff have the time to meet children’s needs (13%). Respondents in households in which English was an additional language were more likely to report language barriers leading to communication difficulties (7%, compared with 2% for households with English as a first language).
5.3 Flexibility of funded ELC
Parents are generally satisfied with the flexibility of funded ELC. More settings are now operating outside of school hours or term time – although there is considerable variation between local authorities. Flexibility is an issue for a minority of parents in accessing their full ELC entitlement.
Flexibility is identified in the evaluation strategy as an important aspect of whether ELC is accessible and supports parents in work, training, or study.
Local authorities have a duty to provide funded ELC for all eligible children for at least 38 weeks per year. Families should be able to choose from a range of types of setting, offering different patterns of provision across their local area. It is not expected that all options will be available in all areas and settings – instead, this should reflect local demand and circumstances. Authorities must consult with local parents to ensure that funded ELC meets their needs. While this will not result in all families receiving exactly the funded ELC that they want, it should ensure there is a reasonable balance and mix of provision available locally so parents can access provision that works for their family.
To provide a rounded understanding of progress with provision of appropriately flexible funded ELC, both objective measures – e.g. whether specific aspects of flexibility are in place – and measures of parents’ experiences of flexibility are explored.
5.3.1 Provision of funded ELC outside school hours
Analysis of Care Inspectorate data show that the proportion of settings providing funded ELC outside school hours or during school holidays has increased from 50% of settings in 2016 to 64% in 2022, decreasing slightly to 63% in 2023 and 2024. This varied substantially by local authority area, however – from 33% to 98% in 2024. Patterns of provision will reflect local demand and circumstances. For example, research has found that lower numbers of children, limited capacity, and changes in demand are challenges for providing flexible ELC services in rural areas (Scottish Government, 2021b; 2022e; Thompson et al., 2025).
5.3.2 Provision of part-day, whole-day and flexible sessions
The proportion of funded ELC settings providing part-day only sessions has decreased substantially since 2016, from 48% to 3% in 2024, while the proportion providing full-day only sessions has increased from 1% to 26% over the same period. Meanwhile the proportion providing either part-day or whole-day sessions has increased from 51% in 2016 to 71% in 2024. The proportion of settings also offering shorter or flexible sessions increased from 12% to 28% over the same period.
Across the period 2016 to 2024, drop-in sessions were only available in a few funded ELC settings in a couple of local authorities, and the majority of funded ELC was available through planned sessions.
5.3.3 Parents' views and experiences of flexibility
Respondents to the SHS who use funded ELC are asked if they have any issues in using it. The proportion who selected issues with different aspects of flexibility in 2024 were low, overall (respondents could select multiple options so the proportions cannot be summed):
- 9% reported a lack of flexibility in the days or times offered.
- 7% reported a lack of provision in school holidays.
- 1% reported a lack of provision for their preferred type of provider (e.g. childminder versus nursery setting).
The proportion of households reporting lack of provision in the school holidays has decreased from 19% in 2018, although this change may be due to natural variation in opinions between years. The proportion reporting a lack of provision for their preferred type of provider has remained small (between 1% and 4% over the period 2018 to 2024).
In the 2025 parent survey, most parents were satisfied with the flexibility they had been offered to ‘use their funded hours in a way that met their family's needs’. Nine in ten (90%) of those with a three- to five-year-old and 95% of those with a two-year-old were satisfied, with 62% and 71% respectively very satisfied. These findings are similar to those from 2022 (this question was not asked pre-expansion in the 2017 parent research). Of the 11% of parents of three- to five-year-olds not using their full entitlement in 2025, 15% mentioned that they could not get the sessions that they wanted at their preferred setting. This compared to 23% in 2022. This was a particular issue for households living in accessible areas, compared with remote areas in 2025.
The 2025 qualitative research with parents found that the main reasons interview participants were satisfied with the flexibility of funded ELC were that the hours fitted well around their family life and/or their working or studying hours. Similarly, the main reasons other participants gave for being dissatisfied with flexibility were limited or no choice in the funded ELC providers they could use locally and hours being insufficient to fit in with work schedules.
5.4 Take-up of funded ELC
Overall take-up of funded ELC has remained consistently high for three- and four-year-olds. Take-up among eligible two-year-olds remains stable at a national level, with significant variation between authorities. Most children using funded ELC are using the full 1140 hours, although two-year-olds are less likely to do so than older children. While some parents choose not to take up any or all of the funded hours, accessibility and flexibility were barriers for a minority.
The logic model highlights that whether or not parents take up the additional available hours of funded ELC is a key short-term marker of successful implementation of the expansion. Take-up also provides an early indicator of the potential for positive outcomes to be achieved – through an increase in the amount of high quality ELC children are receiving. It is important to understand how take-up of funded ELC has changed with the expansion – both in terms of the overall proportion of eligible families using it, and whether families are using their full entitlement. It is also crucial to understand how the expansion has affected the overall mix and quantity of childcare families use (e.g. funded ELC, paid-for ELC and informal childcare) – this is explored in Section 5.5.
5.4.1 Overall take-up of funded ELC
The ELC Census provides the headline measure of take-up of funded ELC. Overall take-up of funded ELC among three- and four-year-olds has remained consistently high since before the expansion. In September 2025, it was estimated that almost all eligible three- and four-year-olds were registered for funded ELC.
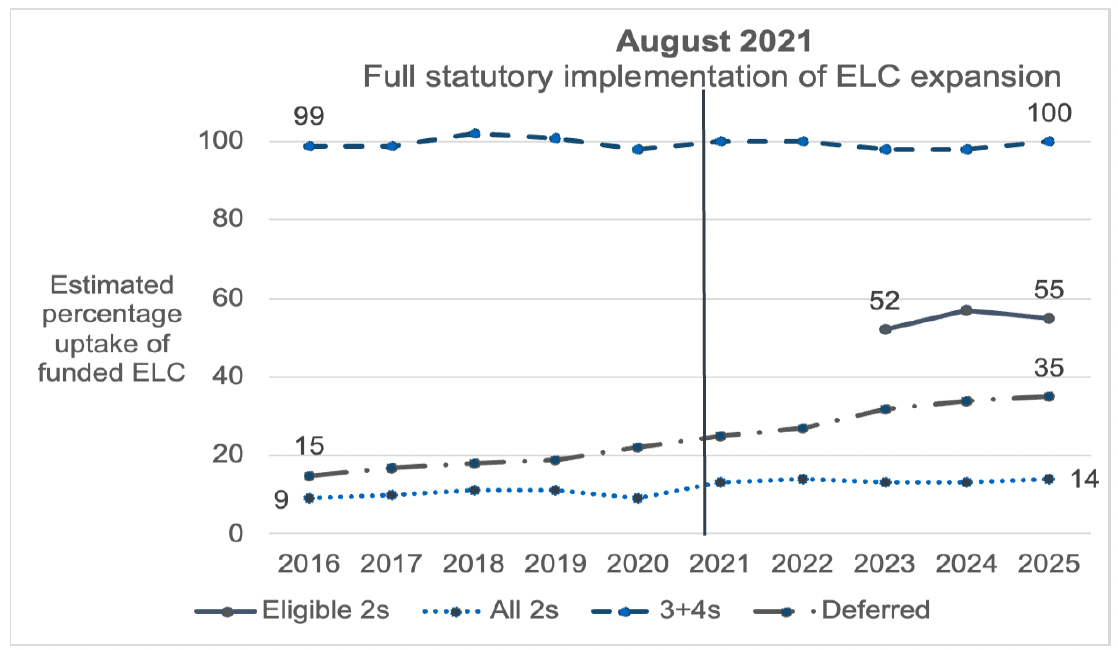
Source: Scottish Government Funded Early Learning and Childcare census
Take-up among all two-year-olds generally increased between 2016 and 2025, with the exception of a dip in 2020. An estimated 55% of those eligible were registered for funded ELC in 2025, which is approximately 14% of the total population of two-year-olds. The estimated take-up rate for eligible two-year-olds decreased from 57% in 2024, however, it remains higher than the rate in 2023 of 52% when take-up for eligible two-year-olds was first calculated. The Scottish Government is working with local authorities and the Improvement Service on a National Improvement Project to maximise take-up by eligible two-year-olds, with a focus on families most at risk of poverty and on areas with some of the lowest take-up rates.
The take-up of places for children whose entry to primary school has been deferred has consistently increased every year since 2016, to 35% in 2025. This may be, in part, the result of the expansion of the funded ELC offer to a wider range of children in this group, which was piloted in 10 local authorities from 2021 and implemented nationally from August 2023. The pandemic may also have influenced parents’ decisions about deferring school start.
Take-up rates for funded ELC vary by local authority. In particular, there was considerable local variation in the estimated take-up rates for eligible two-year-olds (ranging from 32% to 88% in 2025) and among those eligible for deferred entry (ranging from 23% to 71% in 2025).
In September 2025, 11% of children registered for funded ELC had a home language which was not English, Gaelic, Scots or British Sign Language, 2% of children were assessed/declared disabled, and 19% had ASN. All of these proportions have risen slightly since before the expansion (by between one and five percentage points).
5.4.2 Parents’ reasons for using and not using funded ELC
Among respondents to the 2025 parent survey, 95% of those with three- to five-year-olds were using funded ELC. The most common reasons these parents gave for using funded ELC were because they thought it would be good for their child’s development or learning and that it would help build their child’s independence or confidence, or so that they could work or look for work.
For parents of three- to five-year-olds who were not using funded ELC, the most common reasons given for this (excluding ‘other’ reasons) in 2025 were: that their child was too young, they wanted/were able to look after their child themselves most of the time, or they were not aware of the availability of funded ELC. The reasons parents of two-year-olds gave were similar but the number of respondents to this question was small.
Qualitative research with parents in 2021-22 and 2025 also found that there was less awareness about funded provision for two-year-olds compared to the universal offer for older children (Wilson-Smith et al., 2022; Biggs et al., 2025). First time parents and those who were new to their area often felt less well informed, and language barriers were a contributing factor for some families.
5.4.3 Take-up of 1140 hours
As noted in Section 3.3.2, without the planned new ELC Census there is no one, definitive source of data on the hours of funded ELC families are accessing. However, data from several different sources all indicate that the majority of children accessing funded ELC are now using their full 1140 hours.
Local authority ELC delivery data from the Improvement Service show that the proportion of children accessing funded ELC who used more than 600 hours increased from 87% (102,410 children) in April 2021 to 98% (116,271 children) in April 2025.[18] As described in Chapter 2, access to expanded hours was phased prior to the original date of August 2020 – and a majority of local authorities were able to implement expanded hours during 2020-21. This phasing can be seen in Figure 6, with 61% of all children accessing 1140 hours in August 2020 and then a sharp increase for statutory implementation in August 2021 (to 87% of all children).
In April 2025, 87% of children accessing funded ELC (103,996 children) were accessing 1140 hours, compared with 72% (84,606 children) in April 2021. A higher proportion of children aged three and over (not including deferrals) (88%) were reported to be accessing 1140 funded hours in April 2025, than two-year-olds (72%).
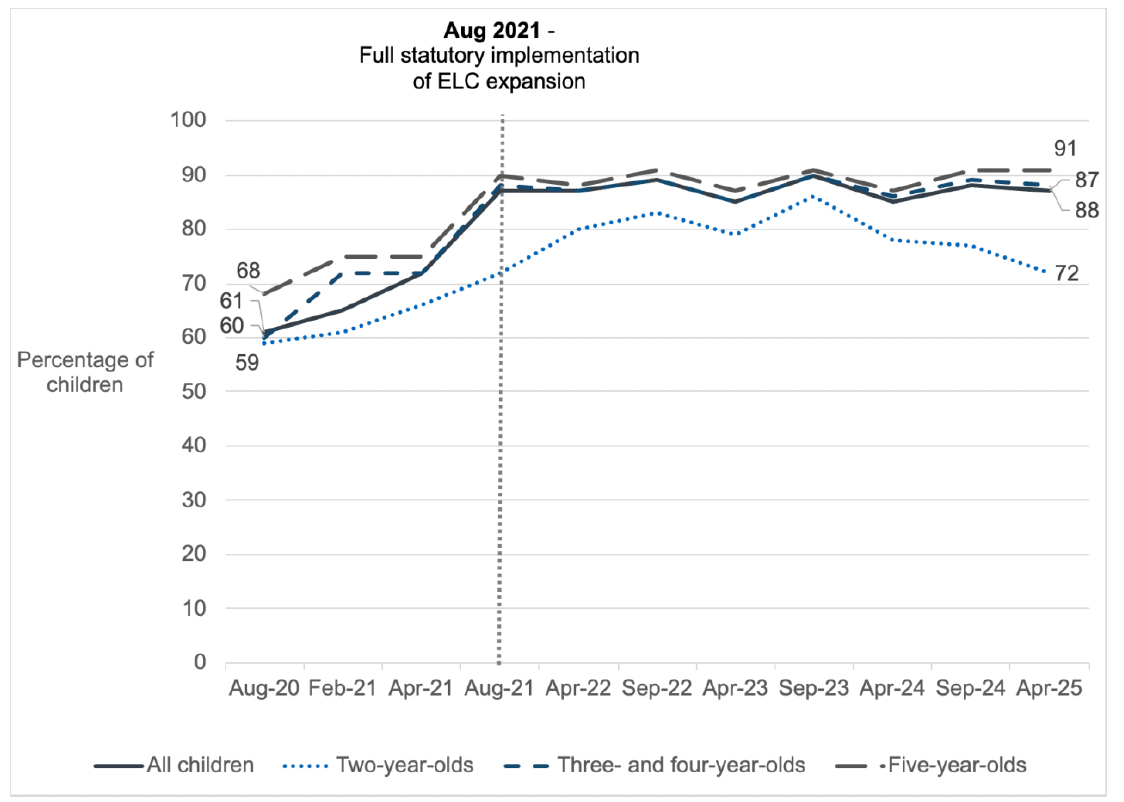
Source: Improvement Service Early Learning and Childcare Expansion Delivery Progress Reports
Note: Prior to April 2024, some local authorities did not include data for two-year-olds who were receiving funded ELC on a discretionary basis. Figures for previous years may represent a slight over-count of eligible 2-year-olds.
Among respondents to the 2025 parent survey, 87% of parents of three- to five-year-olds and 73% of parents of eligible two-year-olds said that they used their full entitlement. These figures were 73% and 52% respectively in 2022, suggesting an increase in parents using all their 1140 hours (Scottish Government, 2022d). In 2025, 11% of parents of three- to five-year-olds did not use their full entitlement and 2% said they don’t know, while in 2022 19% did not use their full entitlement and 8% said they don’t know. As noted in Chapter 3, however, the parent surveys were non-probability samples so may not be representative of the population. Households with a three- to five-year-old were more likely to use their full entitlement if they had a child with ASN or lived in accessible areas in 2025.
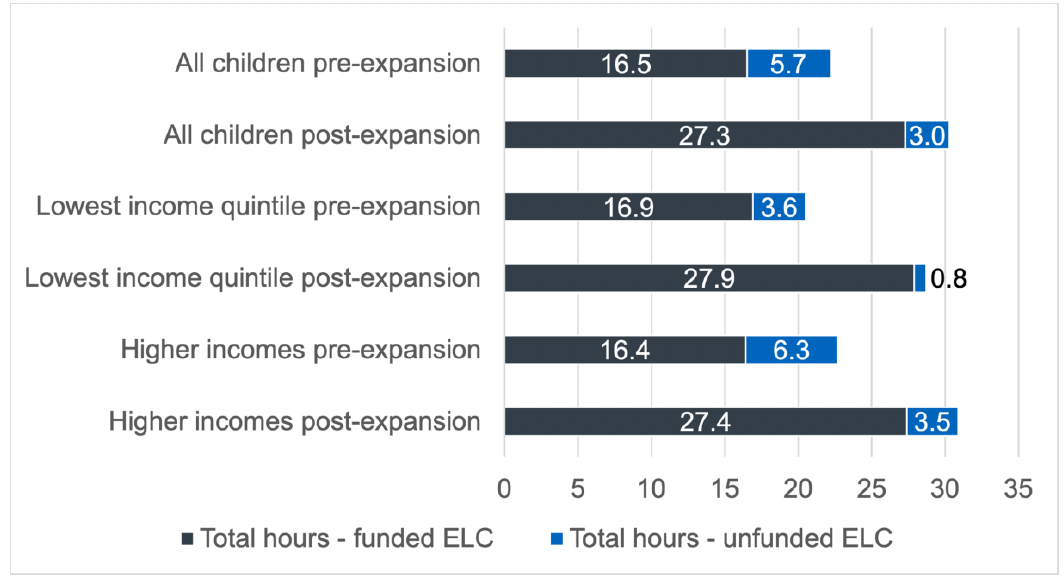
SSELC data show that four- and five-year-old children were spending an average of 27.3 hours per week in funded ELC post-expansion. This increased from 16.5 hours pre-expansion. See Section 5.5.1 for discussion of the extent to which this was offset by a reduction in unfunded hours. If used only in term time, 1140 hours equates to around 30 hours per week, or 22 hours across the year. (The weekly average includes both families using the hours across the whole year and in term time only.) There were no significant differences in funded hours used between those in low and higher income groups.
5.4.4 Reasons for not using the full 1140 hours
In the 2025 parent survey, most of the 11% of parents of three- to five-year-olds not using their full entitlement said that this was through choice – typically, they did not need (35%) or want (22%) childcare for so many hours or felt that children should not be in nursery for that long (27%). Some parents (15%) also reported not being able to get the days or hours they wanted at their preferred setting (see Section 5.3 on flexibility). The West Partnership evaluation of 1140 hours reported similar findings on parents not using the full entitlement.
Similarly, the 2021-22 and 2025 qualitative research with parents found that the main reasons that some participants did not use their full entitlement were: because they did not need or want their child in nursery for so many hours; because their ELC provider did not offer enough hours or days to enable them to use the full entitlement; because the hours offered by their provider did not fit around other commitments (e.g. other children’s schedules or parents’ working hours); or due to their child’s ASN (e.g. concerns about how their children would cope if they used longer hours).
5.5 Use of other ELC/childcare and affordability of ELC
Post-expansion funded ELC has replaced ELC some parents would have previously paid for themselves, particularly for high-income families. SSELC data show that the total formal ELC used for four- and five-year-old children increased by eight hours a week, on average post-expansion.
There are promising signs that the ELC expansion is helping many parents with the costs of ELC. Fewer eligible families are paying for additional ELC, although a substantial minority of those who do experience difficulties with affordability.
Families typically use of range of childcare to meet their needs, including informal childcare (i.e. friends or family), paid-for ELC and funded ELC. It is important to understand the mix of childcare used by families and how this has changed since the expansion of funded ELC hours. This helps to contextualise changes in the affordability of childcare for parents and to consider the extent to which funded ELC has replaced (or ‘displaced’) ELC that parents would have previously paid for themselves.
The intermediate outcome of affordability focuses on affordability for parents. The provision of funded ELC sits alongside wider UK government support with childcare costs that parents in Scotland may be entitled to, including childcare elements of Tax Credits and Universal Credit, and the Tax-Free Childcare scheme for working parents. Therefore, the expansion of funded ELC will likely be only one factor in the overall affordability of childcare.
Improved affordability should allow many families to access more hours of ELC than they would previously have been able to afford. For families who would have previously paid for additional hours (on top of the funded 600 hours), the expansion is expected to reduce the number of hours of ELC that they need to purchase. This would therefore improve affordability by reducing their overall ELC costs. The costs of childcare for other older or younger children who are not entitled to funded ELC is also important in relation to overall household costs but is not covered by this evaluation.
5.5.1 Profile of childcare used
Data collected in various surveys of parents (including the SSELC and ELC parent surveys) provide insight into use of other ELC and childcare.
The 2025 ELC parent survey found that almost all respondents (98%) to the survey used some form of childcare for their children under school age. This included funded ELC and was the same proportion as in 2022. The use of any childcare increased with the child’s age, from 63% for children under two years old, 91% for two-year-olds and 98% of three- to five-year-olds. Households with two parents in work were more likely to use paid-for ELC or informal childcare than those with one or no parents in work. Similarly, use of paid-for childcare and informal childcare increased with income.
Table 1 below shows the mix of types of childcare parents of three- to five-year-olds reported using in the 2017, 2022 and 2025 parent surveys.
| Types of childcare used | 2017 | 2022 | 2025 |
|---|---|---|---|
| Funded ELC only | 16% | 53% | 47% |
| Funded ELC + informal childcare | 21% | 23% | 17% |
| Funded ELC + paid-for ELC | 22% | 10% | 24% |
| Funded ELC + paid-for ELC + informal childcare | 32% | 9% | 7% |
| Other (paid-for / informal childcare only) | 7% | 4% | 4% |
| No childcare | 3% | 1% | 1% |
Source: Scottish Government, ELC parent surveys, 2017, 2022, 2025
This shows a large increase in the proportion using funded ELC only post-expansion (from 16% pre-expansion to around half post-expansion), although with a small decrease between 2022 and 2025. It also highlights a corresponding reduction in use of additional paid-for ELC from over half pre-expansion to just under a fifth in 2022, although this increased to 31% in 2025.
The mix of childcare used varied by income. In 2017, 29% of the lowest income households (less than £16,000 per annum) used funded ELC only and 28% also used additional paid-for ELC; while 7% of the highest income households (£60,000 and over per annum) used funded ELC only and 68% used additional paid-for childcare. In 2025, 83% of the lowest income households used funded ELC only and 7% also used additional paid-for ELC; while 34% of the highest income households used funded ELC only and 34% used additional paid-for ELC.
While the comparisons between years should be treated with caution, the parent survey data suggest that post-expansion, funded ELC has replaced ELC for which parents would have previously paid, for a sizeable minority of families, and particularly for high-income families.
Data from the SSELC also found that, with the expansion, there was a decrease in the proportion of families of four- and five-year-olds paying for additional ELC hours (28% paid for additional hours at the same setting that they received funded ELC in 2019 compared with 20% in 2024). There was also a decrease in the average number of additional hours paid for post-expansion (families of four- and five-year-olds who were paying for additional hours paid for a mean of 13.8 hours a week at the same setting at which they received funded ELC in 2019, compared with 10.1 hours a week in 2024).
The total amount of ELC (funded and unfunded) used by families of four- and five-year-olds increased by over a third, from an average of 22 hours a week pre-expansion to 30 hours a week post-expansion – an increase of approximately eight hours a week on average. The SSELC weekly average includes both families using funded ELC hours across the whole year and in term time only. This may underestimate the increase in overall ELC use as other data suggest a shift since the expansion to using more hours year-round or during school holidays (Scottish Government, 2025d). There was also a fall in the proportion of ELC used that was unfunded or paid-for, from 26% to 10%.
For both the lowest and the higher income groups, the increase in total hours was the same (eight hours a week), meaning that children in higher income households were receiving approximately two hours more ELC than children in lower income household, both pre- and post-expansion – see Figure 7. However, the proportion of ELC that was unfunded fell from 17% to 3% for those in the lowest-income quintile, compared with a fall from 28% to 11% for other children. This means that savings due to not spending on ELC were proportionally largest for the lowest income group.
Source: SSELC Final Report, Hinchliffe et al (2026)
Pre-expansion, 39% of families used some form of informal childcare for their four- or five-year-old, predominantly the child’s grandparents. Post-expansion this decreased to 30%. The mean hours of additional informal childcare did not change much among those who used informal childcare (14.5 hours a week pre-expansion and 12.5 post-expansion).
In total, the SSELC reported that four- and five-year-old children were spending an average of 34 hours per week in some form of childcare post-expansion. This is approximately six hours more than pre-expansion. It should be noted, however, that these figures mask a wide variation between families, with the majority using only funded hours, both pre- and post-expansion.
Overall, the data available suggest that a substantial minority of families (roughly around a quarter) were using funded ELC where they would have previously paid for ELC, particularly high-income households, following the expansion. For this group of children, we may not expect to see any change in child outcomes due to the expansion of funded ELC as there has been little change in the hours of ELC they experience. It is not possible from the data collected, however, to calculate precisely the extent to which the ELC expansion resulted in the Scottish Government funding ELC that would have been paid for privately in the absence of the expansion.
5.5.2 Whether families have (any) childcare costs
The Scottish Government estimates that, if families paid for their full ELC entitlement themselves, it would cost them more than £6,000 per eligible child per year.[19] Fewer families are paying for additional hours of childcare to meet their needs for children under school age since the ELC expansion.
In the 2024 SHS, 63% of households with a child aged two to five who was not yet at school said that they had no childcare costs for that child, or that all their childcare for that child was free or funded. This has remained at a similar level since 2022 and is an increase from 50% in 2018. This group includes households with two-year-olds not eligible for funded ELC, so this is a promising sign that fewer families are having to pay for extra childcare.
In the 2017 ELC parent survey, 60% of respondents said they paid for some of the ELC they use for their child(ren) under school age. The proportion who paid for some of their ELC decreased to 36% in 2022, however increased again to 47% in 2025. It is unclear why the trend is different between the SHS and parent survey between 2022 and 2025.
5.5.3 Experiences of difficulties affording childcare
Among the 47% of respondents to the 2025 parent survey with children under school age who paid for childcare, over half said they had not experienced difficulties affording their childcare costs for children below school age (56%). This is an increase from 34% in 2022 and 29% pre-expansion in 2017. In 2025, two-fifths of parents who paid for childcare had experienced some difficulties (32%), including 10% who had experienced significant difficulties. In 2022 16% had experienced significant difficulties, while in 2017 18% had. For parents of children aged three to five specifically, 65% had experienced no difficulties in 2025.
The primary reported difficulty in 2025 (for 87% of parents who experienced difficulties) was the overall cost, while around a quarter mentioned difficulty paying fees upfront. This was similar in 2022 and 2017.
5.6 Summary: intermediate outcomes
The logic model set out intermediate outcomes, or essential foundations, that would need to be in place to achieve the high-level outcomes for children, parents and families. Overall, the evidence considered in this chapter suggests that, for the most part, these foundations are in place. In general, the quality of funded ELC remains high. There have been improvements in the accessibility and flexibility of funded ELC and the overall affordability of ELC. Most children using funded ELC are using the full 1140 hours, and most parents report satisfaction with the funded ELC provision they are offered. However, there are issues to monitor in relation to maintaining high quality, sustainable provision, ensuring that all children with ASN can access funded ELC, and that there is sufficient choice and flexibility for parents across all local authorities.
Contact
Email: socialresearch@gov.scot