Economic condition of crofting: 2019 to 2022
This is a report to the Scottish Parliament as outlined in the terms of section 51 of the Crofting Reform (Scotland) Act 2010, reflecting the economic condition of crofting and the measures taken by the Scottish Ministers, the Crofting Commission and others to support crofting during 2019 to 2022.
Analysis of The Economic Condition of Crofting Survey 2019 – 2022
The Scottish Government recognises the contribution that crofting makes to the rural economy and rural communities, and is committed to securing the future of crofting. As part of this commitment to crofting, the Scottish Ministers are required (under Section 51 of the Crofting Reform (Scotland) Act 2010) to submit a report on the economic condition of crofting to the Scottish Parliament every four years. The last report covered the period 2015-2018, and was published in December 2018.
This report provides a detailed outline of the economic condition of crofting over the 2019-2022 period and builds on previous publications in 2014 and 2018. It also covers recent policy measures taken by Scottish Ministers, the Crofting Commission, and others, to assist the crofting sector, as well as measures planned for the future.
The majority of the information contained in part one of this report is taken from the results of a survey and report commissioned by the Scottish Government into the economic condition of crofting over the 2019-2022 reporting period. Broadly comparable with the previous surveys, the 2022 survey covered a wide range of social and economic issues such as the demographic composition of crofting households; activities on crofts; the employment status of crofters; the investments made and the income derived from crofts; and the outlook of crofting households. It also touched on crofters' views of support and information sources available to the crofting community, and the future of crofting more broadly. A new set of questions were included in the 2022 survey on the topics of peatland restoration, biodiversity activities, and forestry and woodland creation. The answers to these questions will provide a baseline figure on the activities, and will inform future work and help target support and information.
On behalf of the Scottish Government, Research Resource invited 4,000 crofters to participate in a survey via post, online or telephone during the summer of 2022. A total of 942 surveys were returned, giving a response rate of 24%. The 2018 survey received 739 responses, a response rate of 18%. In 2022, a digital first approach was used replacing the postal only approach used previously. In 2022, 49% responses were received by email, 42% were completed by post, 6% were submitted online, and 3% by telephone. The sample achieved is considered representative of the crofting population by local authority and tenure. The full report from that work, with explanations on how to interpret the data, is available on the Scottish Government website, and provides further detail of the methodology of the survey.
Key Findings
The data from the 2022 report can be broadly compared with data from the 2018 and 2014 reports, providing a picture of how crofting has changed over the last four to eight years.
Overall, crofting remains economically challenging, with a third of respondents making no income from crofting activities in the last twelve months. The majority of crofters agreed that crofting is not economically viable without household members supplementing their income from non-crofting activities.
The median combined income from both crofting and non-crofting activities, minus business running costs, was slightly higher than in 2018, and higher still than the median Scottish household income. Just under half of crofters received an income from grant money and support schemes.
More crofters plan to invest in the coming years, which has increased over the last eight years. Livestock was the most common area for investment, as with the 2018 results. Other positive changes in crofting include the proportion of crofters with a succession plan in place, which has continued to increase with each survey. In addition, the proportion of female crofters has continued to increase since 2014.
Crofting background and demographic information
- In general, crofters tend to be male, living in a two-person household and are aged over 55. However, the proportion of female crofters has continued to rise from 13% in 2014 and 26% in 2018, to 30% in 2022.
- Being brought up in a crofting family remains the most common reason for becoming a crofter. The proportion of respondents who have been crofting for 20 years or more has continued to decrease from 70% in 2014 and 65% in 2018, to 48% in 2022.
Income and Outgoings
- The proportion of crofters who received no revenue from crofting increased from 25% in 2018 to 38% in 2022. While the number of crofters receiving an income of £10,000 or less from crofting-based activities has remained the same as 2018 (53%), the number earning more than £10,000 has decreased. The average income was £4,538.
- Over the last 12 months, 43% of crofters received an income from grants or support schemes.
- Eighty-two percent of crofters reported either no running costs relating to their crofting-based activities or running costs of under £5,001. The average was £5,145, which is similar to 2018.
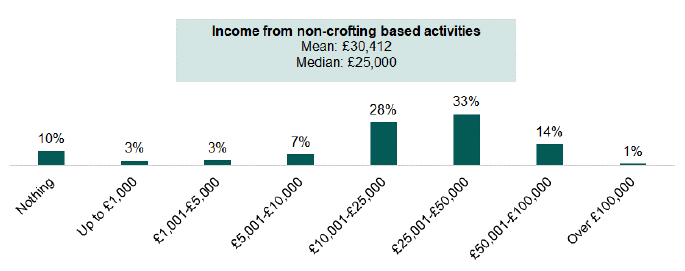
- In terms of income from non-crofting activities, 61% reported an income of between £10,001 and £50,000, in line with the 2018 survey (64%). The median household income reported from non-crofting activities was £25,000, the same as the 2018 survey results (£25,000). Only 19% said that they expected their non-crofting income and business running costs to decrease in the coming 12 months.
- The median combined income from both crofting and non-crofting activities, minus business running costs, was £29,810, a slight increase from 2018 (£29,000), and higher than the median Scottish household income of £27,716. The average household income from non-crofting activities was reported as £30,412. This compares favourably to the average household income for Remote Rural Scotland in 2021 which was £29,000.
- More crofters are paying rent or mortgages, which has increased from 57% in 2018 to 64% in 2022. The average mortgage cost on croft houses in the last 12 months was £8,374. Where crofters paid annual rent, 61% paid less than £51 in the last year. The average annual rent was reported as £133.95 and the median value was £32.
Croft Investment
- Although there has been a slight decrease in the number of crofters investing in their croft from 68% in 2018 to 61% in 2022, the number of crofters planning to invest in the future has increased from 48% in 2018 to 62% in 2022. One in ten of the crofters who had invested in their croft during the 2019-2022 period provided details of the additional income they received as a result of the investment. The average income has risen from £6,219 to over double at £13,035.
- Crofters were more likely to invest their own money (99.6%) than money received from grant or support schemes (39%), and crofters were more likely to invest in livestock (46%). The average amount invested from crofters' own money was £12,832 (£20,007 in 2018) and from public funding was £4,612 (£6,554 in 2018).
- Plans for investment in crofts have increased significantly since 2018 from 48% to 62% in 2022. Livestock was again the most common response in terms of the type of investment planned (52%), followed by crops (30%), and forestry and woodland creation (22%). The average planned investment figure was £6,503, down significantly from £16,450 in 2018.
- The most common reasons for not investing were that the financial cost or outlay of investing was too great (36%); no desire to do so (32%); and the uncertainty of the potential benefit of investing (29%). This is consistent with the reasons provided in 2014 and 2018.
- The proportion of crofters with a succession plan in place has continued to increase, from 46% in 2014 and 47% in 2018, to 60% in 2022.
- Most crofters were in agreement that crofting is not economically viable without household members supplementing their income from non-crofting activities (92%), consistent with the findings from 2018 (95%).
Sources of information on crofting
- Just under a third of crofters had looked for advice or support on crofting activities in the last 12 months (30% in 2022 and 33% in 2018). The 'Crofting Commission, Commissioner or local Crofting Commission Assessor' was the most popular source of advice and support that crofters would use, an increase from 50% in 2018 to 60% in 2022.
Peatland restoration, biodiversity activities, and forestry and woodland creation
- A new set of questions was added to the 2022 survey on peatland restoration, biodiversity activities and forestry and woodland creation.
- The survey found that 28% of crofters had undertaken one or more of these activities in the reporting period, with a further 34% planning to carry out these activities in 2023-2026.
- The most common activities that were carried out were biodiversity activities on the croft (12%), and woodland or forestry creation on the croft (18%). These were also the two activities most likely to be carried out in the next four years.
- One in four crofters have used available schemes to either restore peatland, carry out biodiversity activities, or create forestry or woodland.
- The most common obstacles to undertaking these activities were a lack of information (38%) and uncertainty of the potential benefit (37%).
Analysis of the Survey Findings
1. About Crofting Households / Background
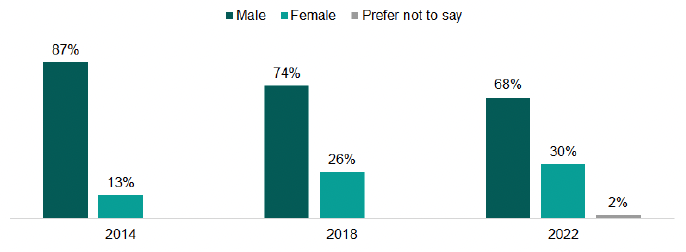
1.1. In line with the results from the 2014 and 2018 surveys, crofters were more likely to be male (68% in 2022) compared to the Scottish population[1] (49%). The proportion of female crofters has continued to increase from 13% in 2014 and 26% in 2018, to 30% in 2022. The 2021 Scottish Agricultural Census[2] shows that 40% of agricultural working occupiers are female.
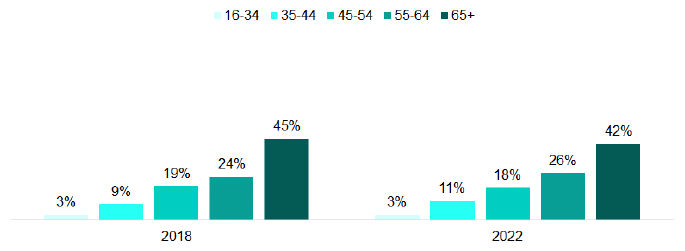
1.2. In terms of the age profile of respondents, 42% are aged 65 and over, while only 3% are aged under 35. The age profile of crofters does not vary significantly compared to the profiles from the 2014 and 2018 surveys.
1.3. It was more common for crofters to live in a two-person household (48%). 20% lived alone, 15% lived in a three-person household, 11% lived in a four-person household and 6% lived in a household with five or more people. These findings were consistent with the results from the 2018 survey where respondents were more likely to live in a two-person household (47%).
1.4. Respondents were asked a set of standard equalities questions in the survey. 18% of respondents said they had a physical or mental health condition or illness that was expected to last 12 months or more. In comparing crofters health to that of the general Scottish population (24%)[3], crofters appear healthier. Most crofters said they belonged to the Church of Scotland (42%). The majority (90%) of crofters identified as being heterosexual. The majority of crofters said they were of white ethnic origin (90%) and of these individuals, 84% said they were 'White Scottish' and a further 14% said they were 'White other British'.
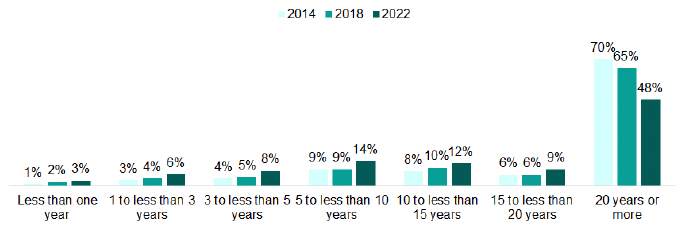
1.5. Although most crofters have been crofting for 20 years or more, the proportion of these respondents has decreased (70% in 2014 and 65% in 2018, to 48% in 2022). However, the proportion of respondents who have been crofting for less than five years has increased (8% in 2014 and 11% in 2018, to 17% in 2022).
1.6. Of those who sublet a croft or had a short-term lease, most said that their lease was for one year or less (40%) and only 1% said that it was for more than ten years. A further 7% of respondents said they had a seasonal let or a let for summer grazing, and 3% said they had an unofficial sublet.
1.7. Where respondents operated crofts as a tenant crofter, the number of crofts they currently operate ranged between one and ten crofts with an average of 1.41 crofts. Where crofts were owner occupied, the number of crofts they currently operate again ranged between one and ten crofts, with an average of 1.36. Those crofters that also identified as being a landlord of a croft, were the landlord of between one and four crofts, with an average of 1.31. For those who operated crofts as a sublet or short lease, the number of crofts they currently operate ranged from between one and six crofts with an average of 1.85 crofts.
2. Crofting Activities
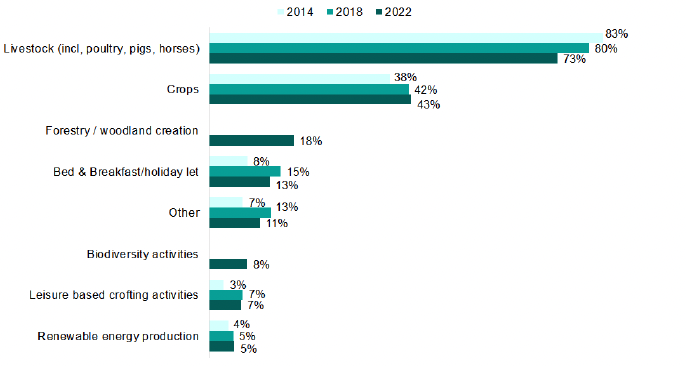
2.1. Raising livestock was by far the most common crofting activity undertaken by respondents in 2022 (73%), which was also the case in 2018 (80%) and in 2014 (83%), although the proportion of crofters doing so has continued to decrease in each reporting period. A further 43% grew crops on their croft (42% in 2018 and 38% in 2014). Several new activities were added to the 2022 questionnaire. These included peatland restoration (1%), biodiversity activities (8%), and forestry and woodland creation (18%). Raising livestock, growing crops and forestry and woodland creation remained the top three most common activities for respondents regardless of how long they had been a registered crofter.
2.2. The most notable differences in crofting activity by local authority were for bed and breakfast or holiday lets with, for example, 21% of crofters in Argyll and Bute carrying out this activity compared to just 2% of crofters in the Shetland Islands. Renewable energy activities were more common in the Orkney Islands (22%) than in all other local authority areas (between 3% and 6% for all other areas).
2.3. Females were more likely to run bed and breakfast or holiday let facilities (16%) than males (11%), and males were more likely to raise livestock (77%) than females (65%).
2.4. Crofters aged 55-64 were more likely to be involved in bed and breakfast or holiday let facilities (17%). Raising livestock was more common amongst crofters aged 16-44 (83%) and aged 45-54 (85%). Forestry and woodland creation was more likely to be undertaken by crofters aged 55-64 (21%).
2.5. Crofters were asked what proportion of their time each activity took. Raising livestock (with an average percentage of time of 75%), followed by bed and breakfast and holiday lets (with an average percentage of 53%) were the most time consuming.
2.6. Respondents were asked about the working activities of the adults in the crofting household. The most common response was from those actively working on the croft and working in paid employment outside crofting. The number of adults who actively worked on the croft ranged between one and five with an average of 1.68. The number of adults who worked in paid employment outside of crofting ranged from one to seven with an average of 1.79.
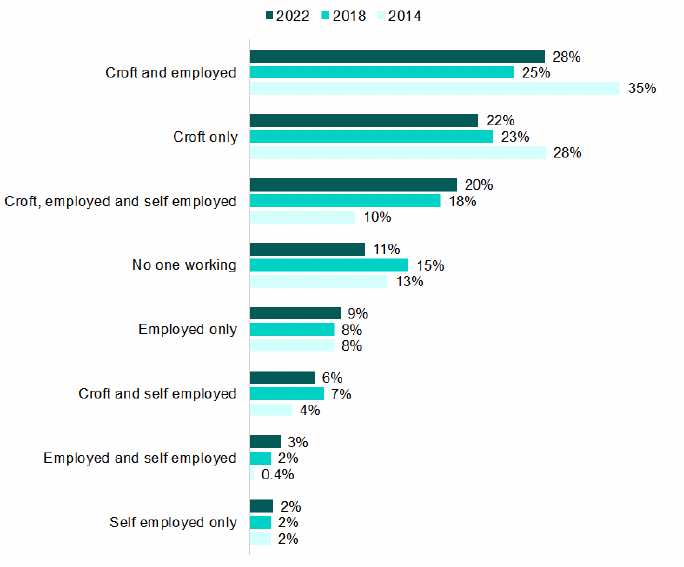
2.7. It was more common for at least one resident to work in employment outside of crofting, and this has continued to increase over the years (59% in 2014 and 62% in 2018, to 68% in 2022). Just over one in ten said that no one within their household was working in crofting activities, or elsewhere. Just under a quarter (22%) of crofters worked on crofting exclusively, consistent with the 2018 survey (23%).
2.8. Crofting households where at least one person actively worked on a croft, spent an average of 14 hours per week engaged in crofting activities, a decrease compared with 2018 (average of 22 hours per week crofting). The average number of hours for 2022 is consistent with the result from the 2014 survey (12 hours).
2.9. Where there was at least one household member who worked on non-crofting paid activities, an average of 32 hours was spent on these (a decrease from 40 hours in 2018 and 49 hours in 2014).
3. Income And Outgoings
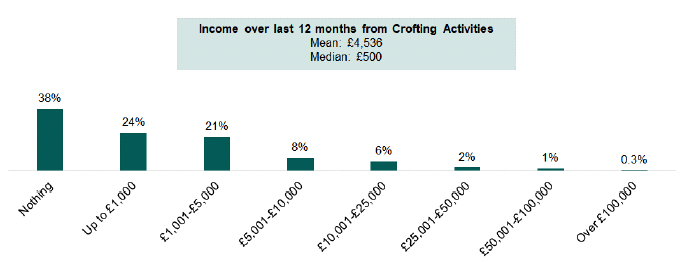
3.1. Crofters were asked to approximate their income from crofting-based activities in the last 12 months, including any income from grant money or support schemes and before deducting costs. As seen in figure 3.1, 38% made no income (25% in 2018), 44% made up to £5,000 (42% in 2018), 14% made between £5,001 and £25,000 (24% in 2018) and 4% made over £25,000 (6% in 2018). The average income reported was £4,538 (£13,095 in 2018).
3.2. The number of crofters receiving an income of £10,000 or less from crofting-based activities has remained the same as 2018 (53%).
3.3. Those who had been crofting between 10 and 20 years (average income of £7,795) and 20 years or more (average income of £4,260), had higher income levels than those who were newer to crofting (average income of £1,976 for those crofting for less than three years). The median value increases with length of time crofting from £0 for those who have been registered crofters for less than three years to £800 for those who have been crofting for 20 years or more.
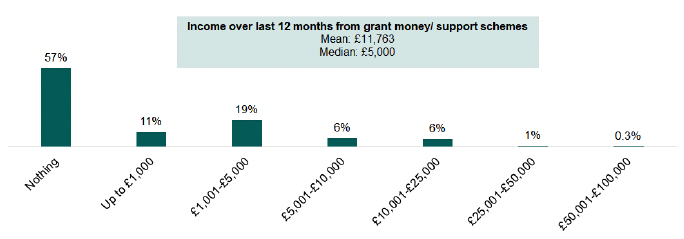
3.4. Over the last 12 months, 43% of crofters received an income from grants or support schemes. Just under a third (30%) had received up to £5,000 and 13% had received over £5,000. Those who had been crofting for the least amount of time (less than three years) were more likely to have received public funding (81%).
3.5. The average and median values have been calculated only for those who have received income from grant money or support schemes. The average value has been calculated as £11,763 and the median is £5,000. This was a new question in the 2022 survey.
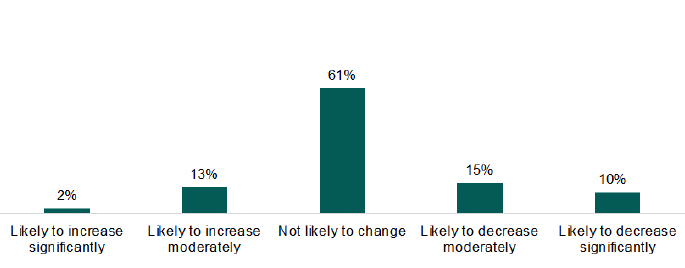
3.6. The majority of respondents felt their income position was not likely to change in the next 12 months (61%). This is less than was reported in 2018 (81%) and not significantly different from the 2014 survey (63%). More respondents were of the opinion their income was likely to decrease (25%) than increase (15%). The proportion of respondents expecting an increase in income is more than the 2018 survey (6%) and similar to the 2014 survey (14%). Those expecting a decrease in income has increased from 12% in 2018 and 22% in 2014.
3.7. Crofters were asked the reasons for their anticipated changes to their income position. The top response was regarding rising costs such as feed, transport, electricity, and materials (25%). One in ten respondents said they saw no change in their income position and a further 9% said their crofting activities do not generate a profit or income. A further 9% said their income would be dependent on funding and 9% said retirement or ill health may have an impact on their income from crofting activities.
4. Business Running Costs And Household Income
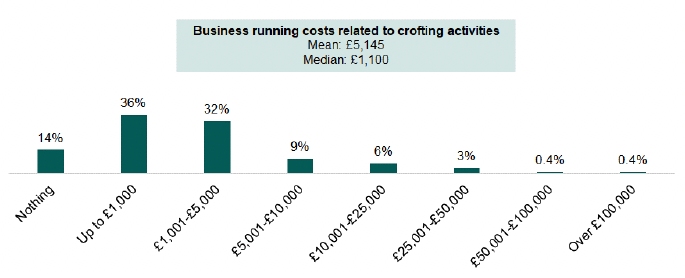
4.1. The majority of crofters reported no running costs relating to their crofting-based activities or running costs of under £5,001 (82%), which is higher than was reported in the 2018 survey (73%). The average was £5,145 which is down from £8,385 in 2018.
4.2. Crofters were also asked about their total household income from all non-crofting activities in the last 12 months, including all sources of paid employment, pensions, benefits and interest on bank deposits and investments.
4.3. For 2022, 10% of respondents reported no income from non-crofting based activities (6% in 2018). The majority of respondents (62%) reported their non-crofting income as between £10,001 and £50,000 (64% in 2018), and 15% said it was over £50,000 (16% in 2018). Of the respondents, 7% said their income was up to £5,000 (7% in 2018) and 7% said it was between £5,001 and £10,000 (7% in 2018).
4.4. The median household income reported from non-crofting activities was £25,000, which is the same as in 2018, and slightly higher than the 2014 figure of £21,000. Despite the spread of income being similar, the average value was reported as £30,412, less than the £41,760 reported in 2018. Crofters in Orkney received an income from non-crofting activities of over £100,000. It should be noted that the proportion of respondents who had a household income from non-crofting activities of over £100,000 has decreased from 5% in 2018 to 1% in 2022, which may explain the reduction in the average income for 2022.
4.5. The median combined revenue from both crofting and non-crofting activities, minus business running costs was £29,810, higher than the result from 2018 survey (£29,000), and the median Scottish household income of £27,716[4].
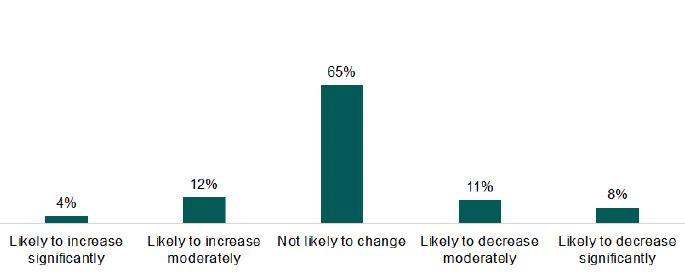
4.6. The majority of respondents said their non-crofting income and business running costs were not likely to change in the next 12 months (65%), 16% said it was likely to increase and 19% said it was likely to decrease. The main reasons given for any changes were due to pension funds or retirement (23%), rising costs and inflation (22%) and career progression or promotion (8%).
5. Rent/ Mortgage Costs And Rent Reviews
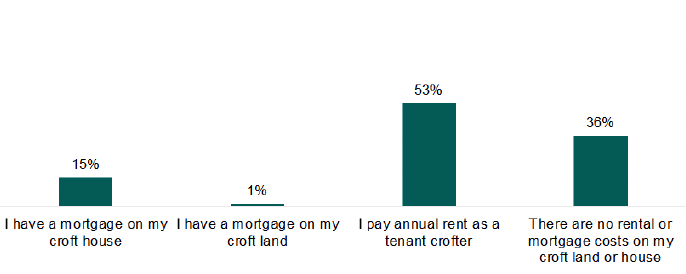
5.1. When asked about rent or mortgage costs for both croft land or housing, 64% of respondents (57% in 2018) reported having rental or mortgage costs, (to note, respondents could select both mortgage and rent as options). Among those who did, it was more common for respondents to pay annual rent as a tenant crofter (53%).
5.2. Those who had rental or mortgage costs were asked what their costs for housing were in the last 12 months. Just under half said their mortgage costs were between £5,001 and £10,000 (46%), 38% said they were under £5,001 and 15% said they were over £10,000. The average value was calculated at £8,374 and a median of £6,000. No comparison has been made to this question as the 2018 survey combined mortgage and rent costs in the one question whereas they have been separated in the 2022 survey. Five crofters said they had a mortgage on croft land.
5.3. Of those crofters who paid annual rent, 61% said they paid less than £51 in the last year, 25% paid between £51 and £100, and 14% paid over £100 per year. The average annual rent was reported as £133.95 and the median value was £32.
5.4. Of those who pay annual rent, 76% said their rent is reviewed, with over one in four respondents (27%) stating this is done annually. This question has not been compared to the 2018 survey due to changes to the wording of the question and the options provided.
6. Investments In Crofts And Looking To The Future
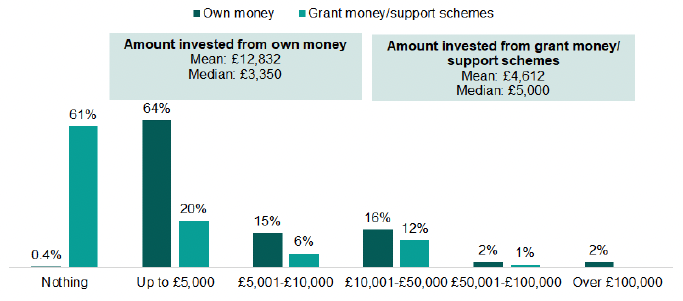
6.1. In terms of investment from crofters' own money, the median figure was £3,350 (£5,000 in 2018), and the average was £12,832 (£20,007 in 2018), as shown in figure 6.1. The majority had invested up to £5,000 (64%) of their own money with an additional 15% investing between £5,001 and £10,000 and 21% investing over £10,000.
6.2. Just over a third (39%) of crofters had invested money from grant money or support schemes in the last three years, an increase from 24% in 2018. The median amount invested from public funding was £5,000 (£1,000 in 2018), while the average investment was £4,612 (£6,554 in 2018).
6.3. Just under half (46%) said the money was invested in livestock, 27% said it was for fencing or gates, 24% said it was for crops, and 15% said it was for forestry or woodland creation.
6.4. Nineteen crofters (2%) said they had used a secured loan for their investment and 15 crofters (2%) said they had used an unsecured loan. With regard to secured loans the average was £12,705 and for unsecured loans the average amount received was £23,213.
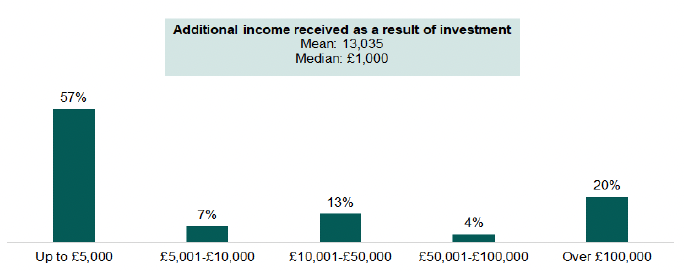
6.5. One in ten crofters who invested in their croft during the 2019-2022 period provided details of the additional income they received as a result of the investment. This is less than in the 2018 survey where 16% reported that they had received additional income. The average income has risen from £6,219 in 2018, to over double at £13,035 in 2022.
6.6. The majority of respondents did not anticipate there being any change in their income as a result of the investment made to their croft, while 17% said it was likely to increase (12% in 2018) and 11% said it was likely to decrease (4% in 2018).
6.7. When asked to provide their reasons for any anticipated change in their income from investment, 14% said that the improvements made were not to make profit and that they were, for example, to make processes easier, and carry out repairs or improving the ground. A further 11% mentioned rising costs, and 10% said that increased productivity would mean a change to their income in the next 12 months.
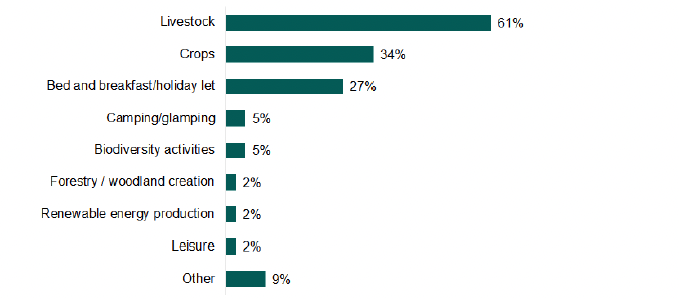
6.8. Livestock (61%) was the greatest contributor to additional income, which was also the case in the 2018 survey (63%). This was followed by crops (34%) and bed and breakfast and holiday lets (27%).
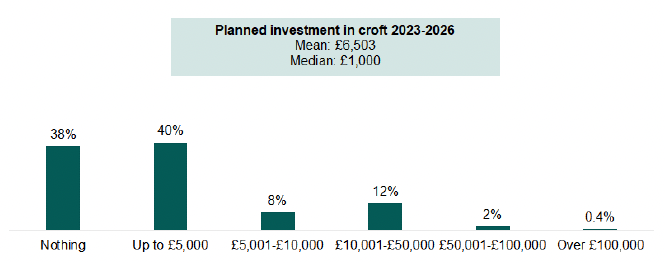
6.9. Crofters were asked about their planned investment for 2023-26. The number of crofters planning to invest in the future has increased from 48% in 2018 to 62% in 2022. The median planned investment was £1,000, down from £2,000 in 2018, and the average figure was £6,503, down from £16,450 in 2018 and £9,100 in 2014.
6.10. At 52%, livestock was the most common response when asked about how crofters plan to invest between 2023-26, followed by crops (30%) and forestry or woodland creation (22%). In 2018 the three most common responses were livestock (57%), crops (28%) and bed and breakfast / holiday let (16%).
6.11. Planning to invest in livestock was more common in crofters aged 16-44 (65%) and 45-54 (63%), than those aged 55-64 (46%) and 65 and over (40%). Crofters aged 65 and over were the least likely to plan to invest in camping or glamping facilities (2%). The nature of the planned investment does not vary significantly by gender.
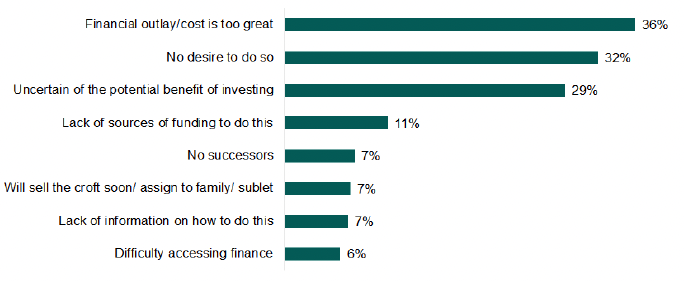
6.12. Just under 36% of respondents did not plan on investing in their croft during 2023-2026. The most common reasons were that crofters believed the financial outlay or cost would be too great (36%); they had no desire to do so (32%); or they were uncertain of the potential benefit of investing (29%). These were also the top three reasons cited in 2018.
6.13. Crofters aged 65 and over were the most likely to have no desire to invest in their croft (40%), while those aged 55-64 were more likely to say the financial outlay or cost prevents them from investing in their croft. Crofters aged 16-44 were more likely to say that a lack of sources of funding prevents them from being able to plan any investment (29%). A lack of information was cited by significantly more crofters aged 55-64 (21%) than those aged 65 and over (5%).
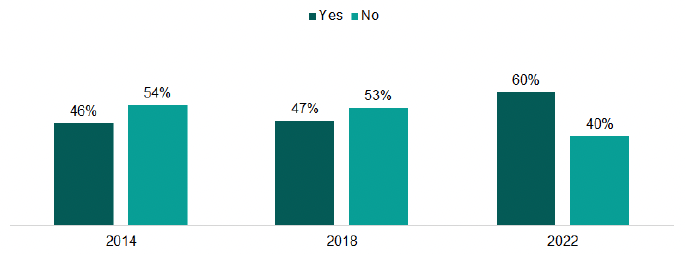
6.14. As illustrated in figure 6.6, the proportion of crofters with a succession plan in place has continued to increase with each survey, from 46% in 2014 and 47% in 2018, to 60% in 2022. Of those who had been crofting for 20 years or more, 71% reported to have a succession plan in place, compared to 44% of crofters who had been crofting for less than three years.
6.15. Of those who did not have a succession plan in place the most common reason was that respondents did not have a potential successor (33%). This was followed by those whose children or successors were not interested in crofting, and those that had no interest in making a succession plan, both of which came in at 18%.
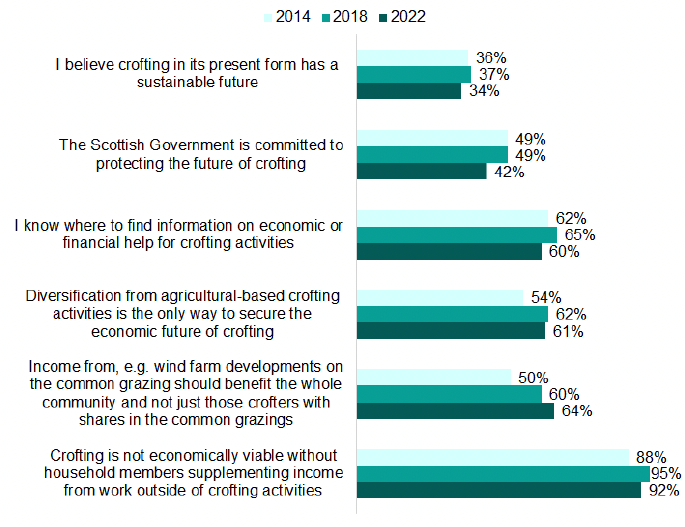
6.16. Crofters were asked to consider the extent to which they agreed or disagreed with a number of statements about the longer-term outlook and future role of crofting in Scotland.
6.17. Almost all crofters were in agreement that crofting is not economically viable without household members supplementing their income from work outside of crofting activities (92%), which is consistent with the 2018 (95%) and 2014 results (88%).
6.18. There is an increase in the number of respondents who agreed that income from, for example, wind farm developments on the common grazing, should benefit the whole community - from 50% in 2014 and 60% in 2018, to 64% in 2022. The majority (61%) of crofters expressed the view that it was necessary for crofting to continue to diversify from agricultural-based activities in order to secure its economic future, which is consistent with the 2018 survey. Furthermore, 60% of crofters know where to find information on economic or financial help for crofting (65% in 2018 and 62% in 2014).
6.19. Analysis by age reveals that respondents aged 65 and over were more likely to agree that the Scottish Government is committed to protecting the future of crofting (46%), compared to those aged 45-54 (35%). Furthermore, 63% of respondents aged 65 and over and 64% of respondents aged 55-64 were in agreement that diversification from agricultural-based crofting activities is the only way to secure the economic future of crofting, compared to 52% of respondents aged 45-54.
6.20. The level of agreement does not vary significantly by age with the exception of knowing where to find information on economic or financial help for crofting activities, where those aged 65 and over were more likely to agree (76%).
6.21. Crofters were given the opportunity to make any further comments regarding their croft or the future of crofting in Scotland. One in five took the opportunity to do so. The most common themes mentioned by crofters were:
- A perceived lack of financial support available to crofters (19%);
- A perception that crofting is dying out and that more needs to be done to encourage crofting (15%);
- Succession plans (10%);
- More support needed from the Crofting Commission to support crofters (7%); and
- More needing done to attract younger people to crofting (7%).
7. Sources of Information on Crofting
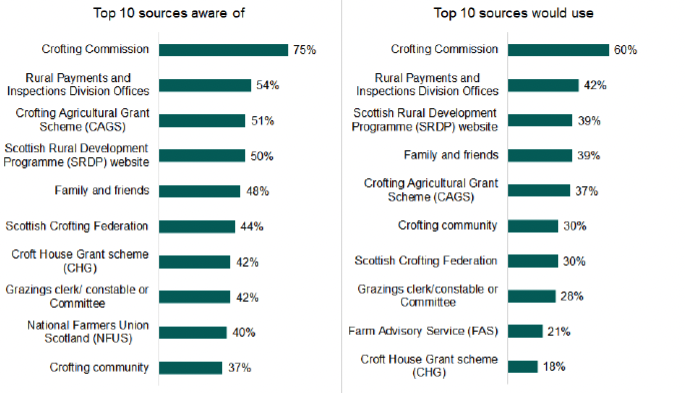
7.1. The majority of respondents were aware of the Crofting Commission, Commissioner or local Crofting Commission Assessor (75%) as sources of support. Those who had been crofting for over 20 years were twice as likely (23%) to be aware of the Crofting Cattle Improvement Scheme than those who had been crofting for less than three years (10%). The general awareness of support sources decreased with age, for example, 63% of crofters aged 16-44 were aware of the Crofting Agricultural Grant Scheme (CAGS) compared to 41% of crofters aged 65 and over.
7.2. In terms of the sources that crofters would use for advice and support on crofting activities, the Crofting Commission, Commissioner or local Crofting Commission Assessor was the top response (60%), followed by Rural Payments and Inspections Division offices (42%), the Scottish Rural Development Programme website (39%) or family and friends (39%). Those who had been crofting for less than three years were more likely to use all sources of advice and support. Generally, respondents aged 65 and over were less likely to use sources of advice and support. Those who were newer to crofting were more likely to have looked for advice and support (51%).
7.3. Almost a third (30%) of crofters had looked for advice or support on crofting activities in the last 12 months, which is consistent with the 2018 report (33%).
7.4. Respondents were asked to select from a list of options what they would like to see on the Farm Advisory Service website. An advice line was the most popular response (34%), followed by technical notes (28%) and videos (28%). Just under half of crofters (47%) said they would be unlikely to look at this website.
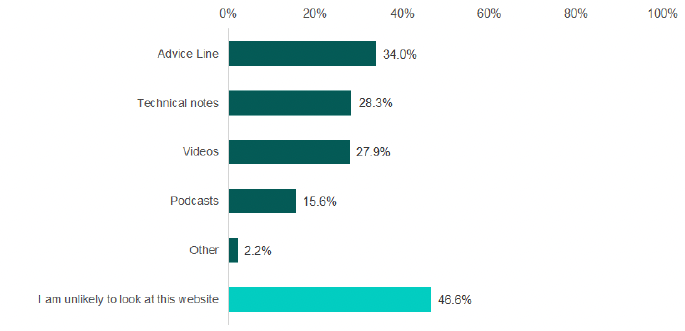
7.5. Respondents aged 65 and over were more likely to say they would be unlikely to look at the FAS website (61%). Podcasts (26%) were more popular with those aged under 45 (26%).
8. Peatland Restoration, Biodiversity and Forestry or Woodland Creation
8.1. A new set of questions were included in the 2022 survey on the topics of peatland restoration, biodiversity activities and forestry and woodland creation. This is in order to create a baseline figure on these activities, inform future work, and help target support and information. Crofters were asked if they had undertaken any of these activities between 2019-22 and whether they intended to carry out these activities between 2023-26.
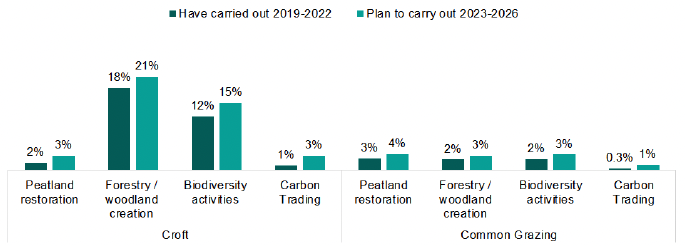
8.2. Just over a quarter (28%) of respondents had carried out these activities in the 2019-22 period and 34% plan to carry out these activities in the period 2023-26. Where these activities were carried out, the most common types of activities were biodiversity activities on the croft (12%), and woodland or forestry creation on the croft (18%). These were also the most popular types of activities to be carried out in 2023-2026.
8.3. Forestry and woodland creation have been carried out by significantly more crofters who have been crofting between three and ten years (25%). These crofters were also more likely to have undertaken biodiversity activities on their croft. Younger crofters were more likely than all other age groups to have said they have undertaken at least one of these activities (48%).
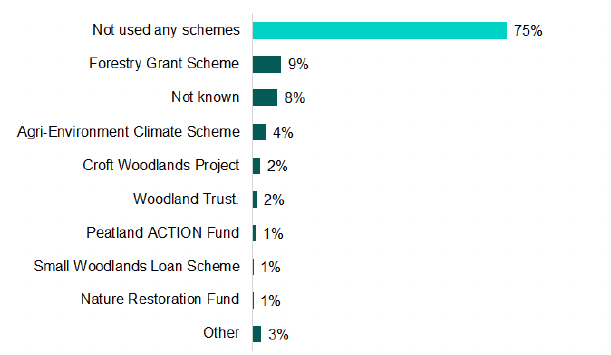
8.4. Respondents were asked to identify any schemes, if any, they had used to either restore peatland, carry out biodiversity activities, or create forestry or woodland. The majority (75%) had not used any schemes. Where respondents had used schemes, the most popular responses were the Forestry Grant Scheme (9%) and the Agri-Environment Climate Scheme (4%).
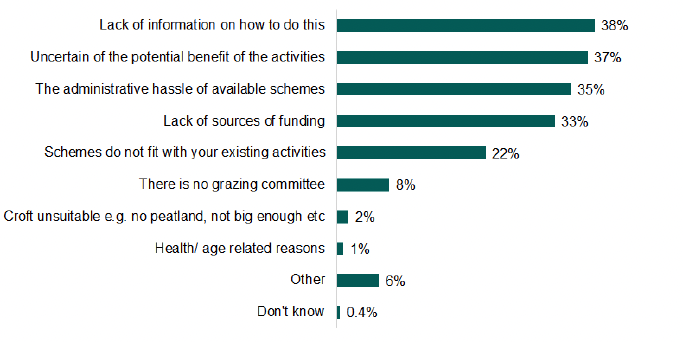
8.5. The most common obstacles preventing crofters from undertaking these types of activities on their croft or common grazing is a lack of information on how to do this (38%), followed by the uncertainty of the potential benefit of the activities (37%), the administrative hassle of available schemes (35%), and a lack of sources of funding (33%).
9. Conclusions
9.1. Overall, this report reflects a varied position for crofting, in terms of investment, income and outgoings, and crofting activities.
9.2. In addition to traditional agricultural activities, crofts are used for a variety of other activities such as growing trees, bed and breakfast and holiday let accommodation, and renewable energy production. After the more traditional activities of raising livestock and growing crops, diversified activities such as woodland and forestry creation, and owning bed and breakfasts and holiday lets are becoming more common.
9.3. The results of the survey show that the majority of crofters work away from the croft on non-crofting activities, in addition to their crofting activities. The majority of crofters agreed that crofting is not economically viable without household members supplementing income from non-crofting activities.
9.4. The number of female crofters has continued to increase, and new activities such as forestry and woodland creation, biodiversity activities, glamping and camping, and peatland restoration were all noted in 2022, and these activities are more likely to be carried out by younger crofters. The proportion of crofters who have a succession plan in place is also continuing to rise. There is also an increase in the number of crofters planning to invest on their croft in the next four years.
Contact
Email: Aileen.Rore@gov.scot