Developing essential fish habitat maps: report
The project helped define areas of the sea essential to fish for spawning, breeding, feeding, or growth to maturity. Twenty-nine species and multiple life-stages were reviewed covering marine fish and shellfish of commercial and ecological importance, relevant to offshore wind development areas.
Appendix A. Project methodological protocol (diagrams)
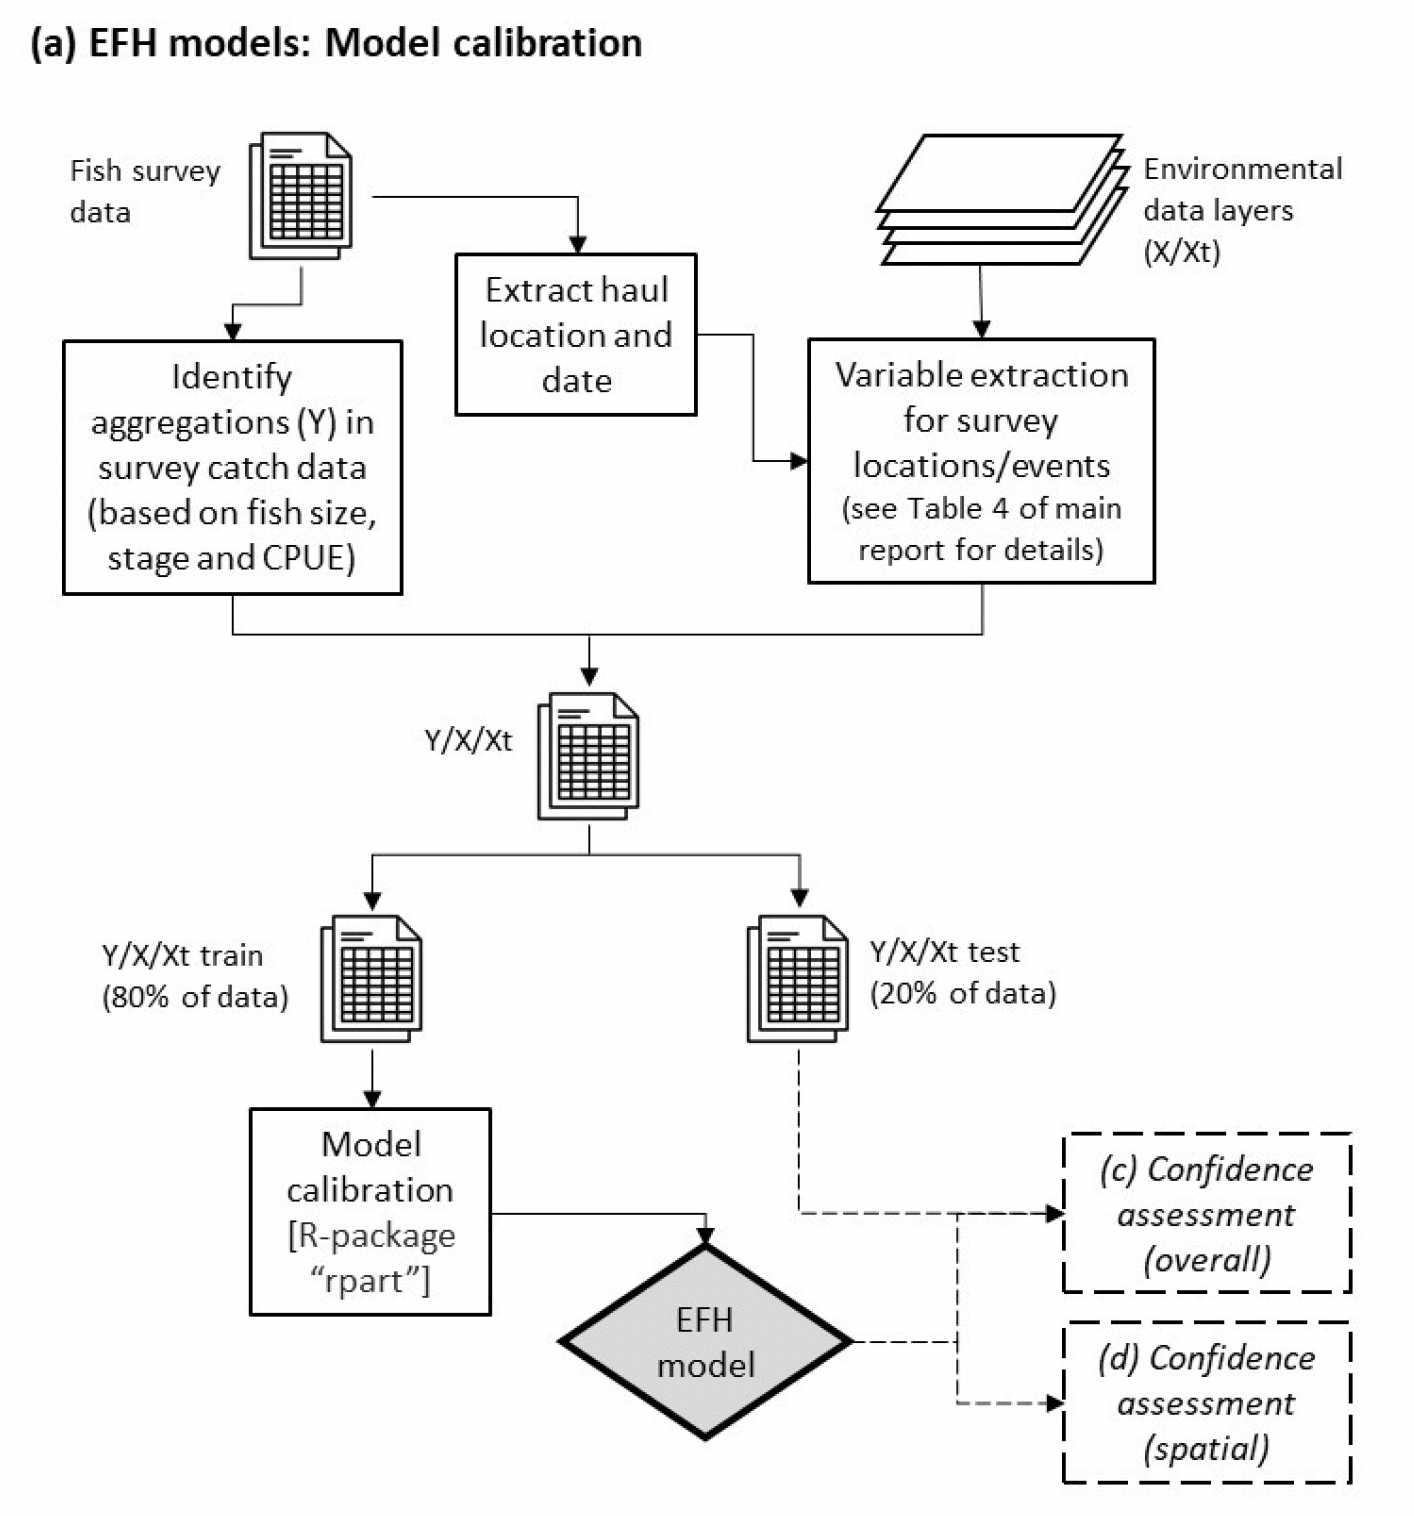
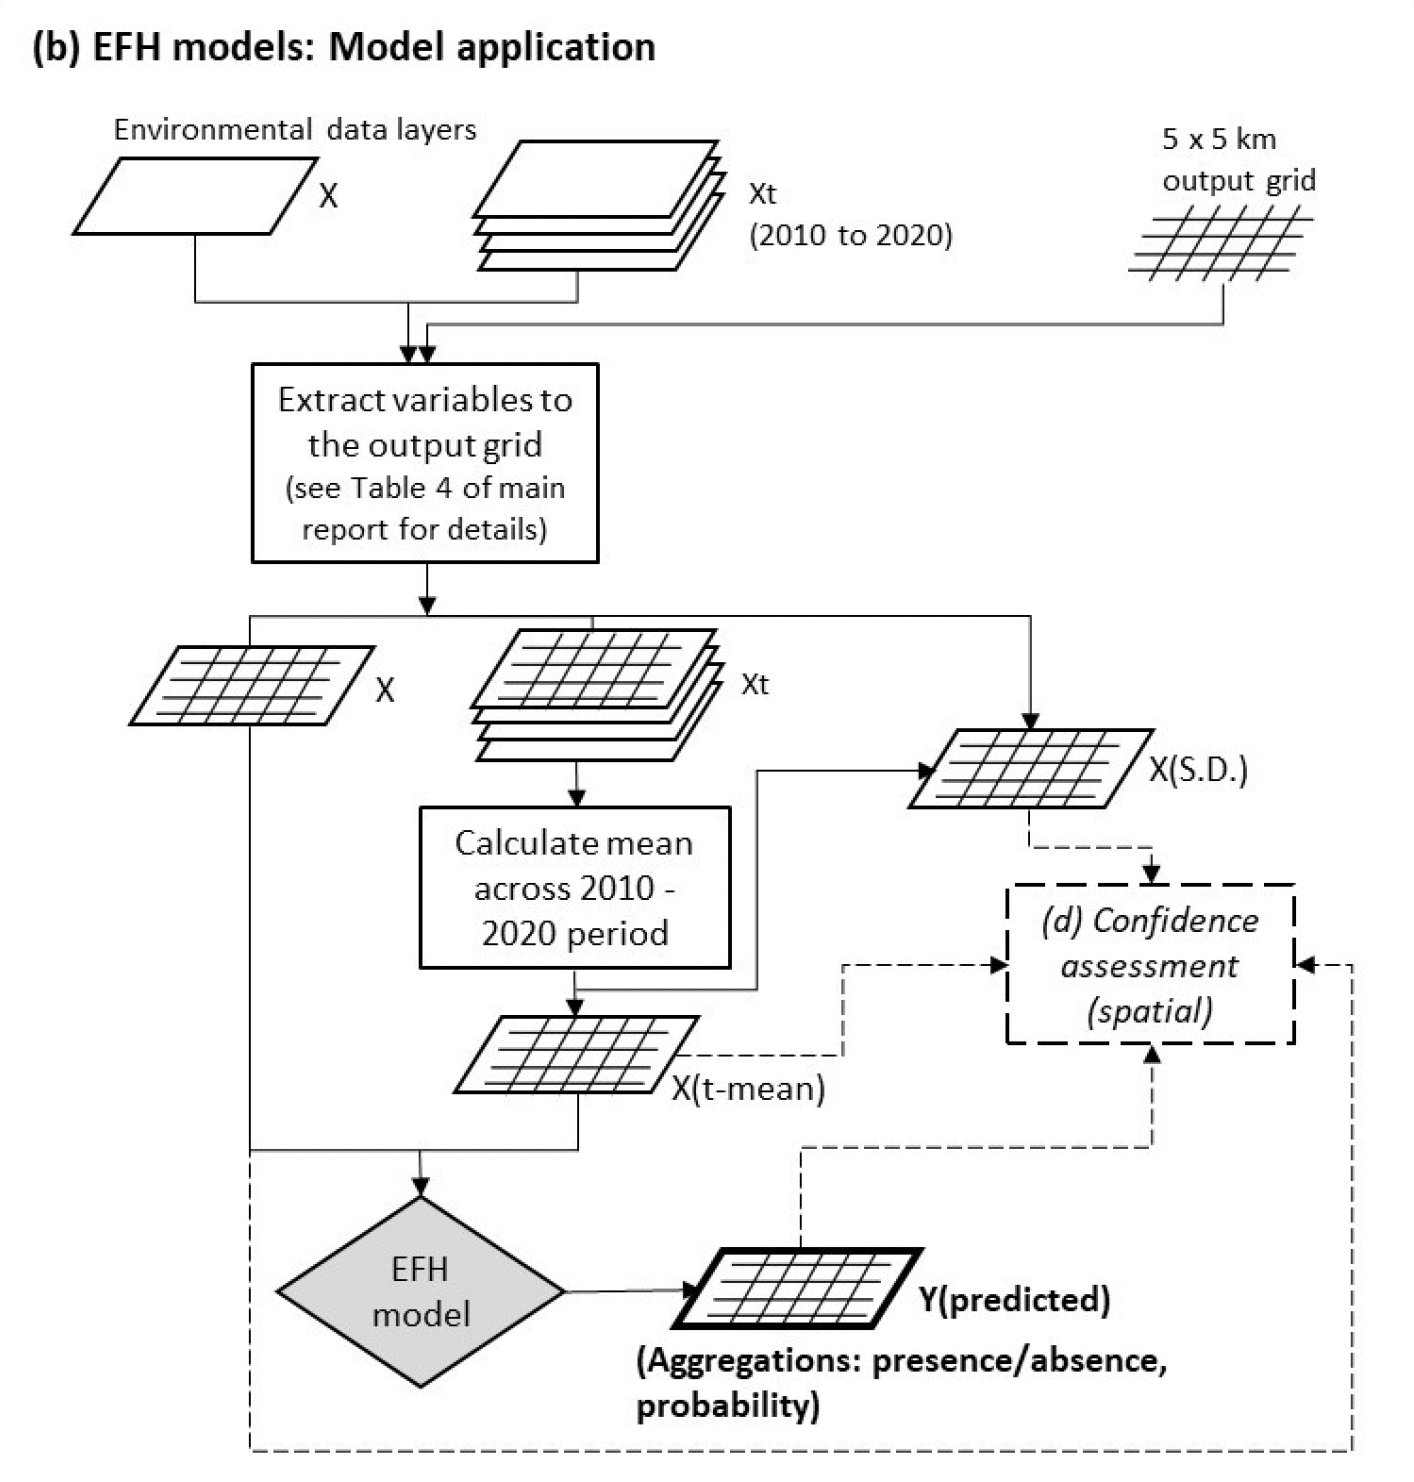
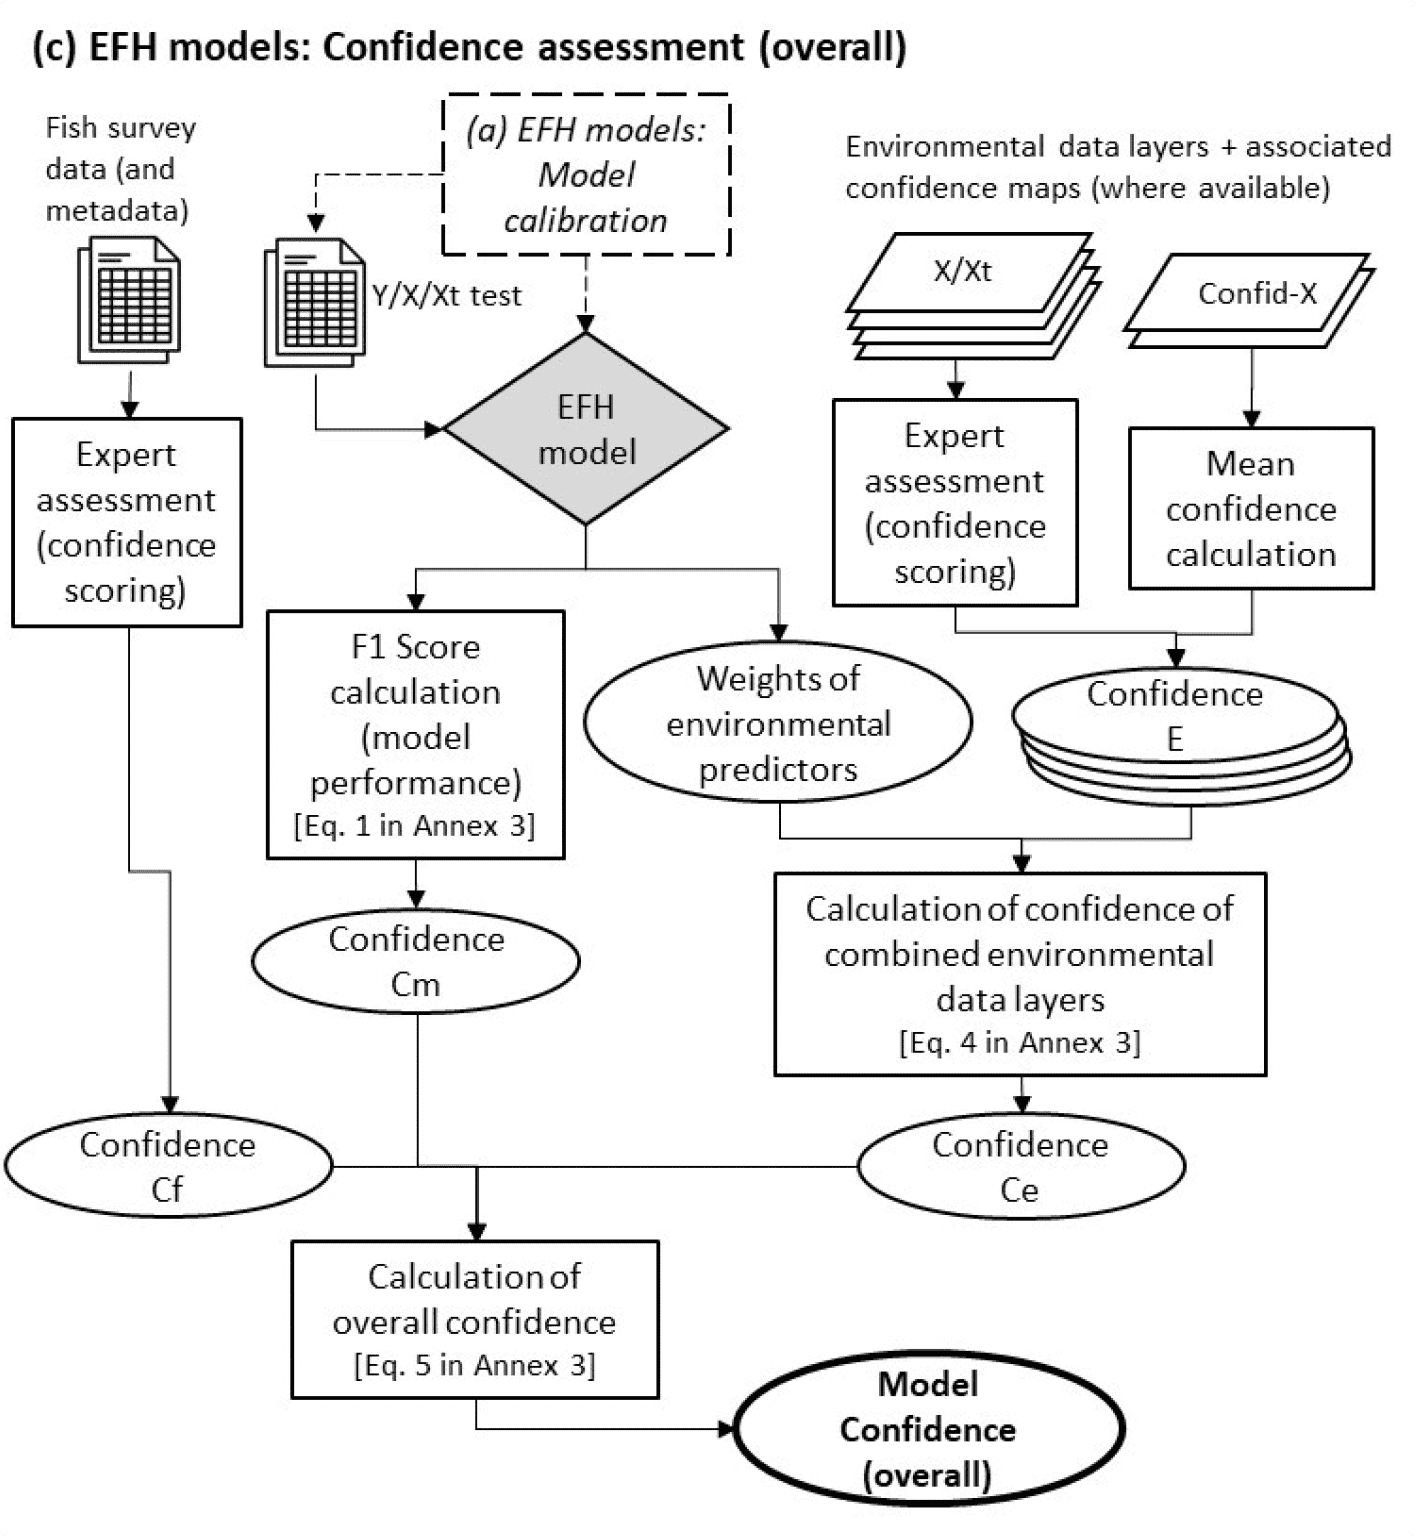
The methodological process undertaken in this project to develop the resulting EFH spatial outputs is summarised as a series of interrelated diagrams (flow charts).
The following diagrams are included (the relevant section of the report and technical annexes are indicated in parenthesis):
For the EFH spatial outputs from data-based modelling:
- a) EFH models: Model calibration (report sections 2.2.1 to 2.2.3; Annex 2);
- b) EFH models: Model application (report section 2.2.4; Annex 2);
- c) EFH models: Confidence assessment (overall) (report section 2.2.5; Annex 3);
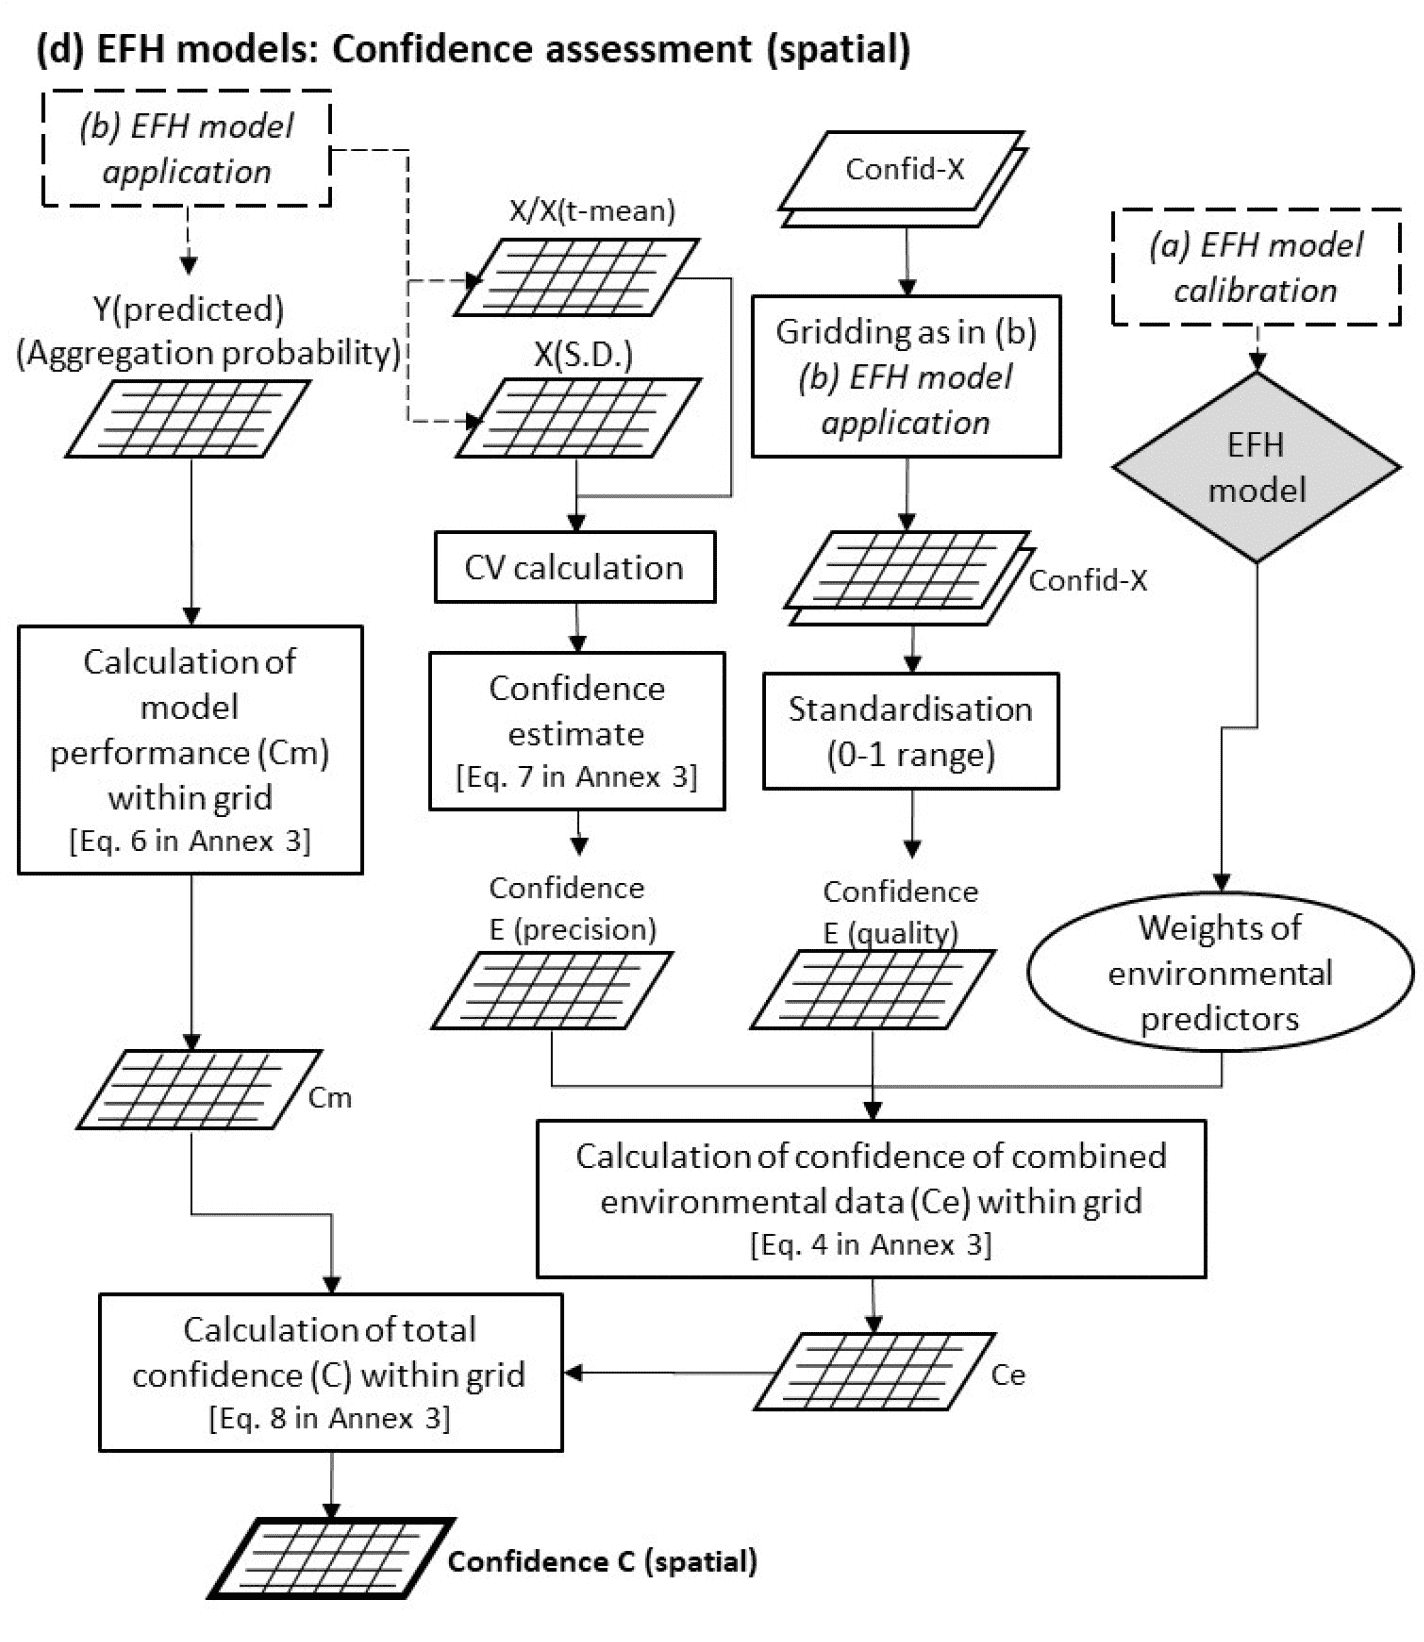
- d) EFH models: Confidence assessment (spatial) (report section 2.2.5; Annex 3);
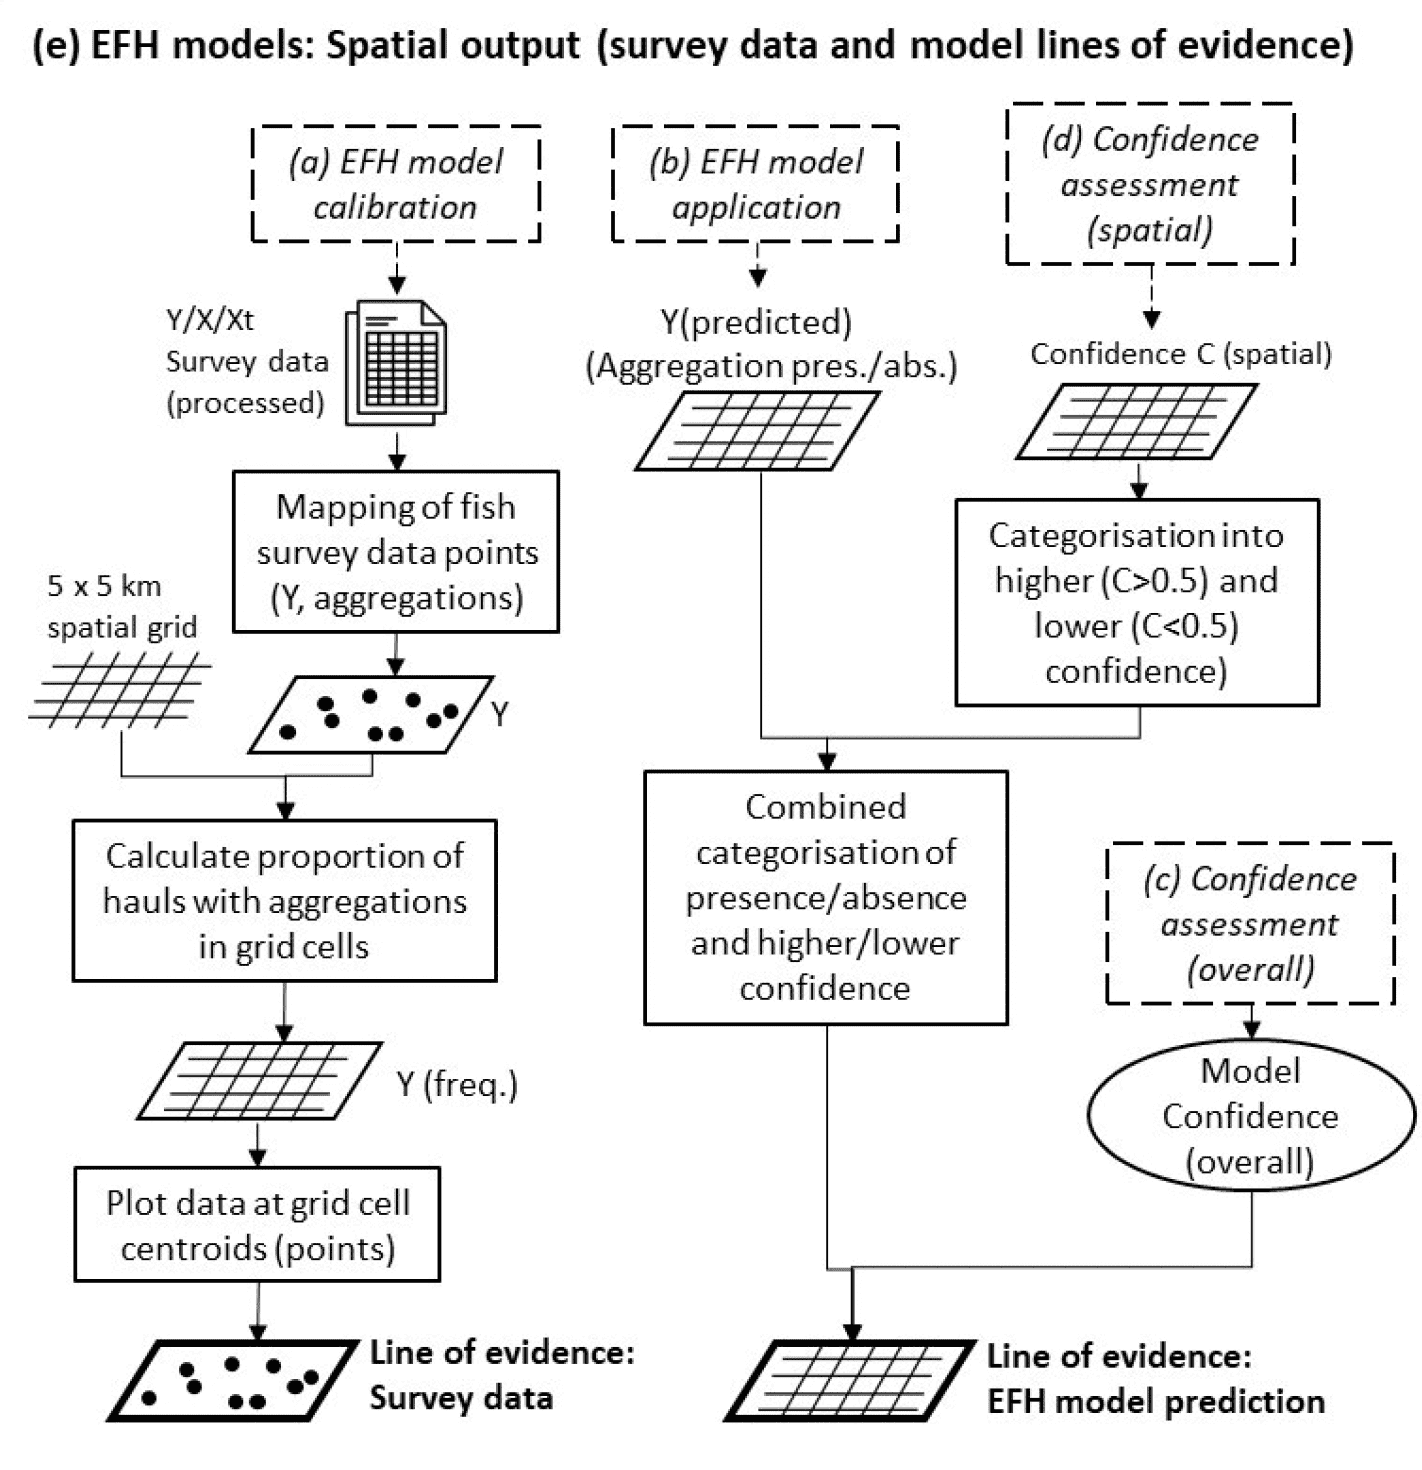
- e) EFH models: Spatial output (survey data and model lines of evidence) (report section 3.1);
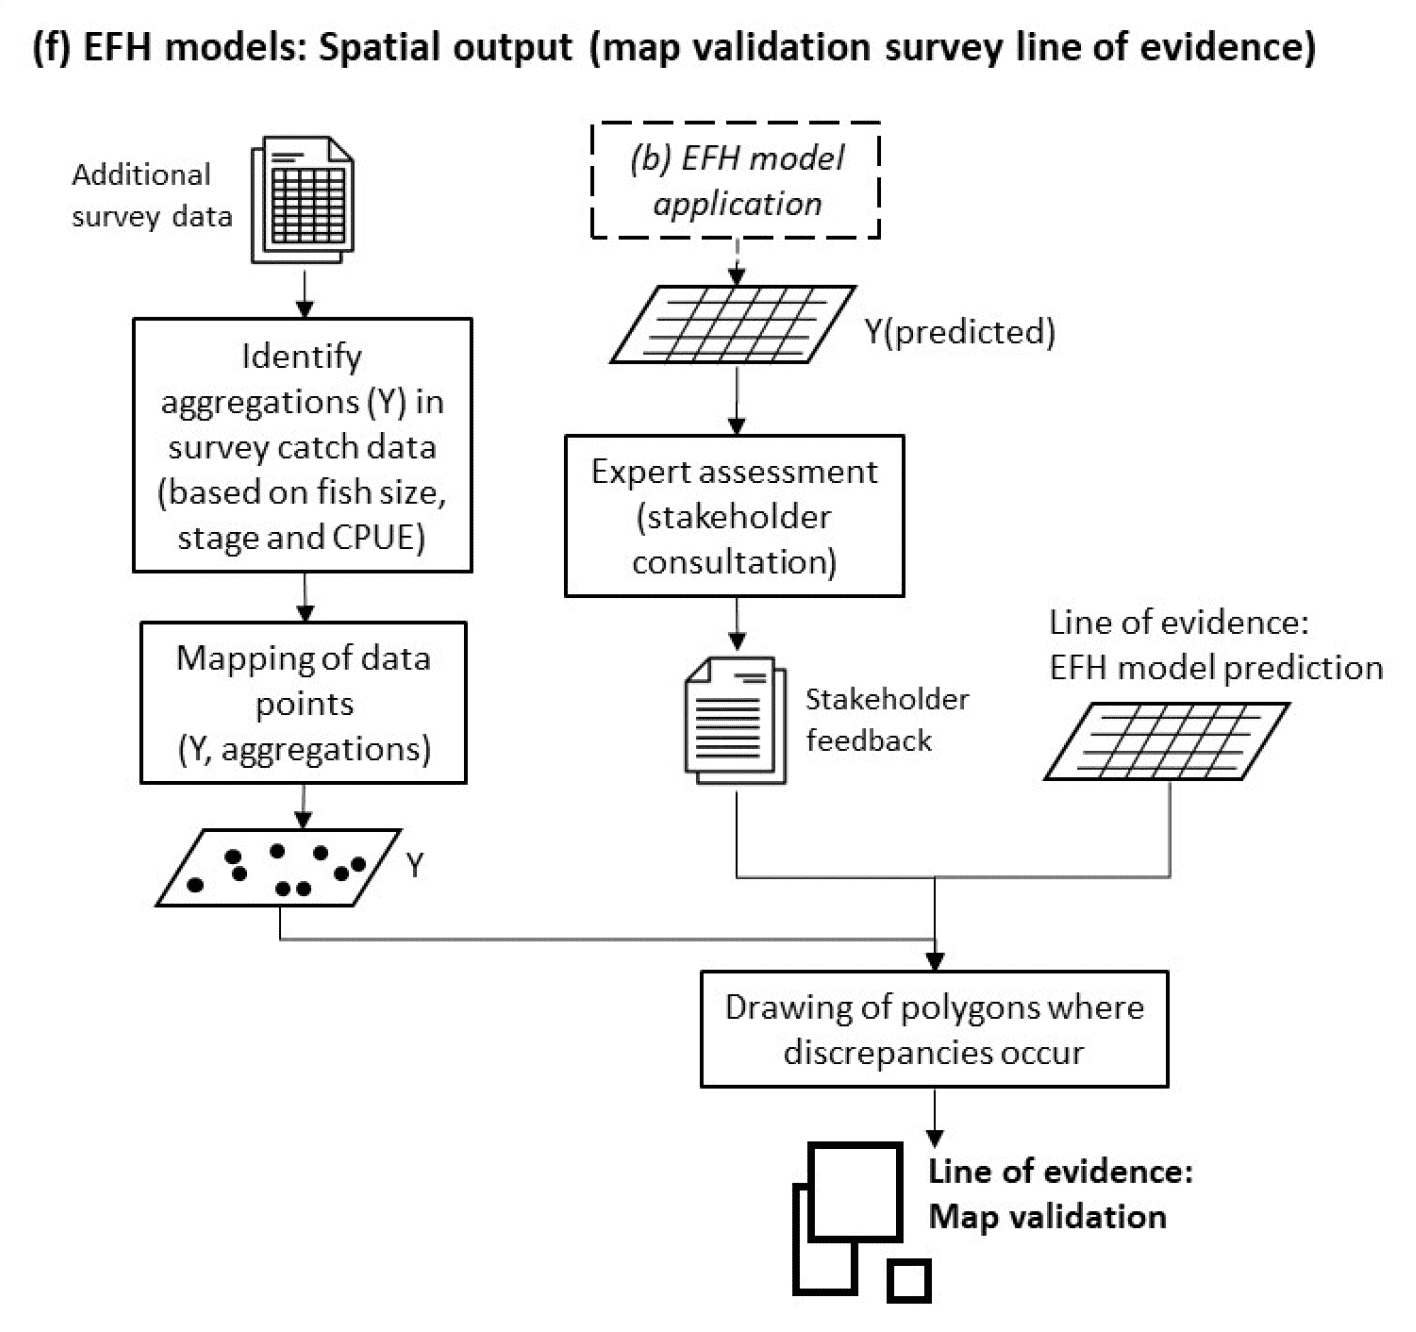
- f) EFH models: Spatial output (map validation survey line of evidence) (report section 3.1);
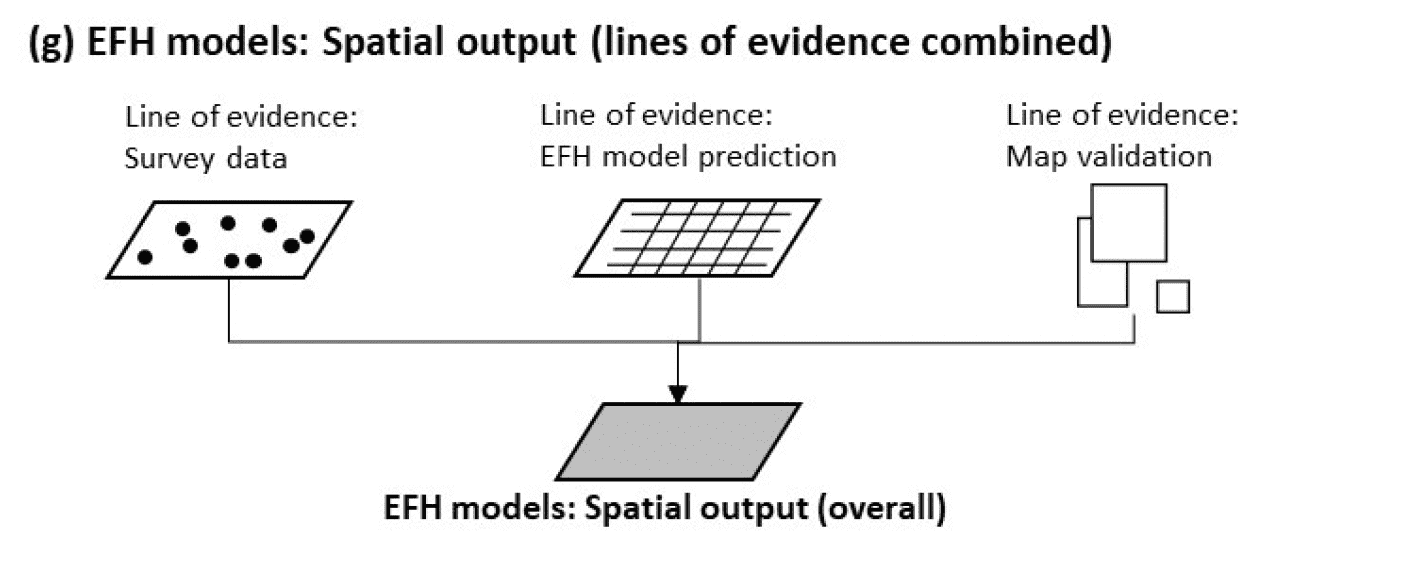
- g) EFH models: Spatial output (lines of evidence combined) (report section 3.1). For the spatial outputs from the habitat proxy assessment:
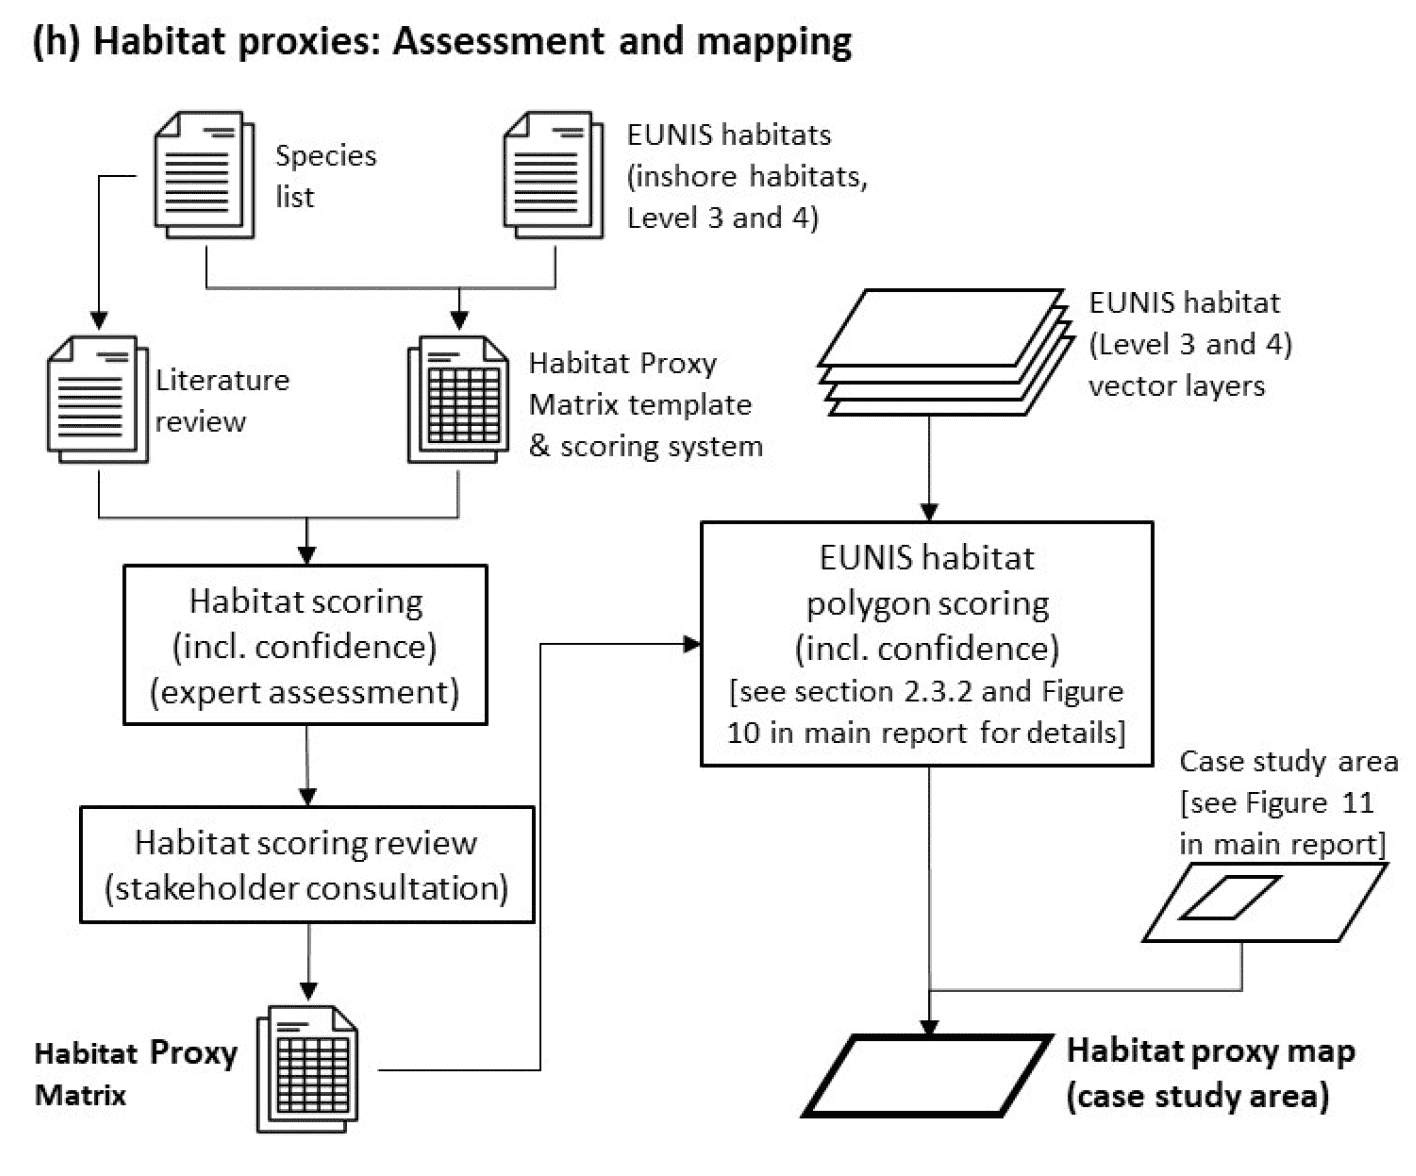
- h) Habitat proxies: Assessment and mapping (report section 2.3);
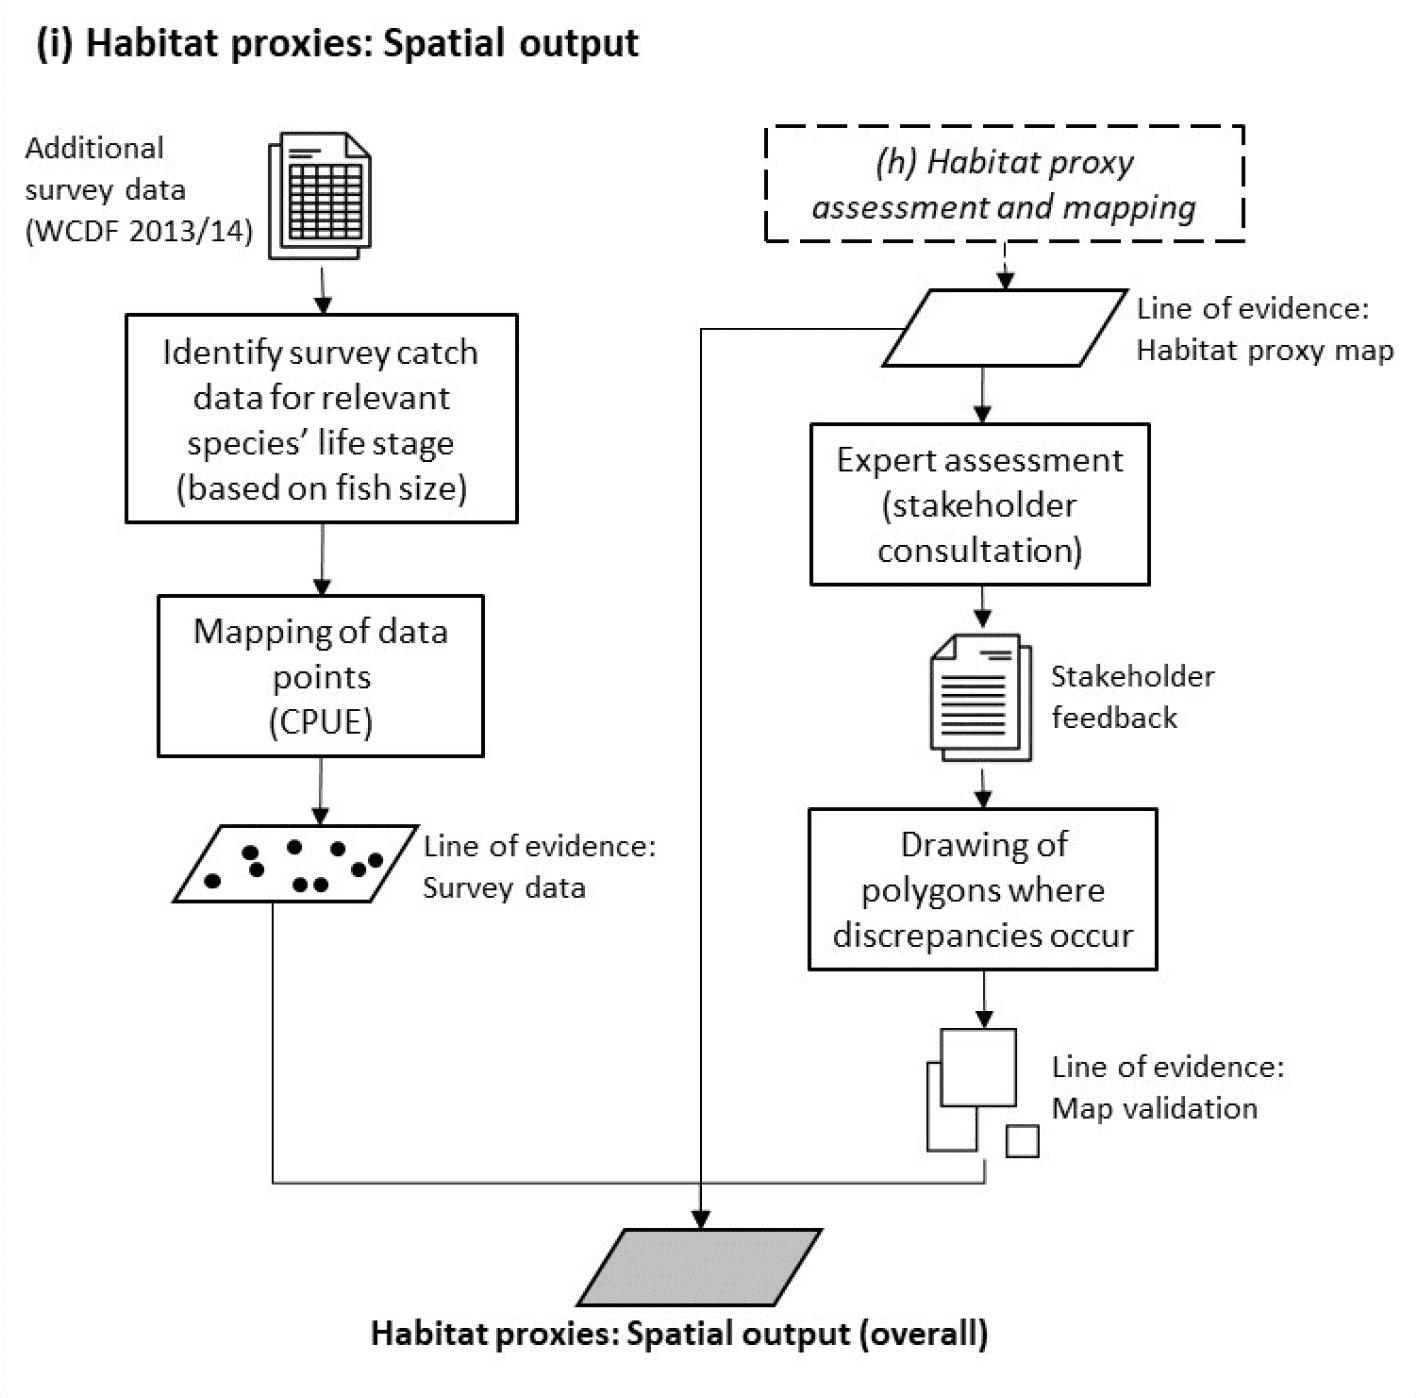
- i) Habitat proxies: Spatial output (report section 3.1).
A legend of the symbols used in the diagrams is given below. In addition, dashed lines in a diagram indicate flows of data/information from/into another main process (represented in a separate diagram). Bold lines and text indicate the main output of the process represented in a diagram. Y indicates data on fish/shellfish aggregations. X indicates persistent environmental variables (e.g. Depth), whereas Xt indicates non-persistent environmental variables (e.g. SST).
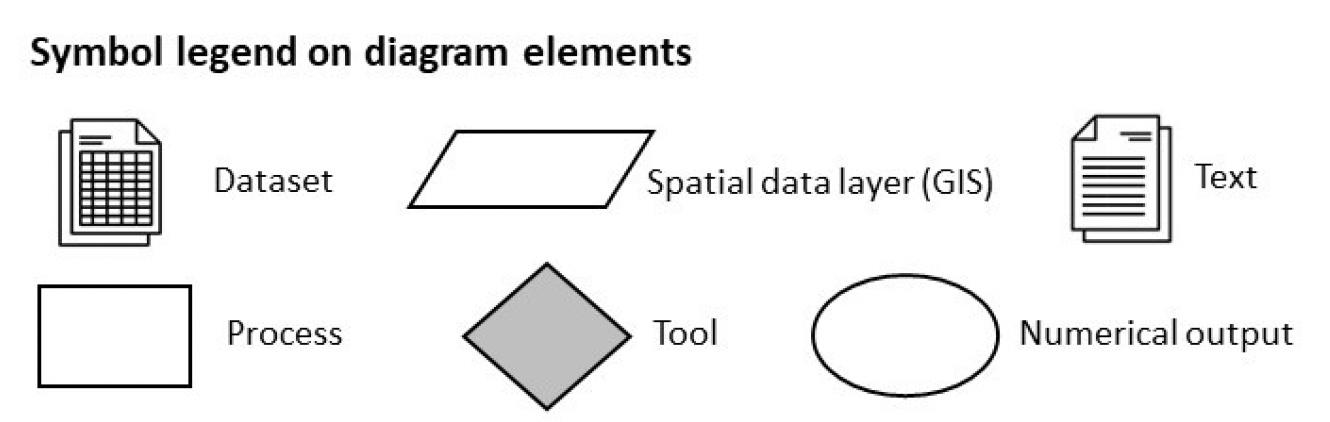
Footnote: Standard deviation (S.D.) is also derived from the gridding process to obtain the coefficient of variation (CV) that contributes to the spatial confidence assessment.
Contact
Email: ScotMER@gov.scot