Developing essential fish habitat maps: report
The project helped define areas of the sea essential to fish for spawning, breeding, feeding, or growth to maturity. Twenty-nine species and multiple life-stages were reviewed covering marine fish and shellfish of commercial and ecological importance, relevant to offshore wind development areas.
3. Results
3.1 EFH assessments by species
The results of the development of EFH maps for fish and shellfish species are presented by species, including the tool (model or habitat proxies) obtained from the relevant assessment(s) applied, and the associated map(s).
Assessment tools:
Where data-based models were applied, the decision tree resulting from the model is shown. This shows how the model predicted the presence (1) or absence (0) of aggregations of the selected species/life stage based on selected combinations of environmental conditions (see Annex 2 for details on how to read the decision trees). The environmental variables selected by the model as predictors of aggregations are indicated in the diagrams by using their variable short name. A full description of each variable and their measurement unit are given in Table 4. As the model predictions were considered valid only within the range of environmental conditions and substratum types represented in the survey datasets used to calibrate the models, these ranges are also given for reference.
Variables in bold indicate variables that were selected as predictors by the model.
Where the habitat proxy approach was used, the habitat types identified for the species and its key life stage(s) are listed. Only the most important habitats (i.e. habitats that received a higher score in the assessment) are shown. The reader should refer to Appendix B and to the Habitat Proxy Matrix (Excel spreadsheet "EFH_HabitatProxies_MATRIX") for the full list of habitats identified as relevant to the species.
Maps:
The map(s) presented in this report for each species combine the results from different components of the study, thus providing an integrated view of the distribution of the species and their potential essential habitats in Scottish/UK waters. See Appendix A (diagrams (f), (g) and (i)) for an outline of the process applied to combine the multiple lines of evidence into the spatial outputs presented here.
Where data-based models were applied, the map combines different evidence layers (Appendix A, diagrams (e), (f) and (g)):
- The actual distribution of the species/life stage aggregations in the 2010 – 2020 surveys (data used to calibrate the model).
The survey data are shown in the maps as relative frequency of aggregations, i.e. the proportion of hauls in each 5 x 5 km grid cell containing aggregations. Values range between 0 and 1, indicating respectively that none or all of the hauls undertaken between 2010 and 2020 within a grid cell contained aggregations of the species/life stage of interest. These data are displayed as points in the map at the centre of each grid cell (no point is shown where there were no surveys undertaken in a grid cell). This shows not only the spatial distribution of aggregations from the surveys, but also informs on the recurrence of such aggregations over the years. Standalone maps for this layer on calibration survey data are given in Appendix C. A breakdown of the list of survey data used to calibrate the models is given by species in Table 3 (including information on data sources and relevant seasonality for the species/life stage considered). - The distribution of aggregations predicted by the model. This layer identifies the location of areas where the environmental conditions (as considered in the mapped scenario, i.e. the mean seasonal conditions over the period 2010 - 2020) are suitable for aggregations of the species/life stage, thus indicating potential EFH. Additional results from the confidence assessment have been integrated in this layer by showing both the overall confidence associated with the predicting model (in the legend) and the spatial confidence associated with the spatial predictions of presence or absence of aggregations. The detailed results on the confidence for the different components combined into the overall confidence assessment are provided in Appendix D. Grey areas in the map ("n.a." in the legend) are areas where the environmental conditions (for the mapped scenario, i.e. seasonal mean of 2010 - 2020) fall outside the ranges identified on model calibration (as shown with decision trees) and, therefore, where model predictions are not considered to be valid. The list of species/life stages for which EFH modelling was undertaken (hence associated predictions are provided in the results) is given in Table 1.
- Map validation.
This layer shows indicative areas where a notable mismatch between the model prediction and existing knowledge of the distribution of the species was identified. This was derived from both (i) comparison with additional data/evidence (see section 2.4.1) and (ii) stakeholder consultation. As often these areas were identified through descriptions given by stakeholders, rectangles/polygons were drawn on the maps to identify these areas of mismatch of information, hence denoting areas where the confidence associated with the underlying predictions is lowered. The nature of the mismatch (where present) is summarised in reference notes shown at the bottom of the map, with further explanation given in the text of the report. Maps of the specific additional evidence used for the comparison (e.g. additional survey data) are shown in Appendix C).
Where the habitat proxy approach was applied, the maps were drawn for the case study area of the west of Scotland only. The evidence layers combined on a map include:
- The distribution of habitats (EUNIS Level 3 and 4) assessed as proxies for the habitat of the species/life stage. The results of the assessment are shown by colour-coding the habitat types according to a combination of the score reflecting the importance of the habitat and the associated confidence as allocated in the Habitat Proxy Matrix. Grey areas in the maps indicate both habitats that were scored as 0 (unsuitable for the species/life sage) or not scored (suitability unknown) in the matrix. Areas shown as white in the map cover habitat types that were not included by the matrix assessment (e.g. offshore (deeper) habitats, habitats identified at levels other than Level 3 and 4) or where no information on the EUNIS habitat was available.
- The actual distribution of the species/life stage as directly derived from survey data, including both data used to calibrate the data-based models and additional survey data, where relevant and available for the case study area. The former (calibration survey data) are displayed as described above for the model maps. The latter (additional survey data) show survey data points categorised according to the abundance (CPUE) of the life stage of interest in the catches. Standalone maps of this specific survey evidence are shown in Appendix C.
A total of 29 species (20 fish including 3 elasmobranchs, plus 9 shellfish) were assessed in the study using the data-based model and/or the habitat proxy approach. The main results are shown in detail, species by species, in sections 3.1.1 to 3.1.29, and summary tables are presented in section 3.1.30.
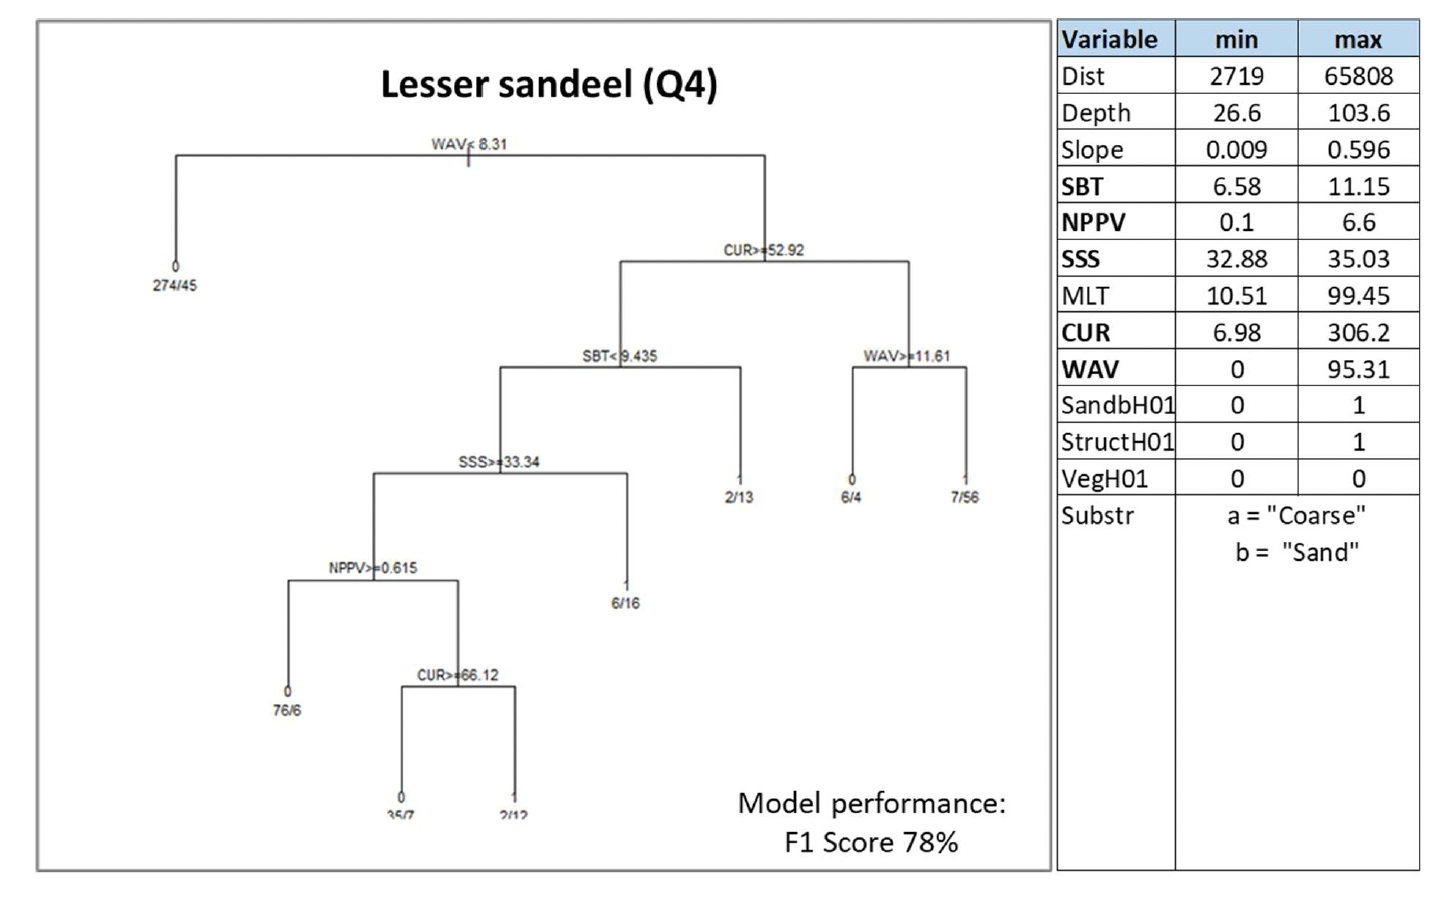
3.1.1 Lesser sandeel, Ammodytesmarinus
Lesser sandeel (Ammodytes marinus Raitt 1934) is a small shoaling benthopelagic species which is especially important as food for top predators with a reported decrease in sandeel stocks due to the fishery off the Scottish east coast being linked with declines in the breeding success of some seabirds at adjacent colonies (Rindorf et al. 2000). Sandeels are also commercially fished in the North Sea and are designated as Priority Marine Features in Scotland's seas. A. marinus occurs both inshore and offshore and has a close association with the seabed due to its burrowing behaviour which provides some protection from predators. The species spends most of the time buried in the sediment, particularly during low light intensity (at night and in the winter), and only emerges into the water column during the day for feeding (and for longer time in the summer), and for spawning in winter. Ammodytes marinus prefers burrowing into medium to coarse sand substrata, and therefore it is often found residing at the centre of sandbanks or feeding in the water column at sandbank edges (Annex 1).
A. marinus was assessed by using the model approach, with the distribution of aggregations of the species in winter being used as indicator of potential important habitats used as refugia. The model was based on data from winter dredge surveys targeting sandeel sedimentary habitats in Scottish waters. The range of environmental conditions characterising the surveyed locations where sandeel was found is shown in the table within Figure 15, along with the decision tree resulting from the analysis. Due to the high correlation (Pearson's correlation coefficient 0.8) between depth and water column mixing (MLT) in the sandeel dataset, the latter variable only was retained in the analysis[13].
Current and wave energy at the seabed (CUR and WAV) were the most important predictors of aggregations of A. marinus. Low-moderate energy levels[14] generally characterised the surveyed sandeel grounds, with aggregations predicted with higher probability (0.89) in lower energy environments (wave energy between 8.3 and 11.6 N m2/s and current energy ≤52.9 N m2/s). Where current energy was higher than 52.92 N m2/s, seabed temperature (SBT), salinity (SSS) and primary production (NPPV) also contributed to predicting sandeel aggregations, generally associated with higher mean winter monthly seabed temperature (≥9.4°C) or, at lower temperature, with lower salinity (<33.3) or lower primary production (<0.61 mg C m-3 day-1) (Figure 15).
It is of note that the type of seabed (Substr) did not result as an important predictor in the model due to the fact that the surveys targeted only sandy and coarse sediment grounds.
This relative homogeneity in the sampled substrata already representing preferred sandeel grounds led to the absence of further discrimination between sediment types by the model.
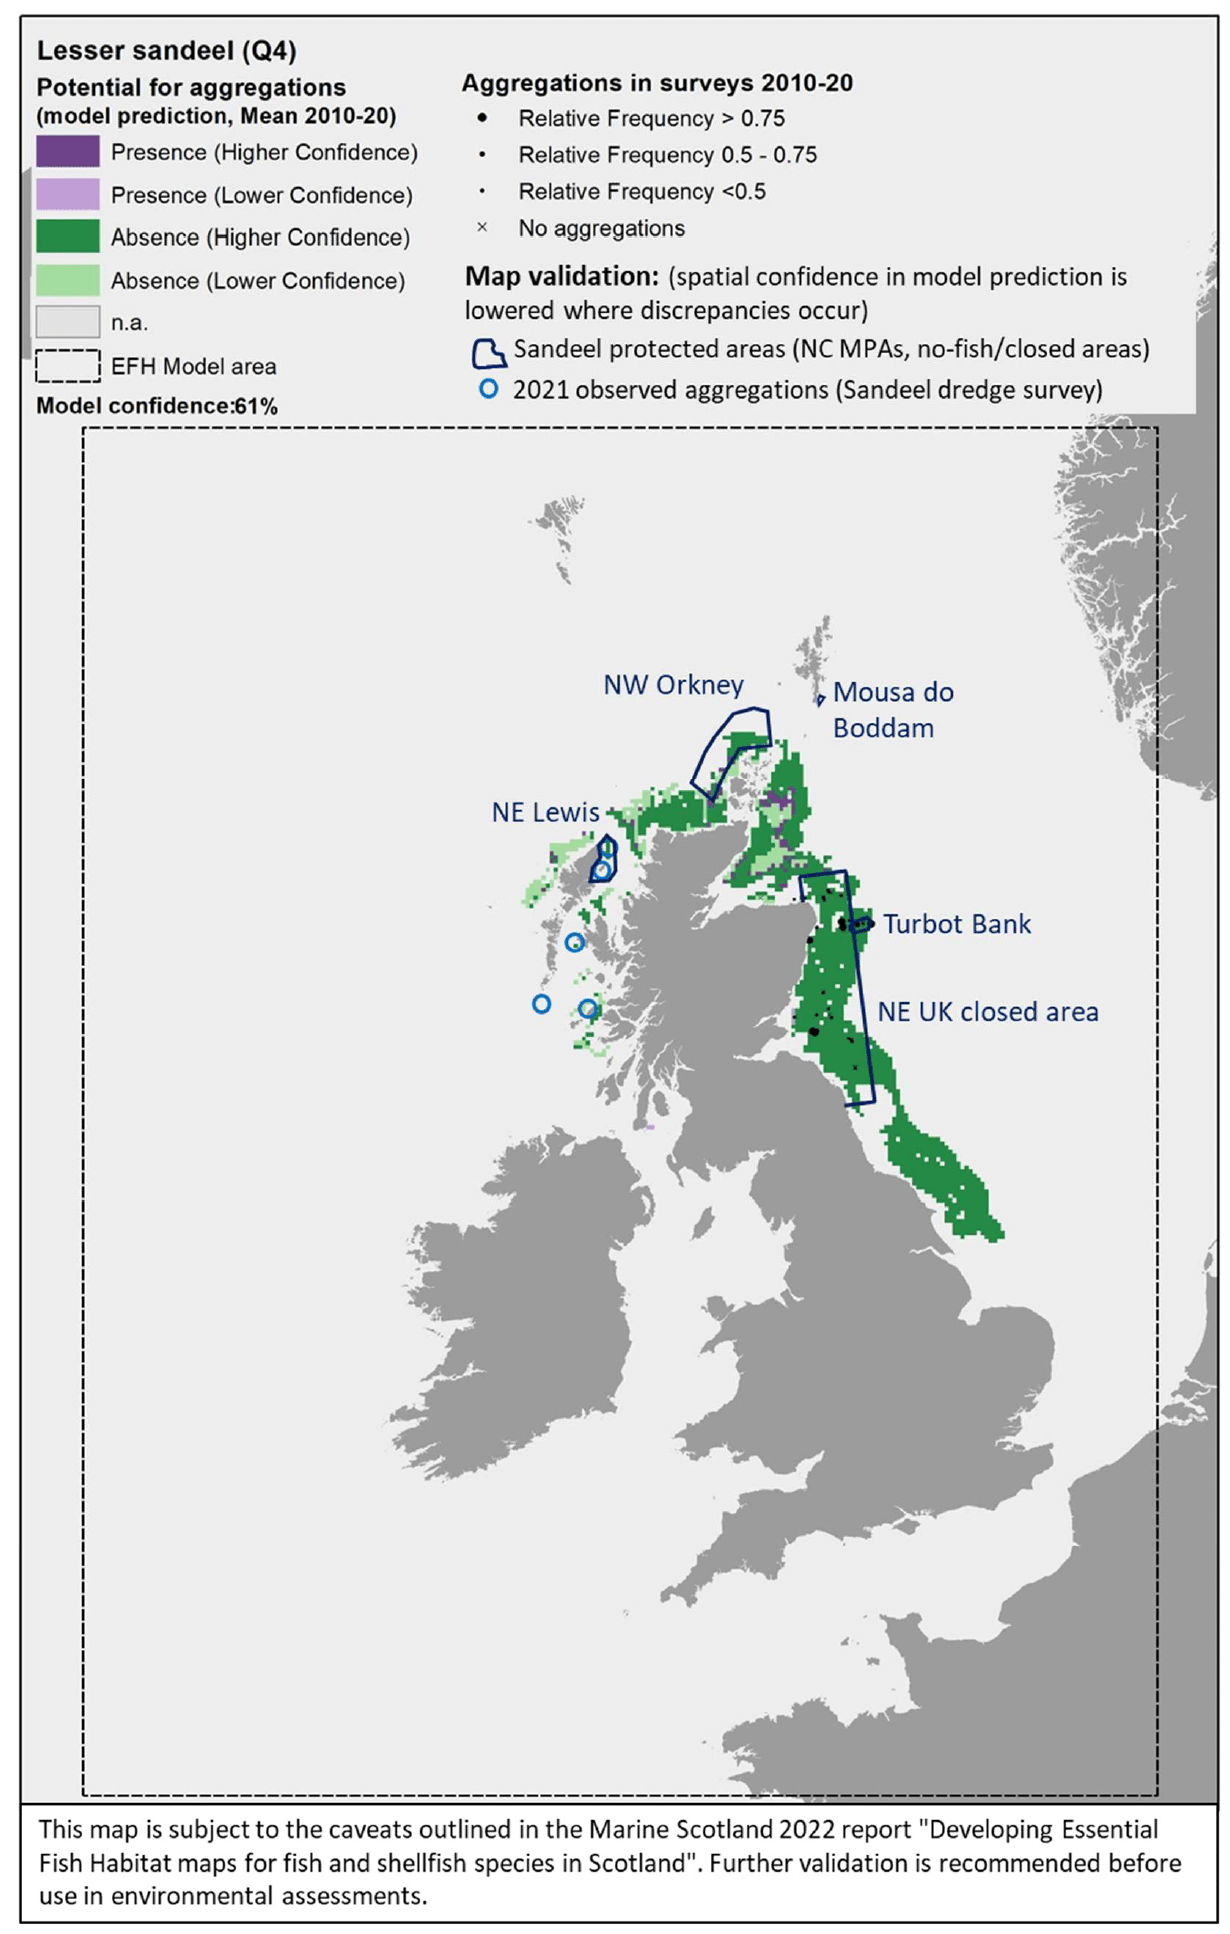
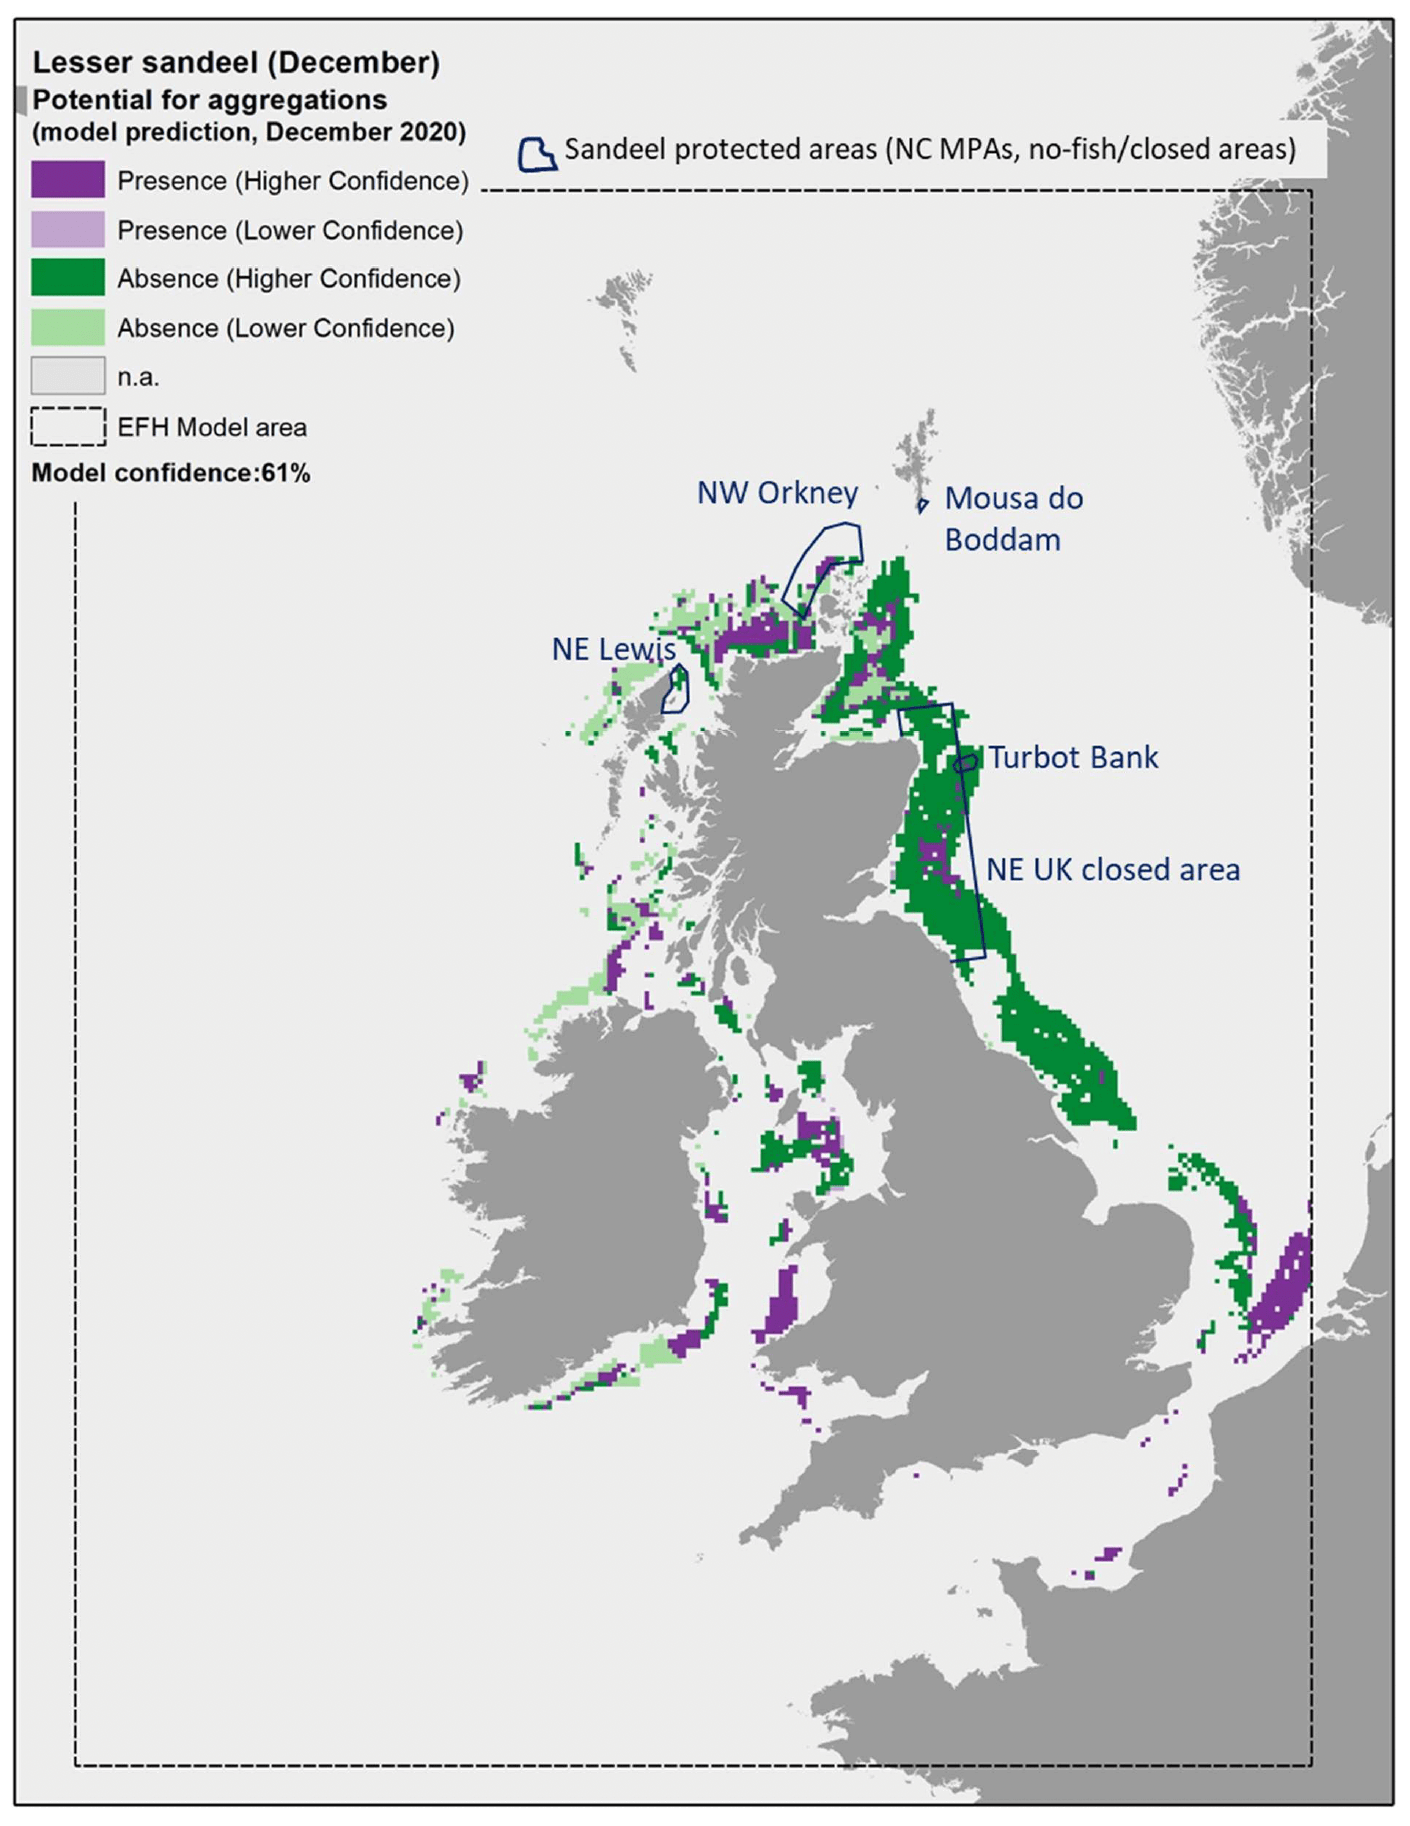
The model prediction applied to the mean winter environmental conditions of the period 2010 - 2020 allowed to map the potential winter distribution of aggregations of A. marinus and therefore of their refugia (Figure 16). The spatial coverage of the prediction was limited by the environmental ranges of the targeted sandeel grounds for which survey data were used to calibrate the model, which, for example, only included areas at a distance from the shore between 3 and 66 km. Therefore, the model predictions had poor coverage of areas closer to the shore or further offshore, and of the west coast of Scotland and the south and west coast of the UK.
Comparison with available survey data (both used for the model calibration and additional survey data for map validation; Appendix C, Figure C1 and Figure C2) as well with known sandeel grounds (Appendix C, Figure C3), as also highlighted during the consultation with stakeholders, has highlighted some inaccuracies in the map (Figure 16). These were mainly due to the failure of the map in identifying potential suitable areas for aggregation on protected sandeel grounds within the north east UK sandeel closure (where the sandeel fishery has been closed since 2000 to protect the stock; EU Regulation 227/2013) and within nature conservation Marine Protected Areas (NC MPAs) designated in Scottish waters with sandeels as the key feature. These include the North-west Orkney NC MPA, Turbot Bank NC
MPA, Mousa to Boddam NC MPA (not covered by the mapped predictions) and North-east Lewis NC MPA. The presence of aggregations of A. marinus in some of these areas was confirmed by survey data, with additional 2021 survey identifying further aggregation areas on the west coast of Scotland (Figure 16).
Further exploration of the model predictions showed that the inaccuracies highlighted in the map in Figure 16 were mainly due to limitations in the environmental scenario used to draw that map (environmental conditions averaged for the winter season over the period 2010 - 2020), rather than to limitation in the model predictive ability. In fact, the model predictive performance for lesser sandeel was good (78%), with the overall confidence lowered to 61% mainly due to the restricted geographical coverage of the fish survey data used to calibrate the model and the generally low confidence associated with the layer on wave energy, an important predictor in the model (Annex 3). As a result, the model for lesser sandeel aggregations was one of the models with higher confidence amongst those calibrated for the species in this study.
In turn, it appears that using the mean of winter environmental conditions over the study period 2010 - 2020 (particularly for the model predictors SBT, SSS and NPPV) provides an inaccurate representation of the actual conditions experienced by A. marinus over the years, thus leading to the observed inaccuracies in the map prediction in Figure 16. In fact, when predictions were applied to more accurate environmental scenarios , model predictions matched survey data more closely and known locations of sandeel grounds were observed.
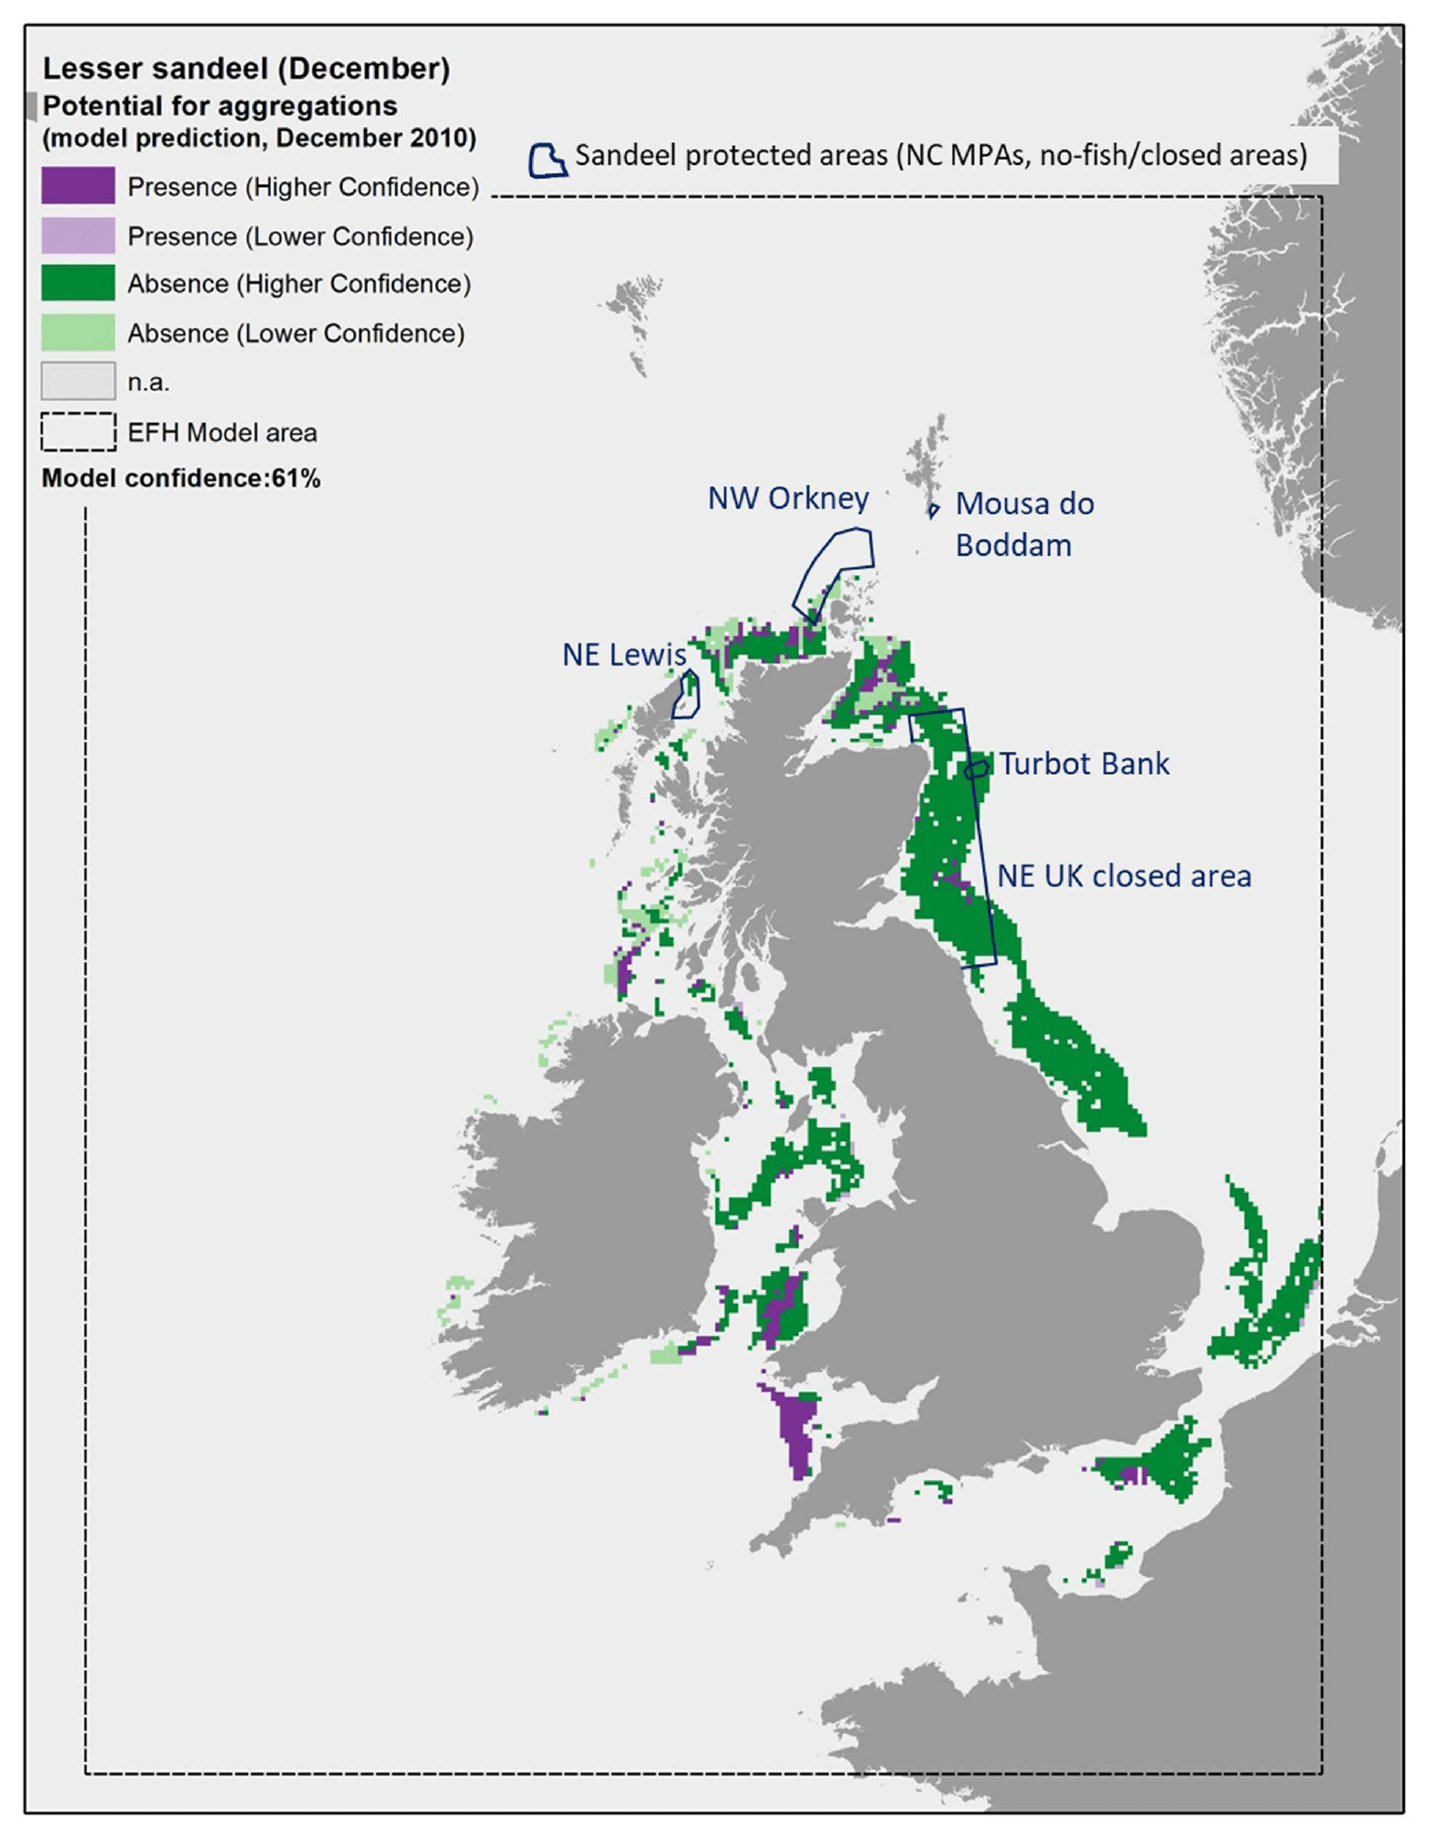
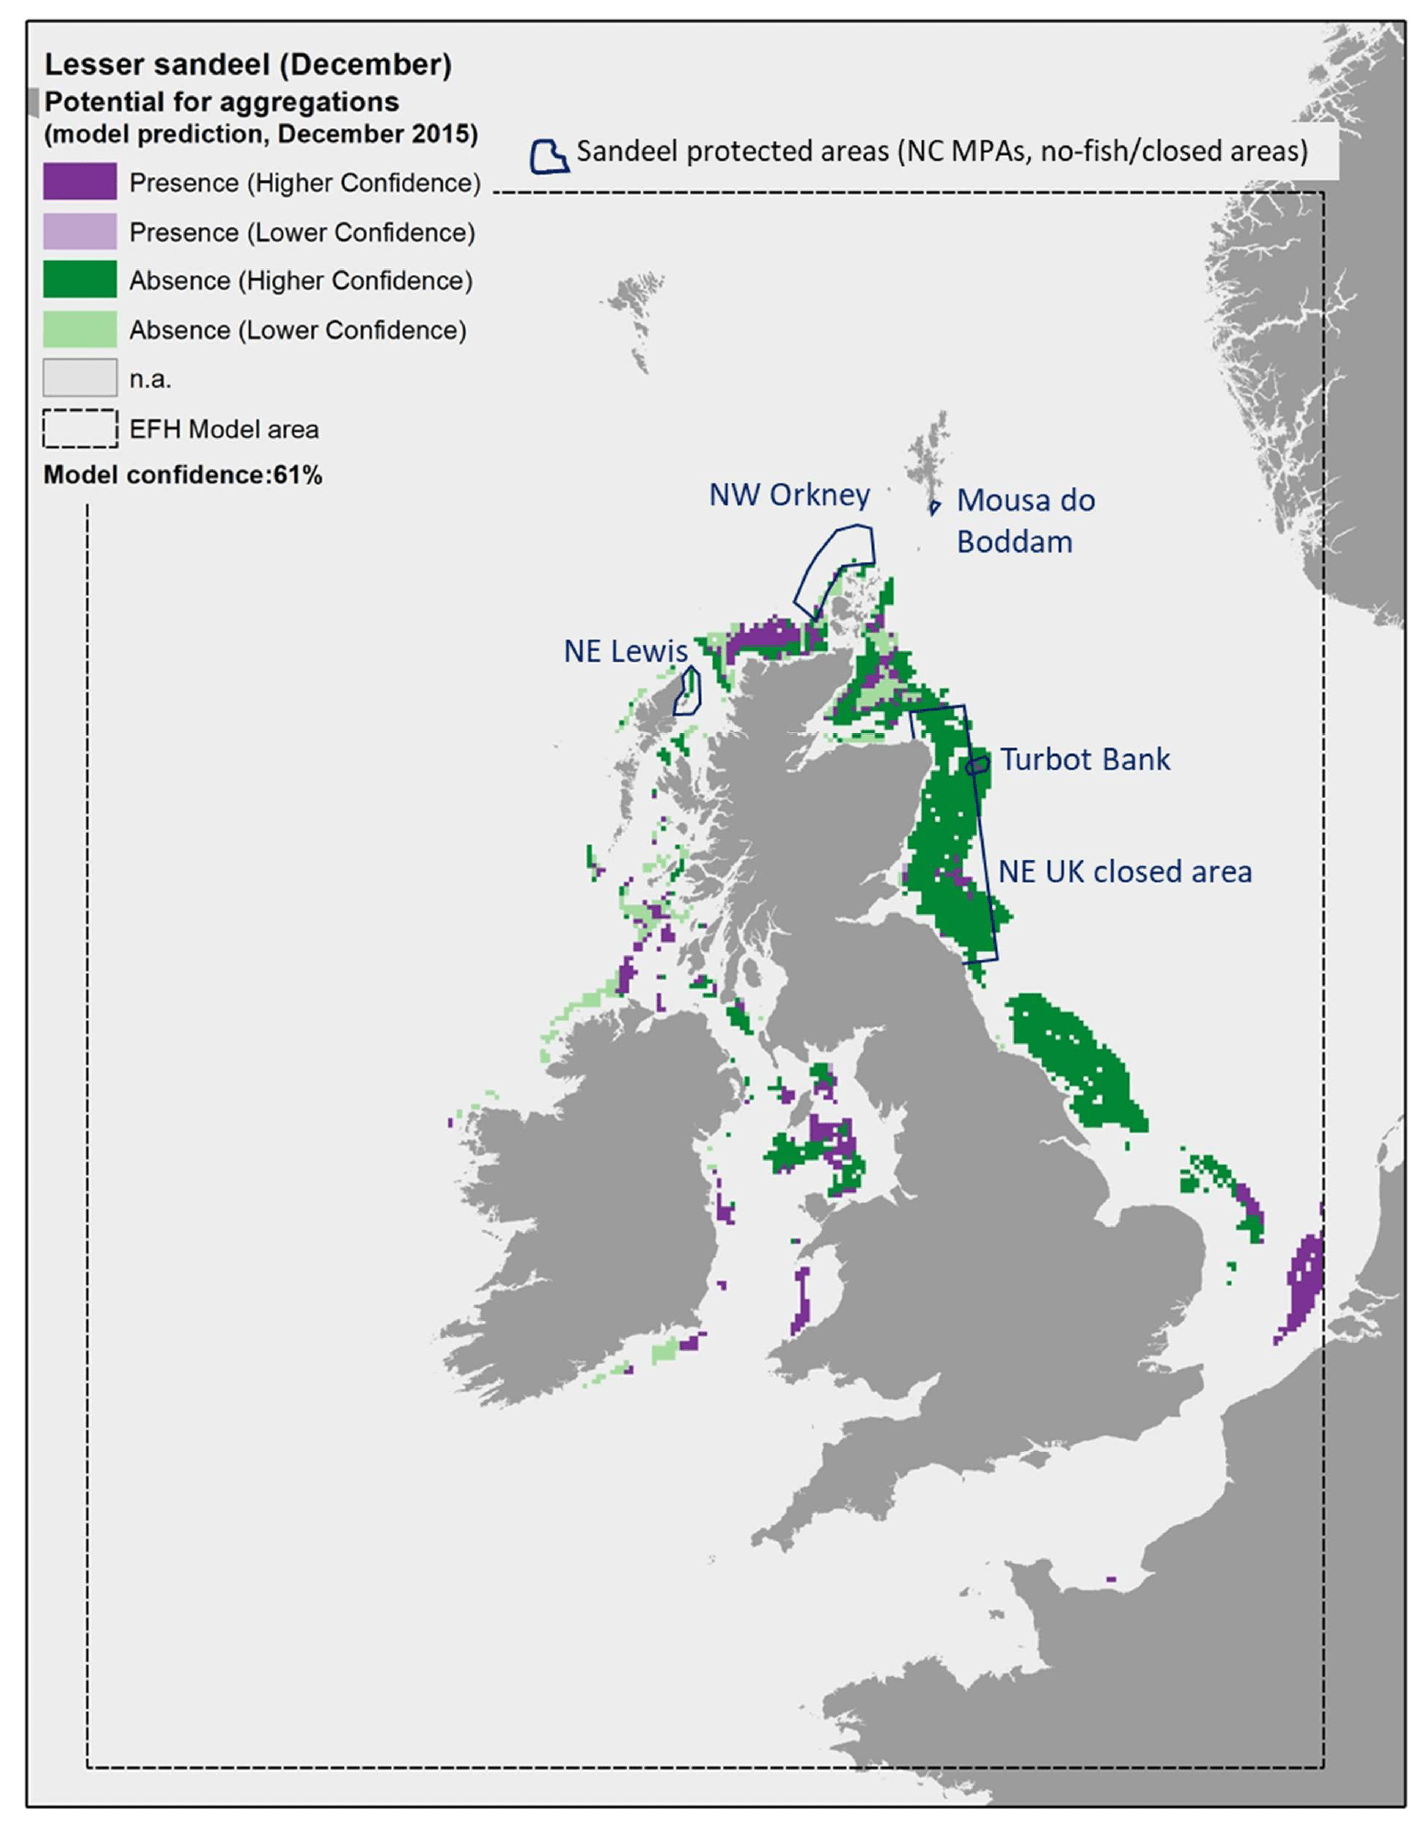
An example of this higher accuracy in the model predictions is shown in Figure 17, Figure 18 and Figure 19, where the EFH model for A. marinus was applied to environmental conditions in December of individual years, namely 2010, 2015 and 2020. As a result, the model was able to also predict the presence of aggregations within areas that are known to include sandeel grounds, as for example off the Firth of Forth in the north east UK sandeel closure or Northwest of Orkney. The comparison between the maps in these figures also allow to appreciate the inter-annual variability in the species distribution as predicted by the model. In particular, an increase in the extent of the areas where aggregations of A. marinus were predicted to occur is observed between 2010, 2015 and 2020. In Scottish waters, this is observed for example along the north coast of Scotland, Northwest of Orkney, off the Firth of Forth on the east coast, and northwest of Islay on the west coast. This change is mostly due to the increase in seabed temperature (Table 9). In 2010, the seabed temperature in these areas was on average between 7.8°C and 9.0°C, and this combined with other environmental conditions such as wave energy (WAV) always >8.35 N m2/s, mean current energy (CUR) always >70 N m2/s, mean salinity (SSS) always >34, primary production (NPPV) mostly >0.61 mg C m-3 day-1, or, when <0.61 mg C m-3 day-1, often associated with current energy <66.1 N m2/s. Under this set of environmental conditions, the model for A. marinus predicted absence of aggregations in most of these areas (Figure 17). In 2015 and 2020, the seabed temperature increased to values on average between 9.0°C and 9.9°C, with the mean values above 9.4°C in the north coast of Scotland and northwest of Islay in 2015, and in all areas in 2020 (Table 9). These thermal conditions, combined with wave energy (WAV) always >8.35 N m2/s and mean current energy (CUR) always >70 N m2/s, led to the observed increase in the prediction of presence of aggregations in these areas (Figure 18 and Figure 19).
| Area | Mean SBT (°C, December) | ||
|---|---|---|---|
| 2010 | 2015 | 2020 | |
| North coast of Scotland | 8.75 | 9.52 | 9.54 |
| Northwest of Orkney | 8.67 | 9.36 | 9.51 |
| Off the Firth of Forth | 7.76 | 9.05 | 9.44 |
| Northwest of Islay | 9.02 | 9.87 | 9.90 |
| Total mean | 8.49 | 9.42 | 9.55 |
Langton et al. (2021) have also recently mapped the habitats of A. marinus in the Greater North Sea and Celtic Seas regions. These were based on species distribution models calibrated on Day grab surveys off the Firth of Forth, and using geomorphological variables only as predictors (depth, slope, percentage of silt and sand in the sediment). As these distributions are also based on model predictions and extrapolation, rather than on actual observations, they were not considered for the map validation in Figure 16, but a comparison was undertaken nevertheless (considering the better predictions for individual years in this study). Despite the difference in source data and in the variables selected as environmental predictors, the spatial results of both studies seem to converge in identifying areas of higher sandeel density off the Firth of Forth and the Moray Firth, north and west of Islay, along the northeast coast of Donegal and east of Dublin. However, both maps appear to fail in identifying the sandeel grounds on and east of the Turbot Bank NC MPA. The maps by Langton et al. (2021) also identified inshore areas of high sandeel density north of Lewis, which are only marginally identified in this study (Figure 16). In turn, the maps in Langton et al. (2021) seem to fail to identify sandeel habitats in the North-west Orkney NC MPA, while these are picked up by the predictions in Figure 16. Predictions for individual years in this study also identified potentially highly suitable areas for aggregations of A. marinus along the north coast of Scotland, which was only partially covered by the predictions in Langton et al. (2021). Finally, the maps in Langton et al. (2021) identified sandeel habitats with the widest extent and fish density on the Dogger Bank and the North Norfolk sandbanks, in the southern North Sea. As the environmental conditions in these areas were outside the range over which A. marinus were found in the dredge surveys used to calibrate our model (the most notable being distance from shore >66 km), our map does not cover those areas.
3.1.2 Small sandeel, Ammodytestobianus
Small sandeel (Ammodytes tobianus Linnaeus 1758) has similar ecology and importance as food for top predators as the closely related lesser sandeel (Ammodytes marinus), except for the fact that small sandeel occurs mostly inshore (Annex 1). As such A. tobianus was assessed by using the habitat proxy approach to identify habitats that may potentially be used by the species as refugia.
Nineteen publications were reviewed (these often included both sandeel species A. tobianus and A. marinus, given the similarity in their ecology) and provided detailed characterisation of the species' habitat requirements (see Annex 1). This, along with expert input obtained with the stakeholder validation, led to a high confidence in the overall assessment of habitat proxies for A. tobianus. The most suitable inshore habitats functioning as refugia for the species were coarse sediments from the sublittoral and circalittoral zones, including where salinity is variable in estuaries (Table 10). These habitats had high scores for both suitability and confidence in the assessment (3/H). A less suitable but still high scoring habitat was infralittoral coarse sediments (2/H). Further possible habitats, scored with medium to low suitability and medium to low confidence (not shown in Table 10), included sublittoral sands and infralittoral, circalittoral and sublittoral mixed sediments.
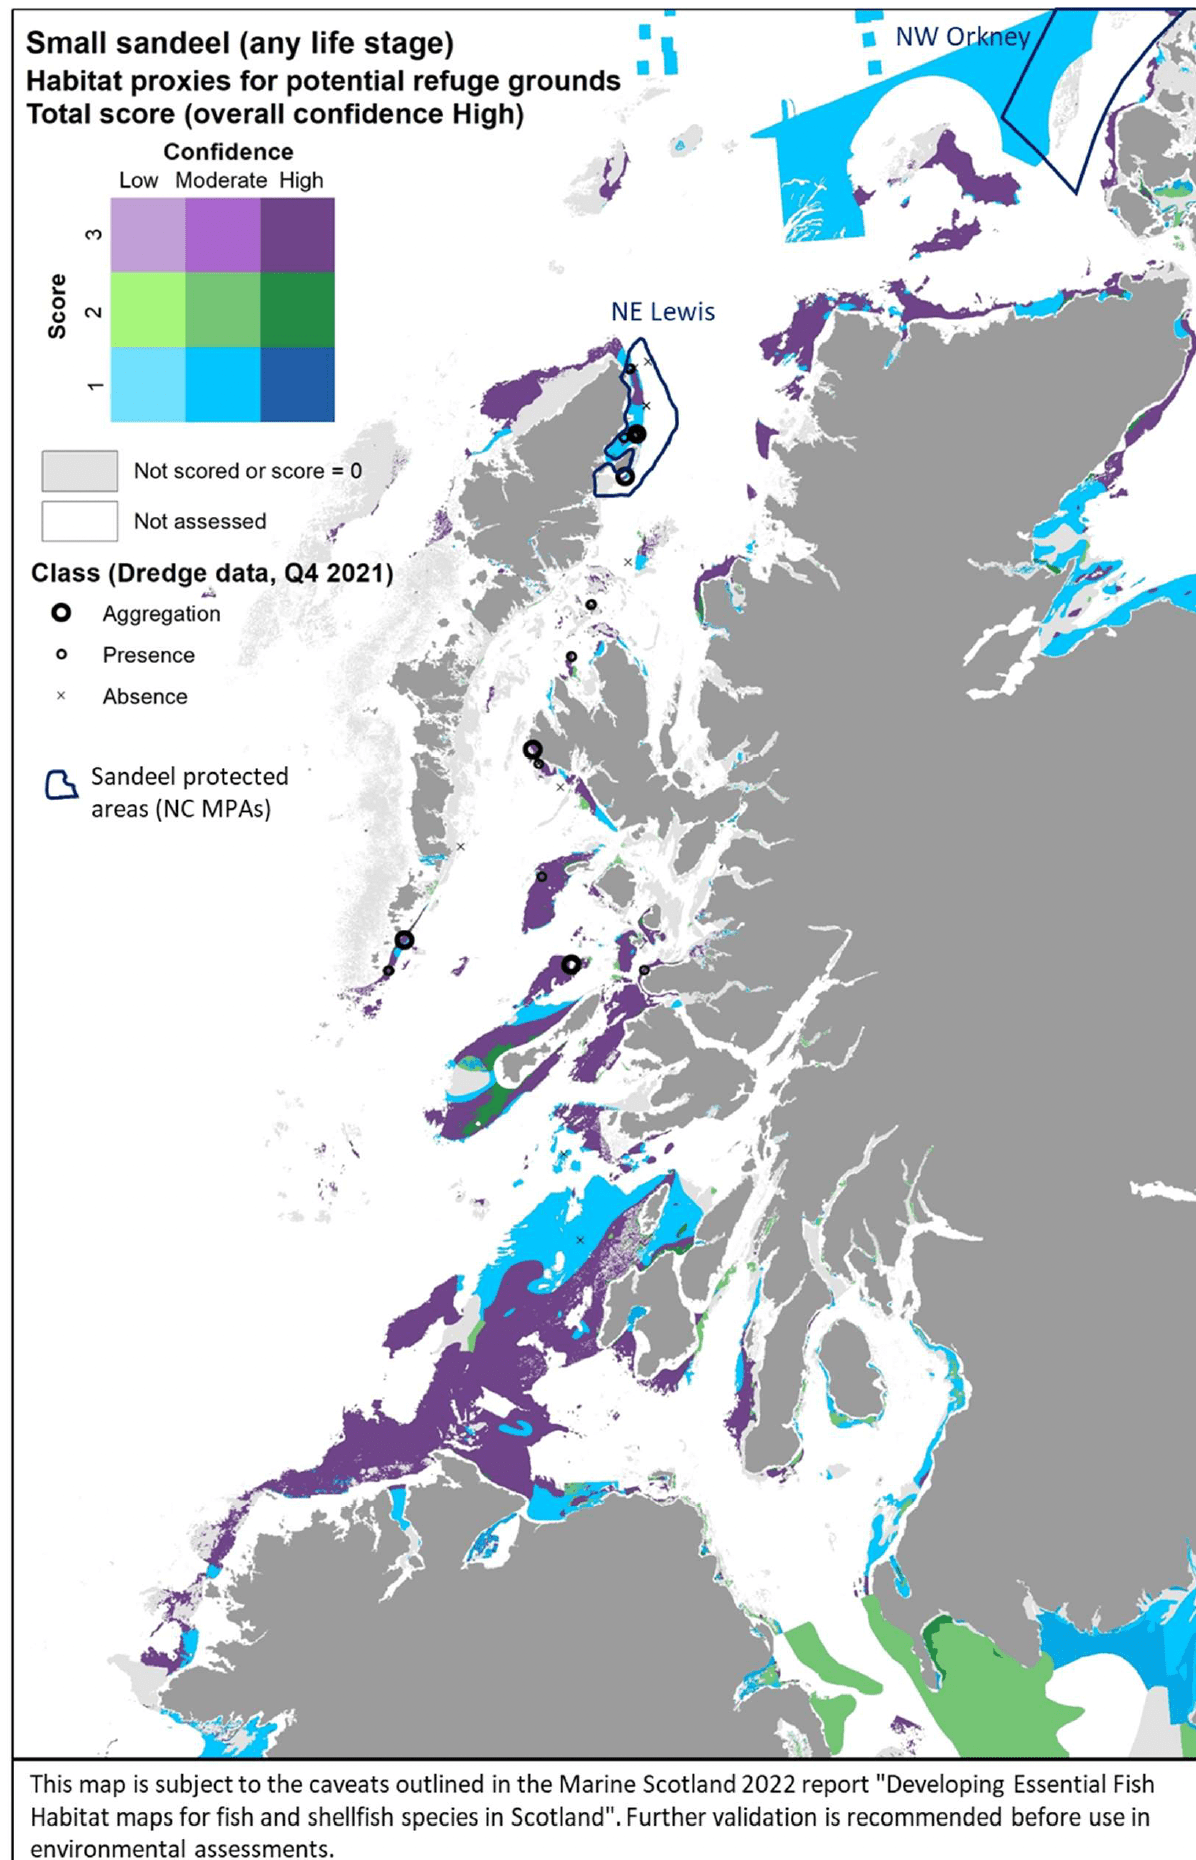
The distribution of the inshore habitat proxies for A. tobianus in the case study area is mapped in Figure 20, compared with the distribution of sandeel aggregations from the 2021 Sandeel dredge survey in the area. The mapped habitat proxies seem to accurately match the occurrence of sandeel in the survey where this was undertaken, although the habitat proxies indicate wider areas than where sandeels were found in the survey. It should be noted that data from Sandeel Dredge surveys report catches for generic "sandeel". This likely includes A. tobianus, although A. marinus is considered to be predominant (ICES 2010). As the habitat requirements between the two sandeel species are very similar (see literature review, Annex 1), the map in Figure 20 can be considered to include potentially generic sandeel (multiple species) habitat occurring inshore. No stakeholder feedback was received on this map following consultation.
| Small sandeel – Habitat proxies for function as refugia (High confidence overall) |
|---|
| EUNIS Habitat type (score /confidence) |
| A5.1 Sublittoral coarse sediment(3/H) A5.12 Sublittoral coarse sediment in variable salinity (estuaries) (3/H) A5.13 Infralittoral coarse sediment (2/H) A5.15 Circalittoral coarse sediment (3/H) |
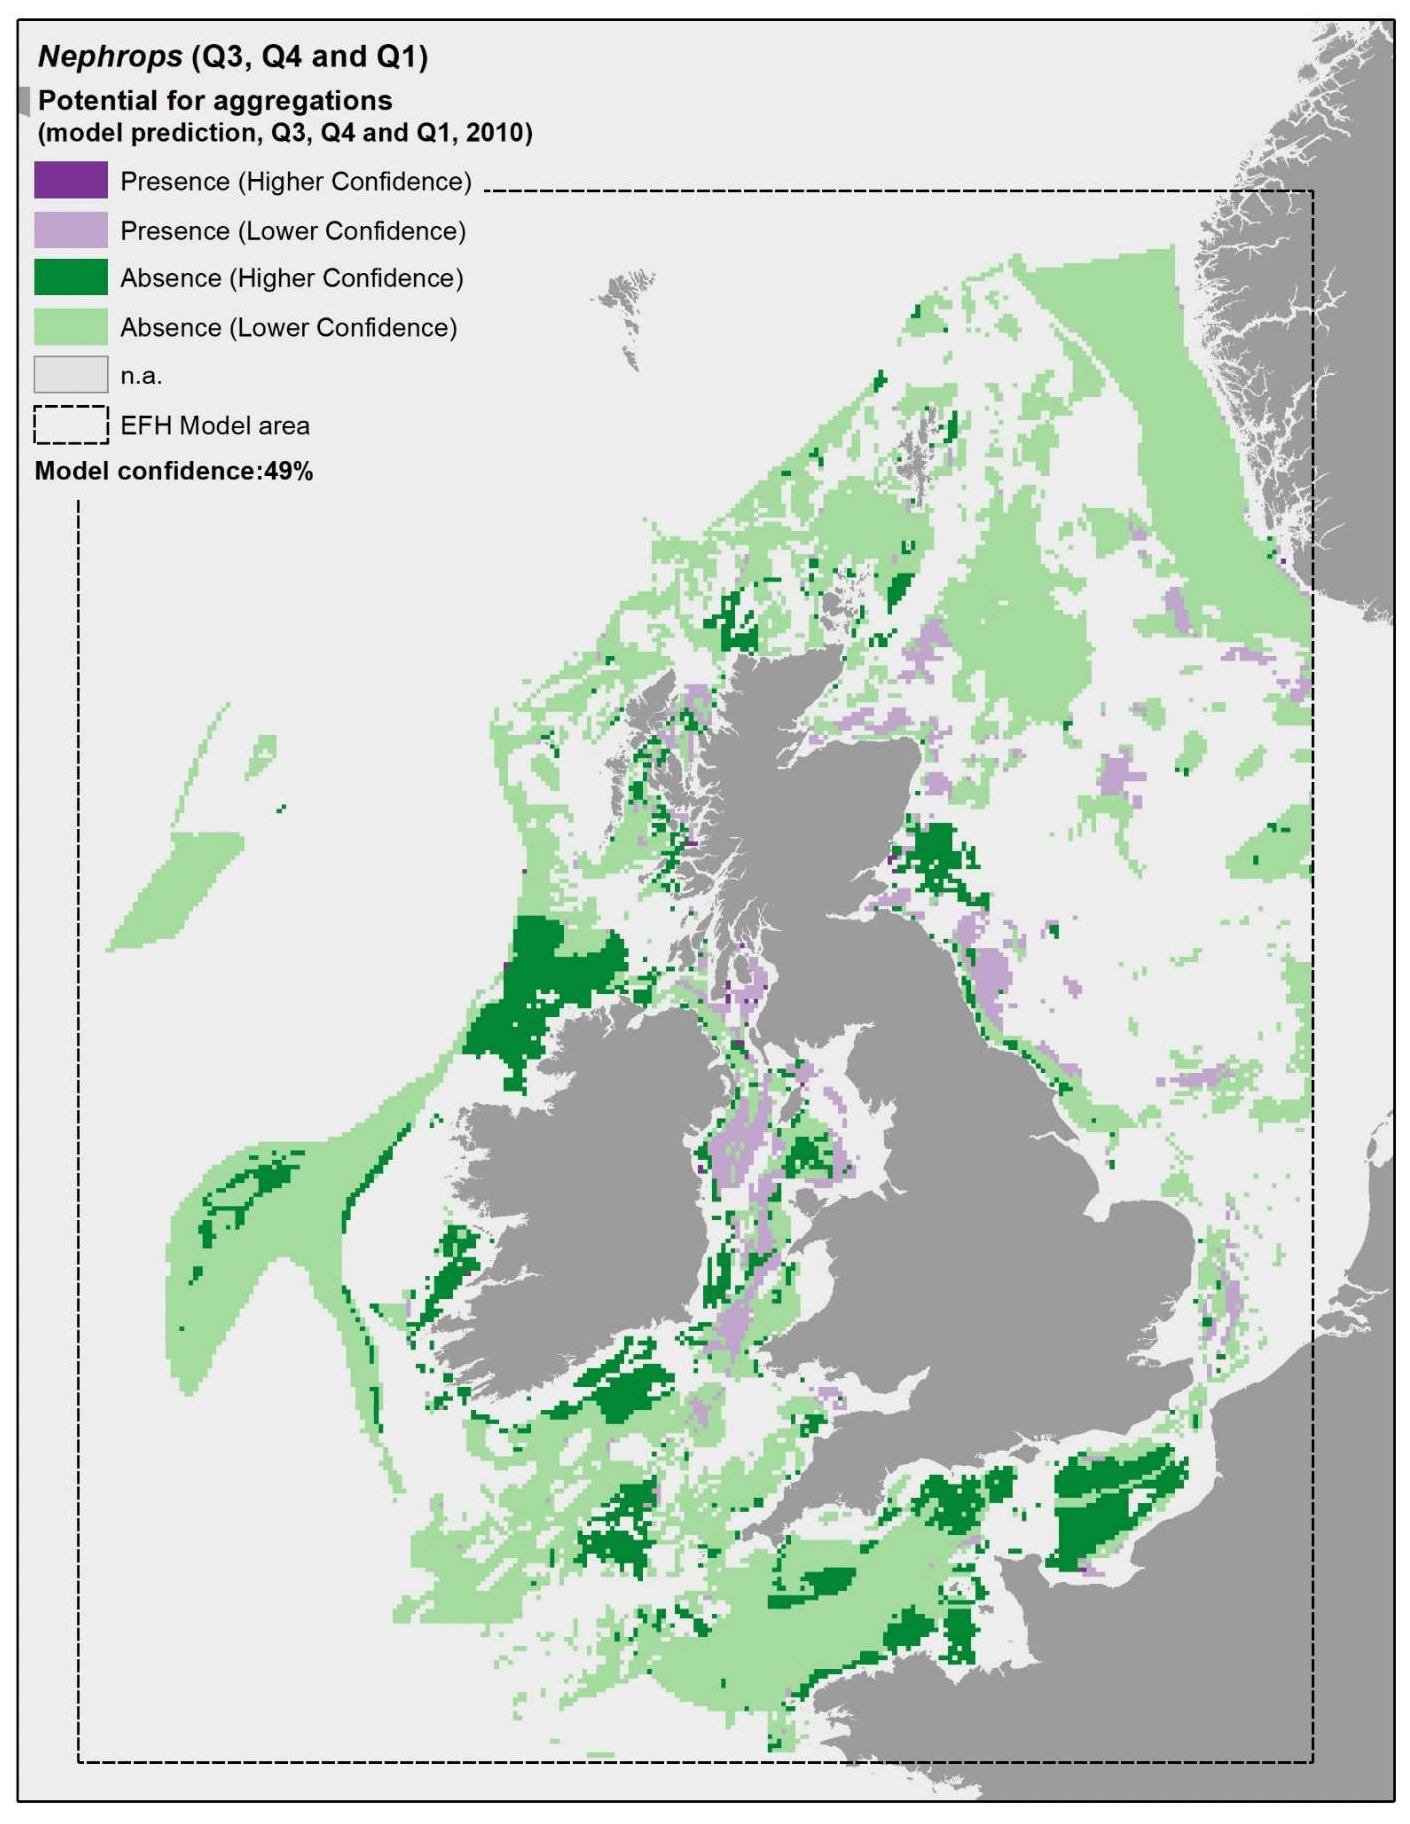
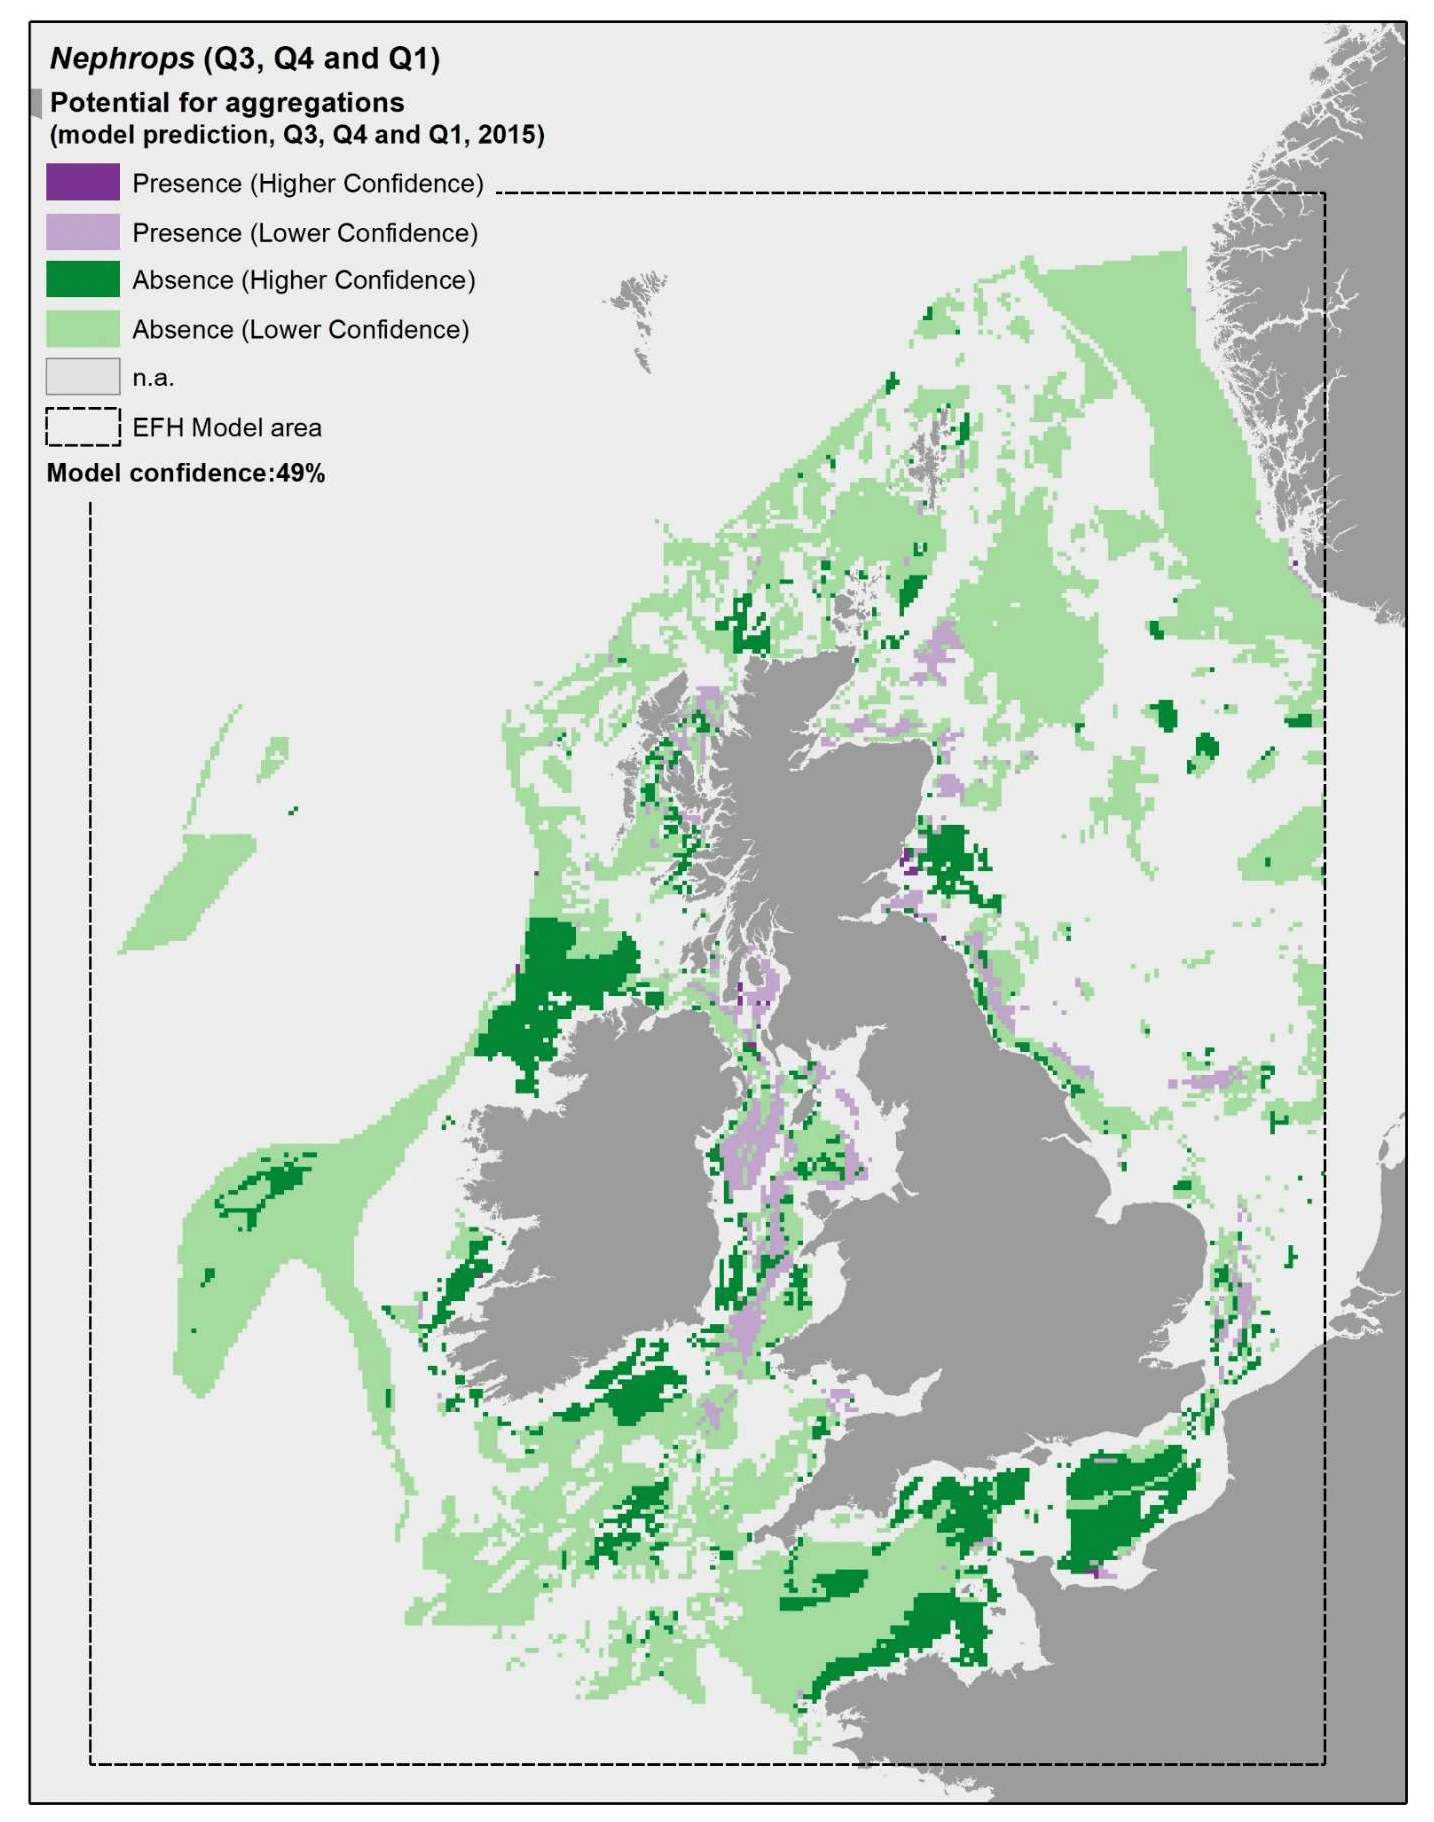
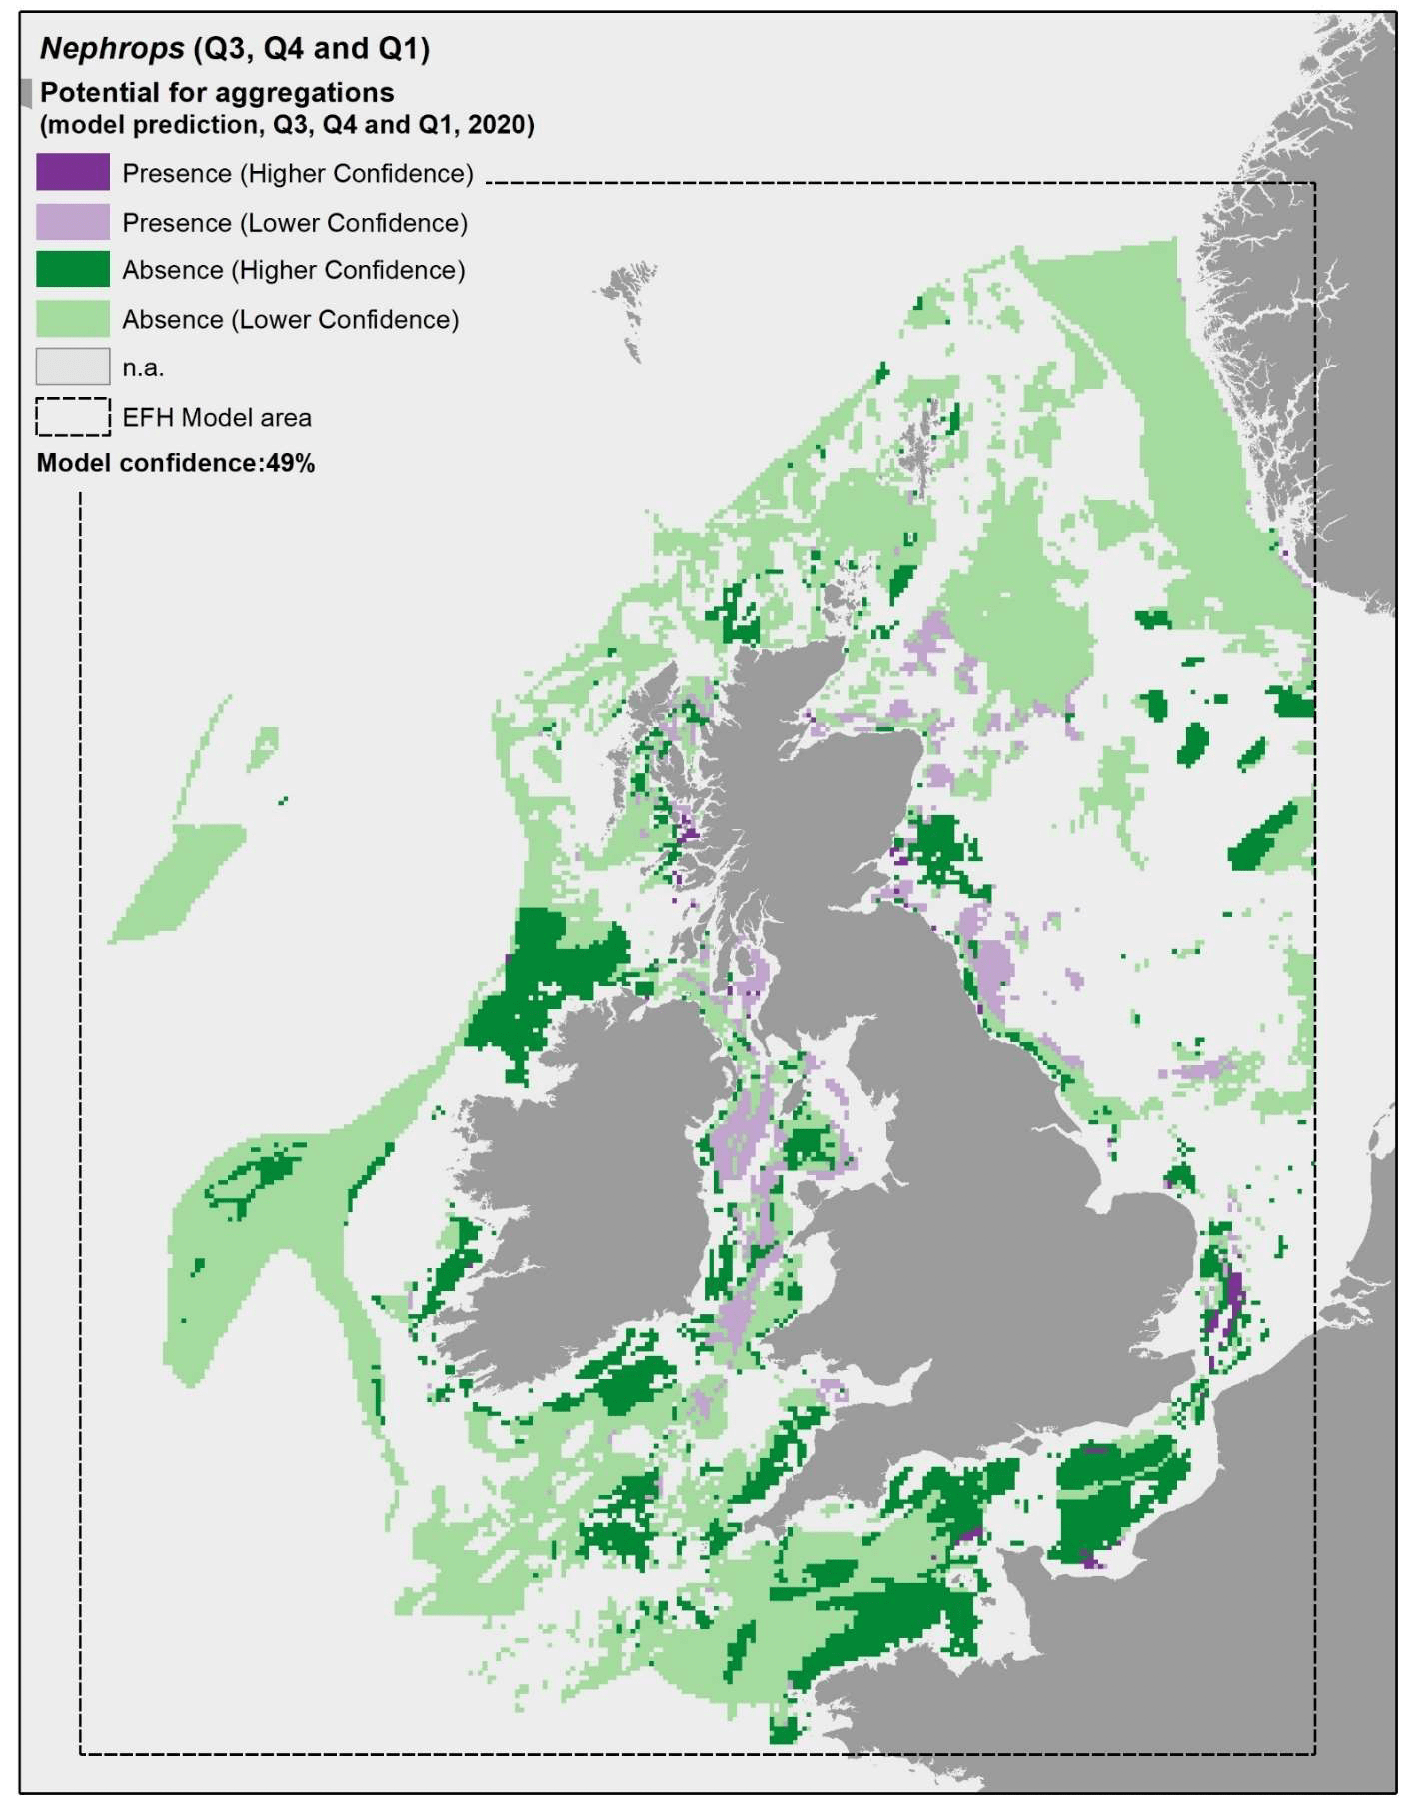
3.1.3 Norway lobster, Nephropsnorvegicus
Norway lobster (Nephrops norvegicus, Linnaeus 1758), hereafter referred to as "Nephrops", is a benthic crustacean of high commercial importance, mostly found offshore at depths varying between 20 and 800 m (Annex 1). Its ecology is dominated by a territorial and burrowing behaviour, whereby Nephrops constructs and defends burrows in muddy substrata, which provide important refuge from predators. The species spends much of its time in the burrows, emerging from them for feeding or mating (Annex 1).
Nephrops was assessed using the model approach, with the distribution of aggregations of the species in summer to winter bottom trawl surveys being used as indicator of potential important habitats with higher value as refugia. It is acknowledged that bottom trawl surveys are not ideal to identify Nephrops burrow areas, particularly given the highly irregular patterns in burrow emergence. As such, bottom trawl survey data might underestimate the distribution of the Nephrops habitat, as a zero catch might also be obtained where burrows are present but Nephrops has not emerged from them.
Underwater TV surveys are commonly used in estimating the abundance of Nephrops, as this type of survey is directed at burrow counting henceforth not affected by varying emergency patters. However, underwater TV survey data became available too late in the project and could not be used to calibrate the model, so that bottom trawl survey data were used instead. The limitation of this latter type of data was taken into account in the assessment of confidence associated with the modelling.
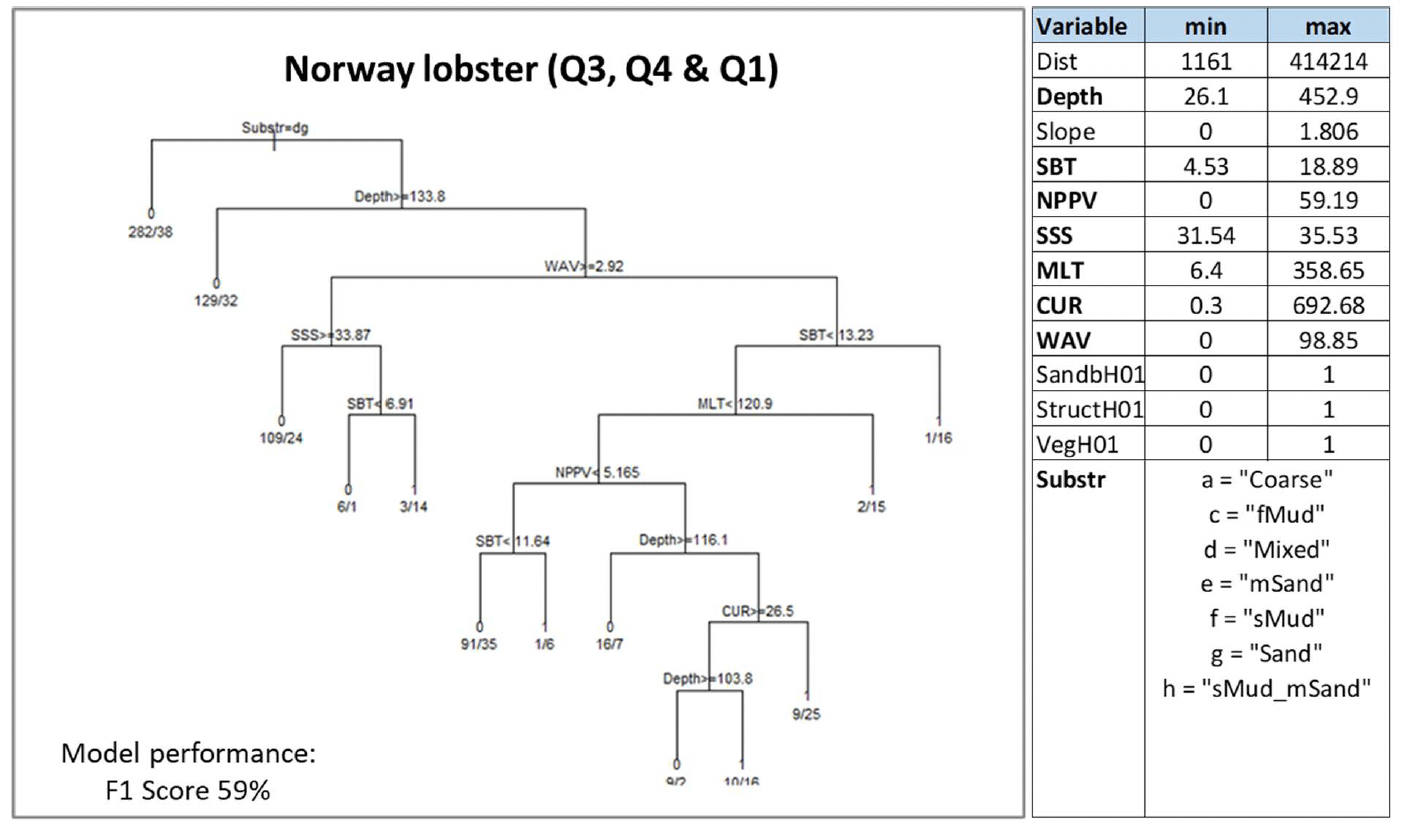
As expected, substratum type was the most important predictor of Nephrops aggregations. Aggregations were predicted to be absent from areas with sandy and mixed sediments, and to occur in all the other sedimentary substrata covered by the surveys (Figure 21). The latter mostly included sediments with a discernible mud component, as expected, although it is of note that coarse substrata were also included. The latter (coarse substrata) does not agree with the known substratum preferences for Nephrops (muddy sediment), and might have resulted from bottom trawl catches obtained from hauls that covered muddy habitat patches (with high Nephrops density) interspersed within a wider area of predominantly coarser sediment hence leading to the overall trawled area being classed as coarse sediment. The inclusion of coarse sediment as a potentially suitable substratum for Nephrops in the model likely contributed to lowering the model predictive performance (as per statistical validation; Figure 21) and the overall confidence associated with the model prediction as a whole (Figure 22).
Depth (Depth), temperature (SBT) and wave energy (WAV) at the seabed were also important predictors. Aggregations of Nephrops were generally predicted to occur in shallower conditions (<134 m depth) and, with the highest probability (0.94), at very low wave energy (<2.9 N m2/s), consistent with conditions for mud deposition, and higher seabed temperature (monthly mean across the summer, autumn and winter seasons ≥13.2°C). Salinity (SSS), the mixing of the water column (MLT), primary production (NPPV) and current energy at the seabed (CUR) also contributed to predict aggregations of Nephrops with different combinations as shown in the decision tree (Figure 21).
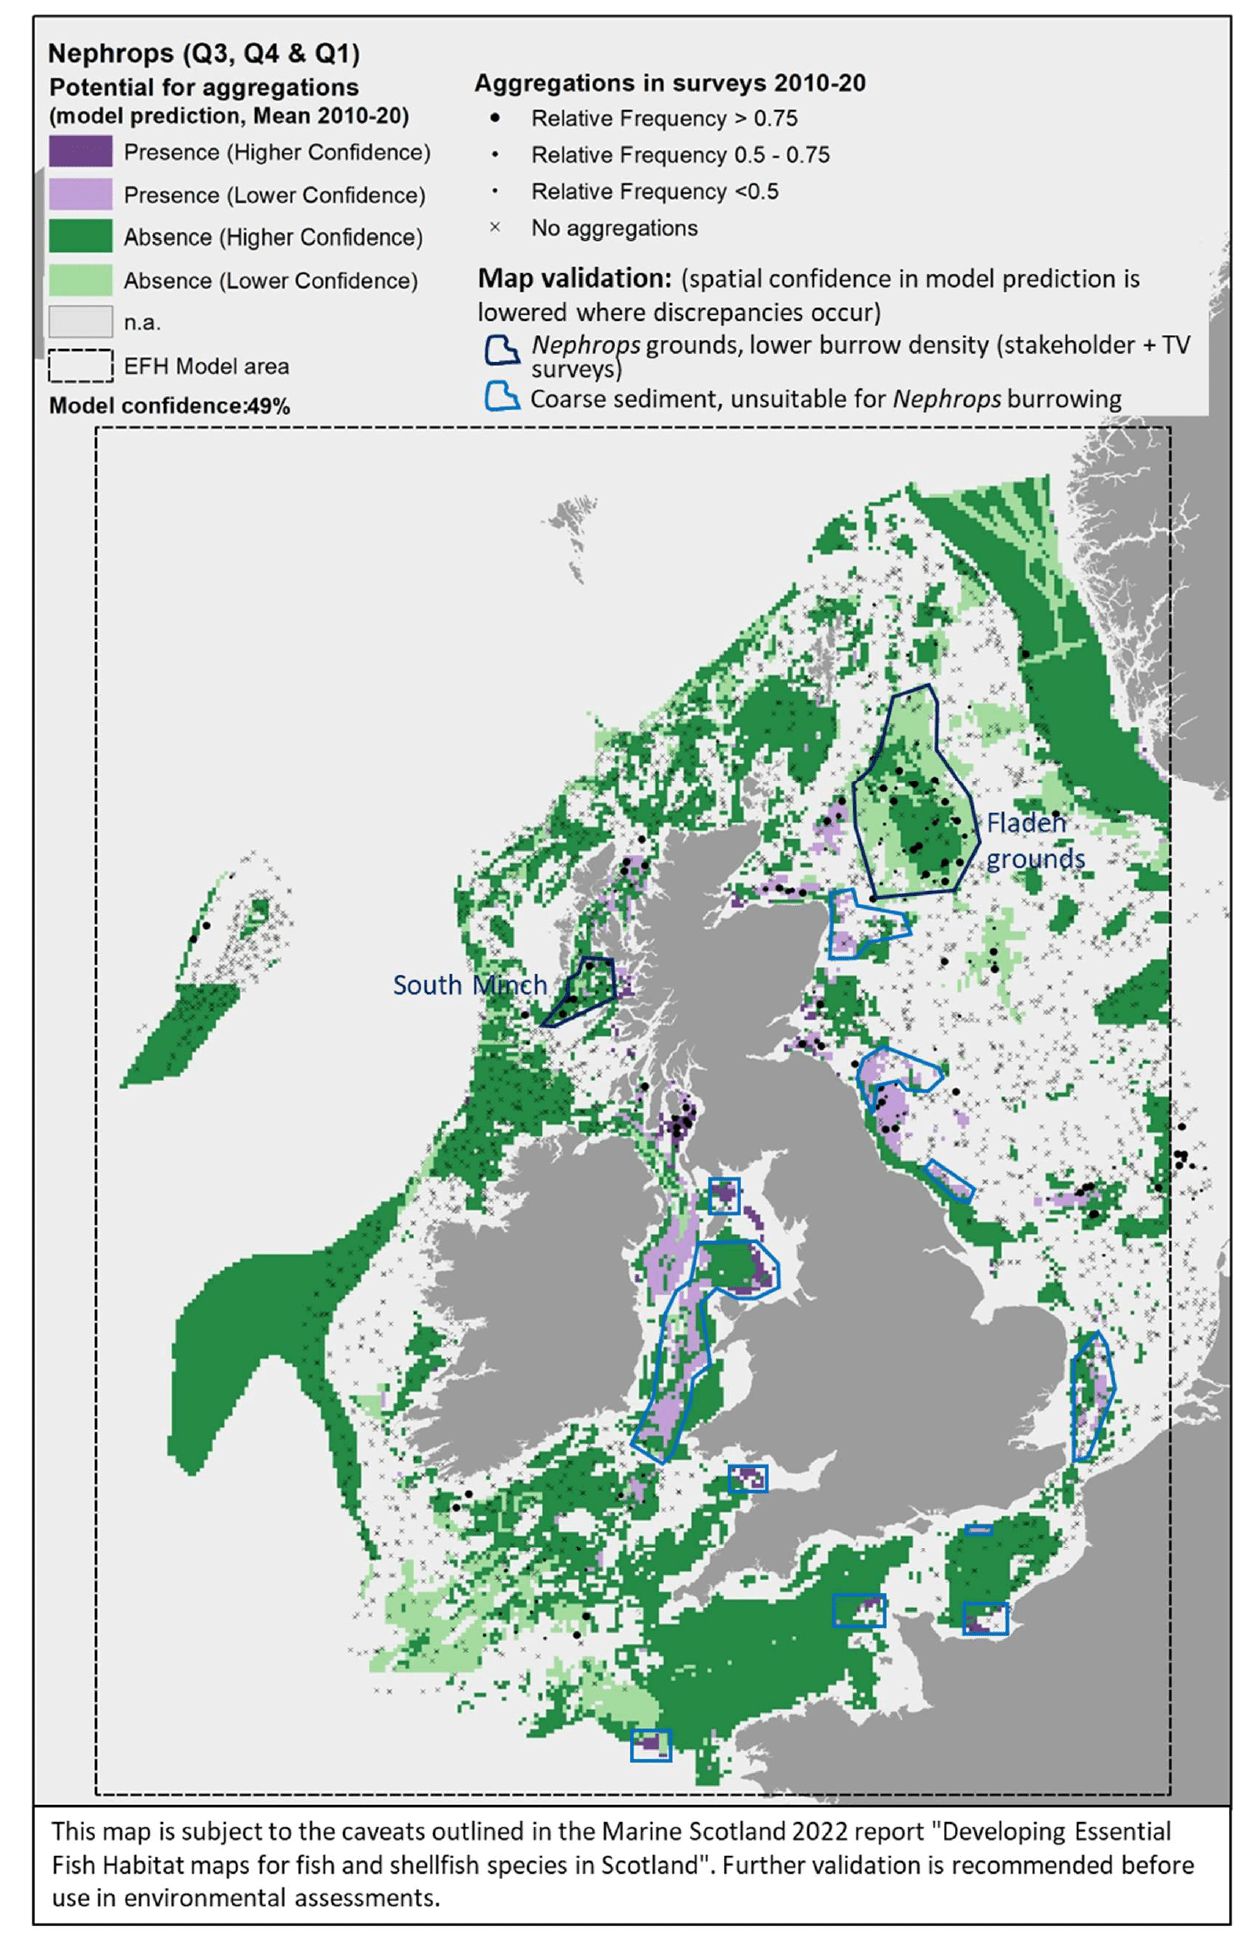
The model prediction applied to the mean environmental conditions of the period 2010 - 2020 (summer to winter) allowed to map the potential distribution of Nephrops aggregations as an indication of potential location of higher value refugia (burrows) habitats (Figure 22).
Comparison with available survey data (both bottom trawl surveys considered for the model calibration and additional Nephrops TV burrow surveys in Scottish waters; Appendix C, Figure C4 and Figure C5) with well known Nephrops grounds (as identified by the survey data; Appendix C, Figure C6), highlighted during the consultation by stakeholders, has highlighted some inaccuracies in the map (Figure 22).
The predicted map appeared to capture well Nephrops aggregations on known grounds in inshore Scottish waters (e.g. Firth of Forth, Clyde, Moray, Inner Hebrides, the North Minch, and the eastern region of the South Minch) and in the Irish Sea (off the coast of Cumbria and in the north west Irish Sea). As confirmed by TV surveys in Scottish waters, these are Nephrops grounds characterised by higher burrow densities, hence confirming the ability of the map to identify Nephrops grounds of higher value (per unit area) in shallower waters (<130 m depth).
In turn, the map prediction failed to identify aggregations on deeper areas such as those at Fladen and in the western regions of the South Minch, where TV surveys confirmed the extensive distribution of Nephrops burrows (Appendix C, Figure C5). However, burrow density in these areas is lower compared to the other Scottish areas mentioned above, and this also corresponded to lower abundance of Nephrops individuals in the trawl catches, leading to the absence of aggregations as predicted by the EFH model.
Stakeholder feedback highlighted that there are different stocks of Nephrops with different abundance and variable connectivity, and suggested the model could be improved by analysing the data on a stock-by-stock basis rather than on a species basis. The analysis undertaken in this project partly accounted for stock variability between wider regions (by identifying aggregations separately for data collected from different surveys in different geographical areas, e.g. North Sea and Scottish West Coast). However, in some cases, this may not have been sufficient to discriminate between stocks occurring in the same region (e.g. Nephrops populations in Fladen grounds and Firth of Forth), with the resulting model better capturing the EFH distribution for higher-density stocks compared to the lower- density ones.
As mentioned before, the model for Nephrops aggregations also identified coarse sediments amongst suitable substrata, which does not match with the known requirements of the species. This has likely contributed to the lower statistical predictive performance (59%) and the resulting moderate overall confidence (49%) associated with this model. The inclusion of coarse sediment amongst potentially suitable conditions has led to predictions of the distribution of potential habitats of higher value as refugia (burrows) for Nephrops in certain areas that are not knows to support such resource. These areas have been indicated in the map and a lower confidence is attached to these areas.
Model predictions were further explored through the use of more accurate environmental scenarios for the summer to winter period in individual years (examples for 2010, 2015 and 2020 are shown in Figure 23, Figure 24 and Figure 25, respectively). The resulting maps were generally consistent with the average map in Figure 22, with only a minor improvement of the prediction of presence on the south west margins of the Fladen grounds in 2020 (Figure 25). The highest importance of substratum type as a model predictor for Nephrops aggregations is likely to account for this result, as this is a persistent environmental variable that does not change with time in the maps. This result confirms that the inaccuracies identified on the predicted map (Figure 22) are associated with limitations of the model and the data used to calibrate it (as reflected by the model overall confidence) rather than with inaccuracies in the environmental scenario used to obtain the average map.
3.1.4 Herring, Clupeaharengus
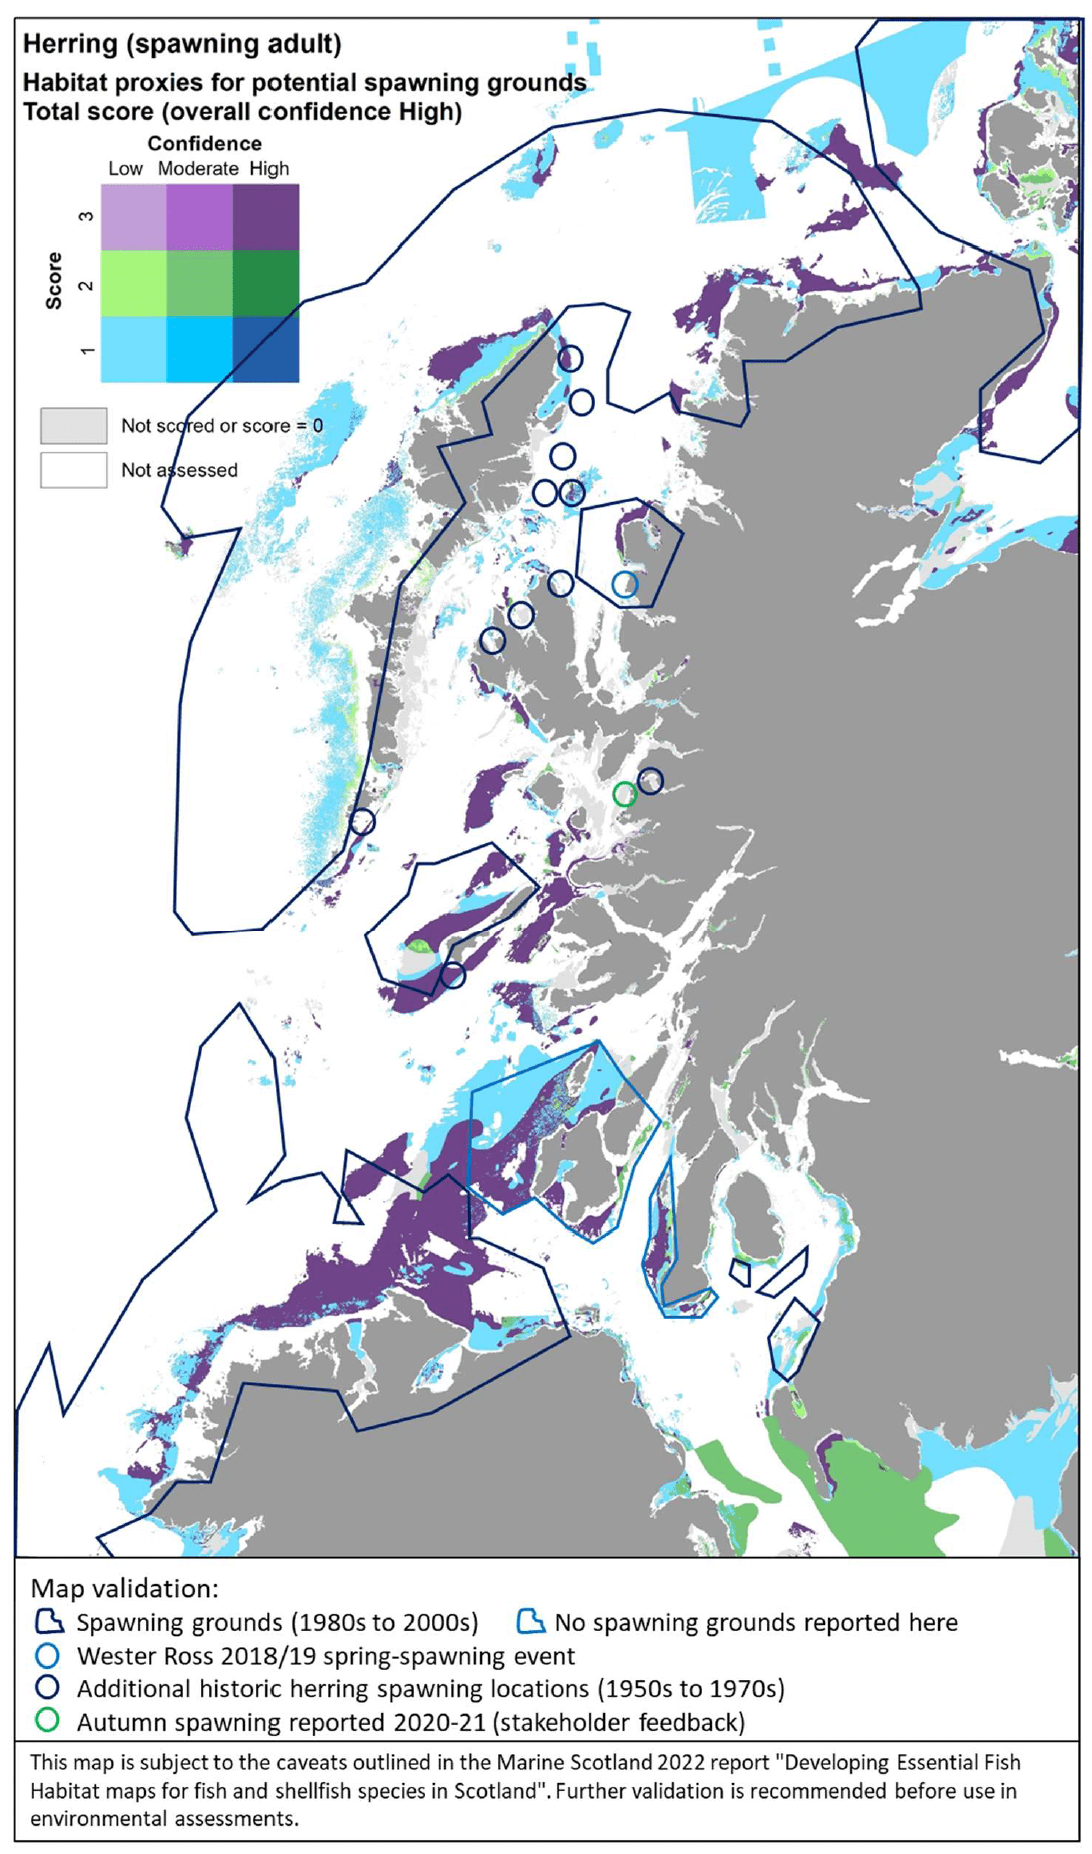
Atlantic herring (Clupea harengus Linnaeus 1758), hereafter referred to as "herring", is a small fish of high commercial importance but also key in supporting marine ecosystems, being a key food resource for top predators (seabirds, marine mammals, predatory fish). As such, it is designated as a Priority Marine Feature in Scotland's seas. Despite being pelagic for most of its life cycle, spawning is undertaken in strict association with the seabed, where dense mats of sticky eggs are laid (Haegele and Schweigert 1985). Spawning grounds are located both inshore and offshore, on a variety of substrata, albeit there is a requirement for these to be free from fine sediment which could prevent egg oxygenation and thus affect embryonic development (Annex 1). Herring shows site fidelity with regards to spawning areas, and its occupation of spawning grounds may contract or expand depending on the status of the stock (Frost and Diele 2022).
In the absence of suitable data to allow the modelling of these spawning habitats offshore[15], herring was assessed by using the habitat proxy approach to identify habitats that may potentially be used by the species for spawning in inshore areas.
Eleven publications were reviewed and provided detailed characterisation of the species' habitat requirements (see Annex 1). This, along with expert input obtained with the stakeholder validation, led to a high confidence in the overall assessment of habitat proxies for herring spawning grounds. There were a variety of habitats identified as potentially highly suitable for herring spawning with high confidence (Table 11). These included coarse sediments and shingles in the infralittoral and circalittoral zones, macrophyte and kelp dominated sediments in the sublittoral, maerl beds, seagrass beds, and areas with a full salinity water column. Further possible habitats, scored with medium to low suitability and medium to low confidence (not shown in Table 11), included other submerged substrata such as mussel beds, biogenic reefs, polychaete worm reefs and sublittoral sands.
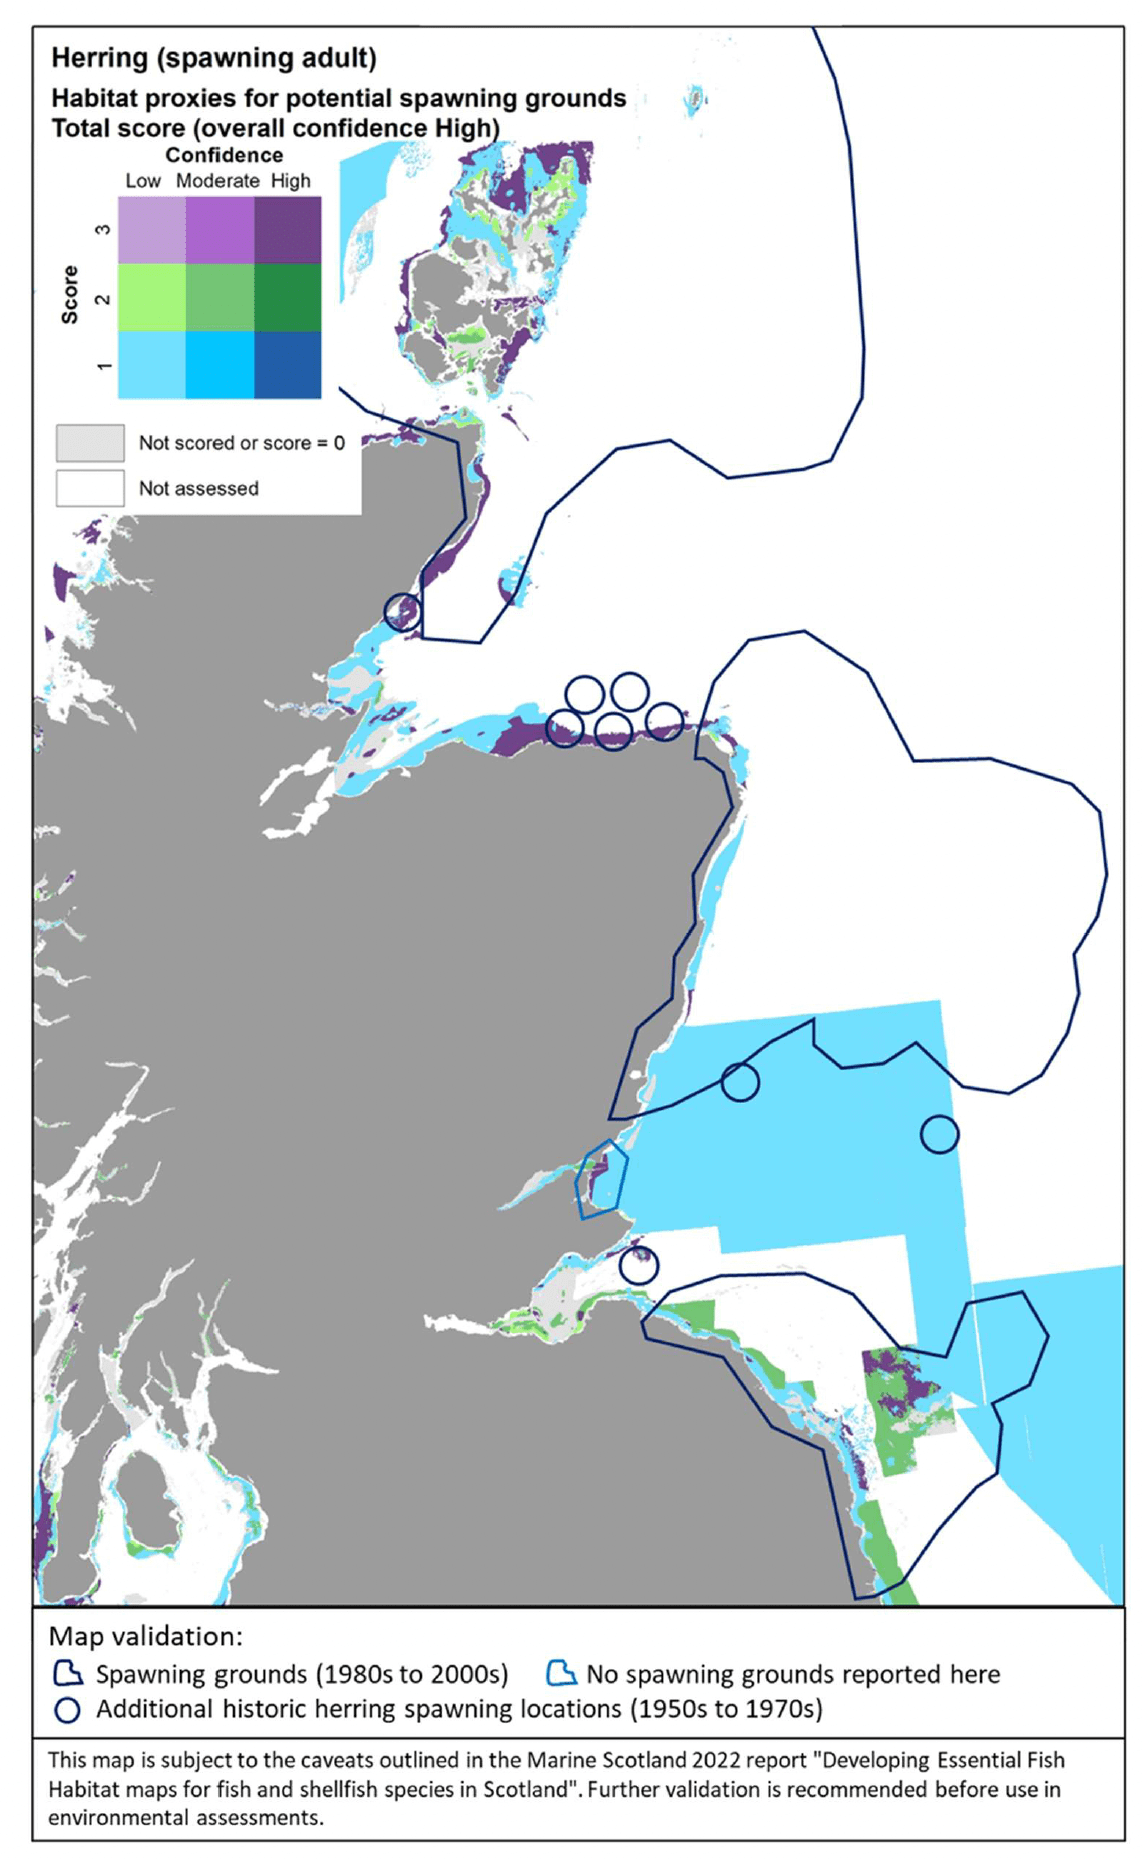
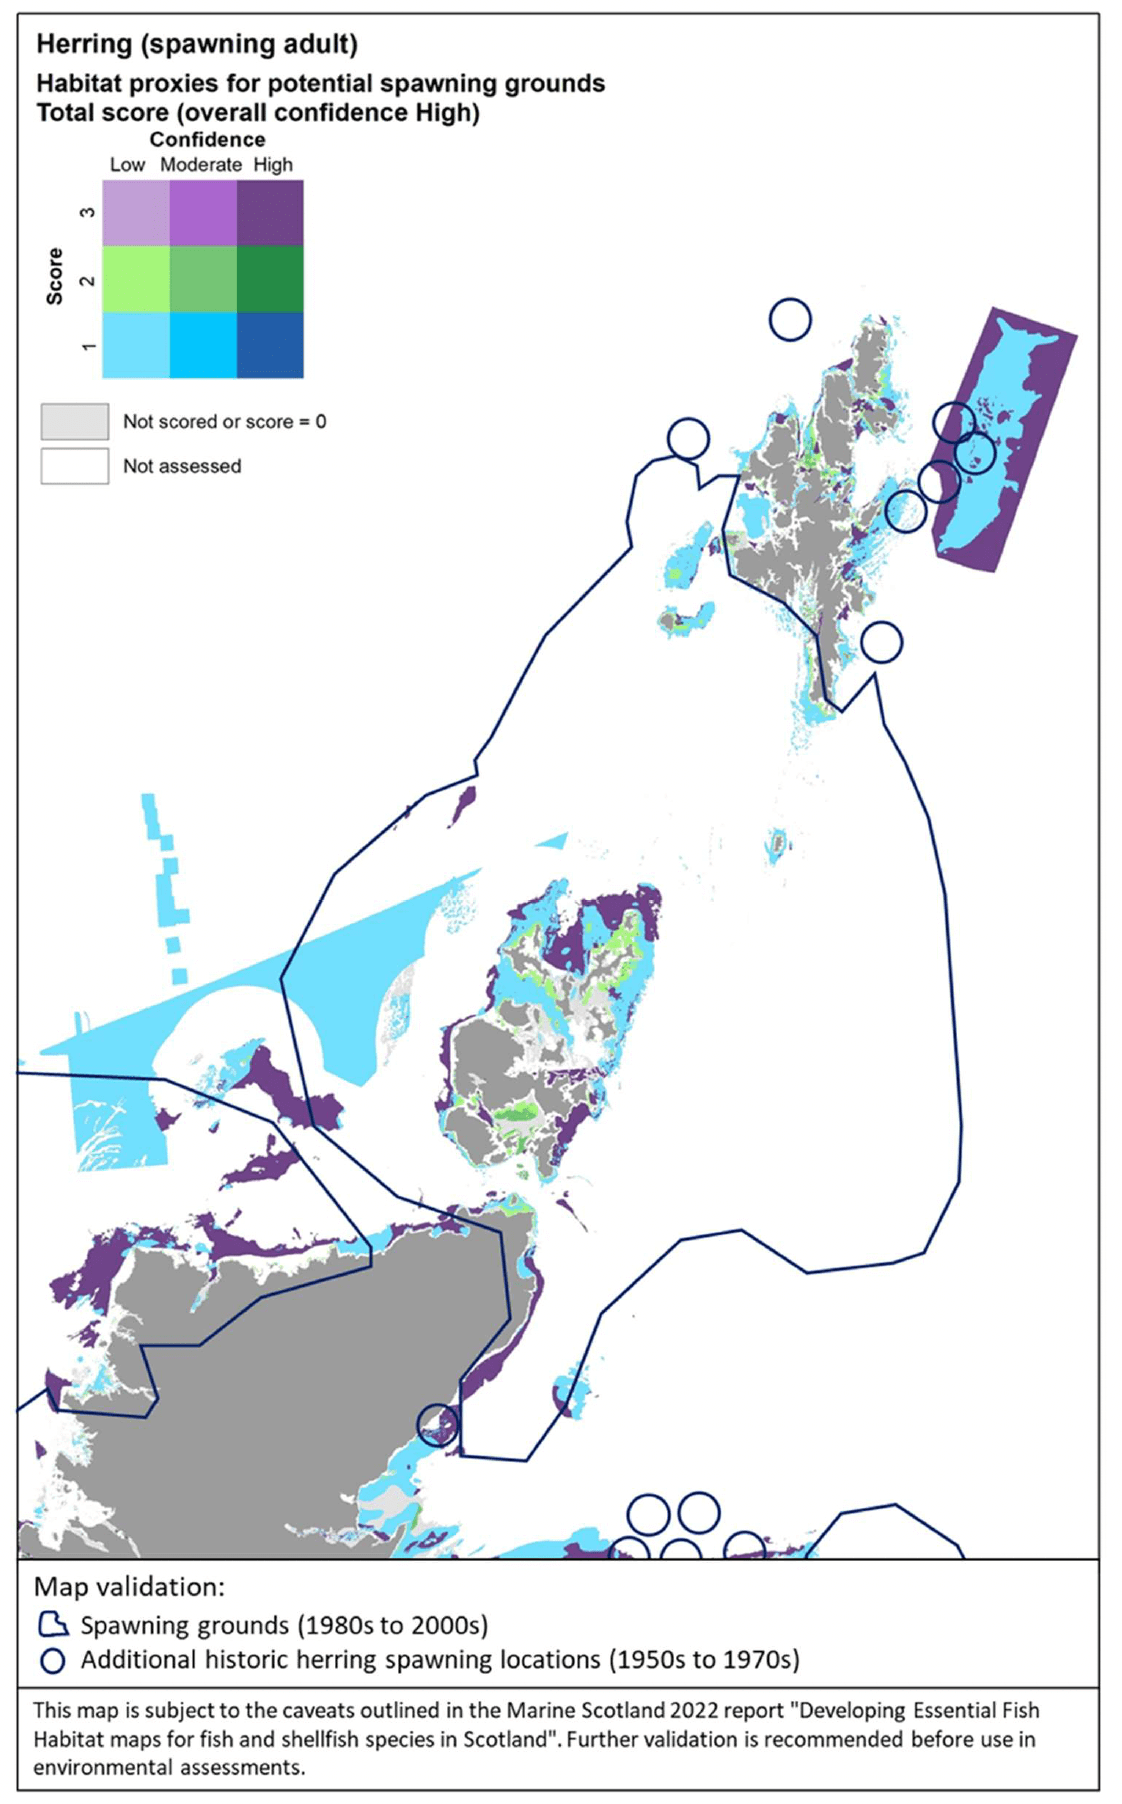
The distribution of the inshore habitat proxies for herring spawning in Scottish inshore waters is mapped in Figure 26 (west coast), Figure 27 (east coast) and Figure 28 (north coast and northern isles). Known current and historical herring spawning grounds in these areas are also shown in the maps as identified by Frost and Diele (2022; Appendix C, Figure C7).
The latter have been included as polygons indicating broad areas identified as recent spawning grounds (i.e. in use between 1980s and 2000s) as well as blue circles marking historical spawning locations (only locations outside the polygons are shown). The recent record of the spring-spawning event observed at Wester Ross in 2018/2019 is also shown in Figure 26.
The habitat proxy maps show that many of the habitat proxies identified for herring spawning are included in broad areas known as spawning grounds, although information on specific spawning locations within these areas is lacking (Frost and Diele 2022). For example, the habitat proxy maps seem to correctly identify known herring spawning grounds located inshore along the north coast of Ireland and around the isles of Tiree and Coll (Figure 26), around Cape Wrath on the north coast (Figure 26, Figure 28), in inshore areas to the east and north of the Moray Firth, south of the Firth of Forth (this latter area is known as Banks spawning grounds) (Figure 27), around Orkney and to the east of Shetland (Figure 28).
However, several areas and locations known for herring spawning appear not to be captured by the habitat proxy map, including, for example, the well-known spawning grounds occurring in the Firth of Clyde (Figure 26) or the Buchan spawning grounds off the Aberdeen coast (Figure 27). The location of the recent spring-spawning event observed in 2018/2019 in the Wester Ross area also seems not to be identified by the habitat proxies, although the habitat proxy map correctly identifies the presence of spawning grounds in the Wester Ross coastal area north of this location, where herring spawning has been identified both recently and historically (Figure 26; Appendix C, Figure C7).
It is clear that the mapped habitat proxies provide a limited view of the herring spawning grounds as they lack full coverage of inshore and offshore areas where such EFH may occur. As the habitat proxy assessment in this study was focused on inshore waters, EUNIS habitats classed as offshore (deeper) circalittoral habitats were excluded a priori from the assessment (see section 2.3.1), leading to the gaps of coverage in offshore waters (white areas identified as 'Not assessed' in the maps). In Scottish waters, these deeper habitats also occur inshore, thus accounting for the gaps of coverage of some of the coastal areas and locations where herring spawning is known to occur. Accordingly, this demonstrates the importance of taking into consideration all the lines of evidence shown in Figure 26, Figure 27 and Figure 28 when considering the (actual and potential) distribution of the herring spawning resource.
In turn, there are additional areas in the map where potentially suitable habitats for herring spawning have been identified, but their actual use appears not to be supported by recent and historic data. It is possible that these additional areas identified in the habitat proxy map present conditions (other than the factors accounted for by the EUNIS habitat classification, i.e. depth zone, type of substratum, energy) that have prevented the use of these areas so far. However, these areas may provide potential for expansion of the spawning grounds, should the conditions and availability of the existing spawning grounds change in the future (e.g. due to natural or anthropogenic processes affecting the seabed and environmental conditions). The expansion or contraction of the spawning grounds occupied by the species is also known to depend on the status of the stock (Frost and Diele 2022).
While the present study was being undertaken, Marine Scotland Science has been developing an alternative method accounting for larval transport and connectivity to map herring spawning areas in a separate project undertaken in collaboration with NatureScot[16]. This project has combined 46 years (1972-2017) of herring larvae catch data held by ICES with herring age model (to relate larval size to age) and particle tracking simulations of larvae to identify potential herring spawning grounds across Scottish Shelf Seas. The final outputs of the aforementioned study were not available when this report was being written, but consultation with the project leads was undertaken to identify possible similarities and differences between our respective results. Their results are also based on model predictions and extrapolation rather than on actual observations of spawning grounds, and may be influenced by larval sampling limitations (e.g. sampling locations and seasonality; O'Hara Murray, pers. comm.). Therefore, although a comparison was undertaken, they were not included in the validation of the habitat proxy maps. Despite the difference in source data and in the modelling approach, the spatial results of both studies seem to converge in identifying potential spawning grounds along the northwest coast of Lewis, west of Lewis, Harris and Uists, on the southern tip of the Outer Hebrides (Bara), along the northwest coast of mainland Scotland and the Minch (down as far as Skye) and the northern mainland Scotland coast, around Orkney (especially to the west), the coastal area to the east of the Moray Firth, and the Banks spawning grounds, south of the Firth of Forth. Larval modelling also showed some overlap of predicted spawning grounds in the marine area located approximately 30 nautical miles offshore to the west of Islay and north of Donegal (Ireland). The larval model also identified potential spawning grounds off the Hebrides of Mull, Coll, Tiree and the small isles, as identified by the habitat proxies in this study, but only as occasional features in certain years (e.g. 1981 and 1993) and not as a permanent feature across all the 46 years modelled. In contrast with the habitat proxy maps, the larval modelling did not identify herring spawning grounds in inshore areas around Islay and Mull of Kintyre, or to the east of Shetland, whereas it successfully identified the Buchan spawning grounds. These results from the larval model seem to agree with the locations of recent spawning grounds as identified in Frost and Diele (2022), which were considered for the validation of the habitat proxy maps.
| Herring – Habitat proxies for spawning function (High confidence overall) |
|---|
| EUNIS Habitat type (score /confidence) |
| A2.1 Littoral coarse sediment(3/H) A2.11Shingle(pebble)andgravelshores(3/H) A5.1 Sublittoralcoarsesediment(3/H) A5.13 Infralittoralcoarsesediment(3/H) A5.14 Circalittoral coarse sediment(3/H) A5.5 Sublittoral macrophyte-dominated sediment(3/H) A5.51 Maerl beds(3/H) A5.52 Kelp and seaweed communities on sublittoral sediment (3/H) A5.53 Sublittoral seagrass beds (3/H) A7.3 Completelymixedwatercolumnwithfullsalinity(3/H) A7.33 Completely mixed water column with full salinity & long residence time (3/H) |
3.1.5 Plaice, Pleuronectesplatessa
Plaice (Pleuronectes platessa Linnaeus 1758), also known as European plaice, is a benthic flatfish of high commercial importance, found both inshore and offshore (Annex 1).
Dependence on intertidal and shallow subtidal sedimentary substrata in inshore areas has been reported particularly for juveniles of the species, which use these areas as nursery grounds between the spring and autumn (Annex 1).
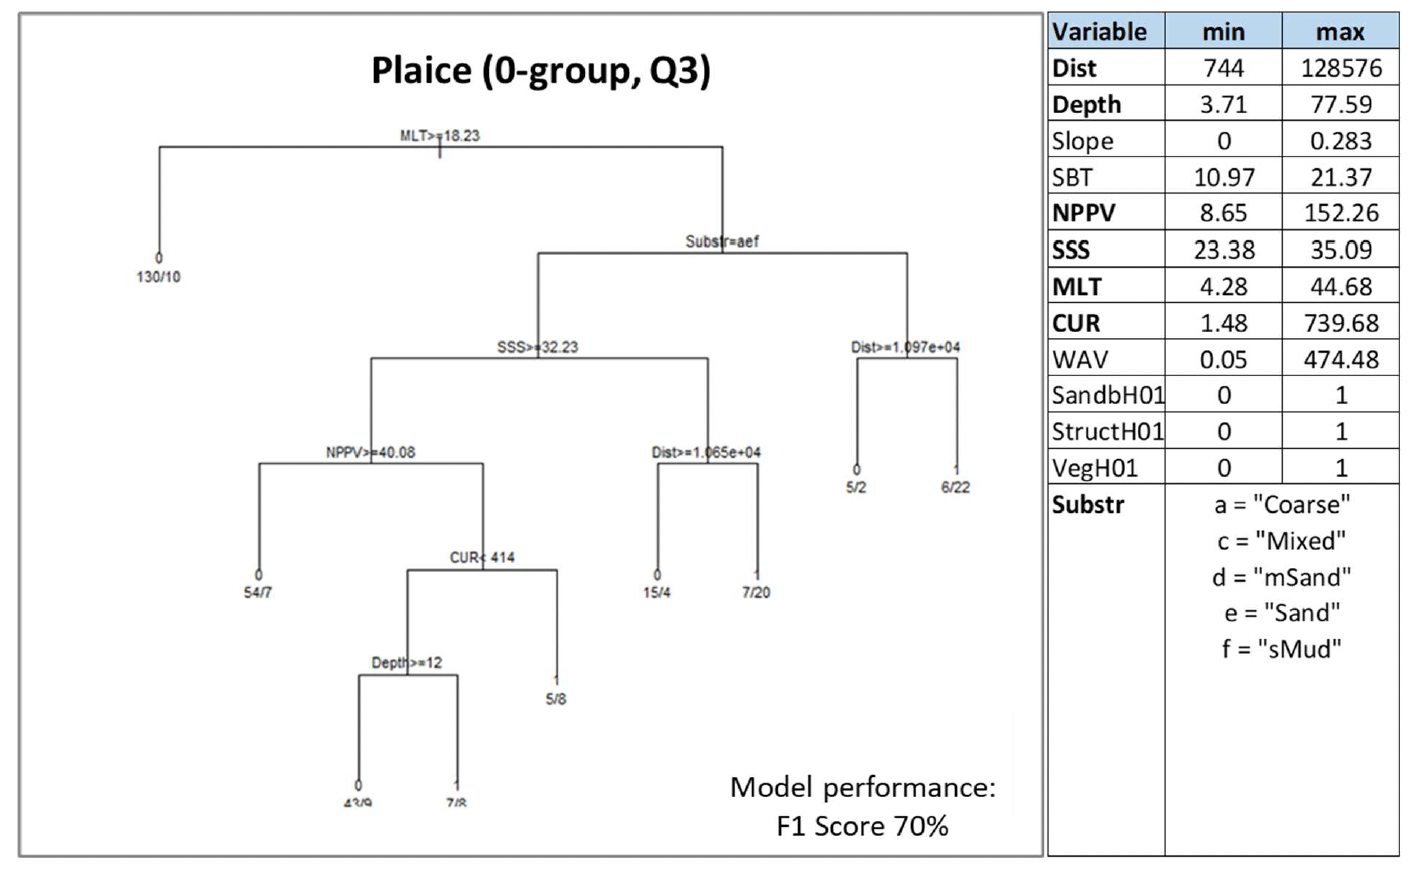
Plaice was assessed by using both the data-based model and the habitat proxy approach. The former allowed modelling of the distribution of aggregations of juveniles of the species in summer as indicator of potential higher value habitats used as nurseries. Individuals <12 cm in length were considered to identify 0-group, recently metamorphosized plaice in summer catches from beam trawl surveys. The habitat proxy approach also allowed identification of habitats potentially used by the juveniles of the species, with better coverage of inshore habitats.
Water column mixing (MLT), distance from the shore (Dist) and depth were the most important predictors of juvenile plaice aggregations, followed by primary production (NPPV) and substratum type (Substr), and salinity (SSS) and current energy at the seabed (CUR) (Figure 29). Juvenile aggregations were generally predicted to occur in habitats with lower mixing of the water column (MLT <18.2 m), and, with the highest probability (0.78), on mixed sediment and muddy sand substrata within 11 km distance from the shore. On other sedimentary substrata (including coarse sediment, sand and sandy mud), juvenile aggregations were predicted to occur in different combinations of environmental conditions, including for example lower/mixed salinity (<32.2, down to 23.4) within 10 km distance from the shore, or in moderate current energy conditions or shallower depth (<12 m depth) in areas with lower primary production (NPPV <40.1 mg C m-3 day-1) (Figure 29).
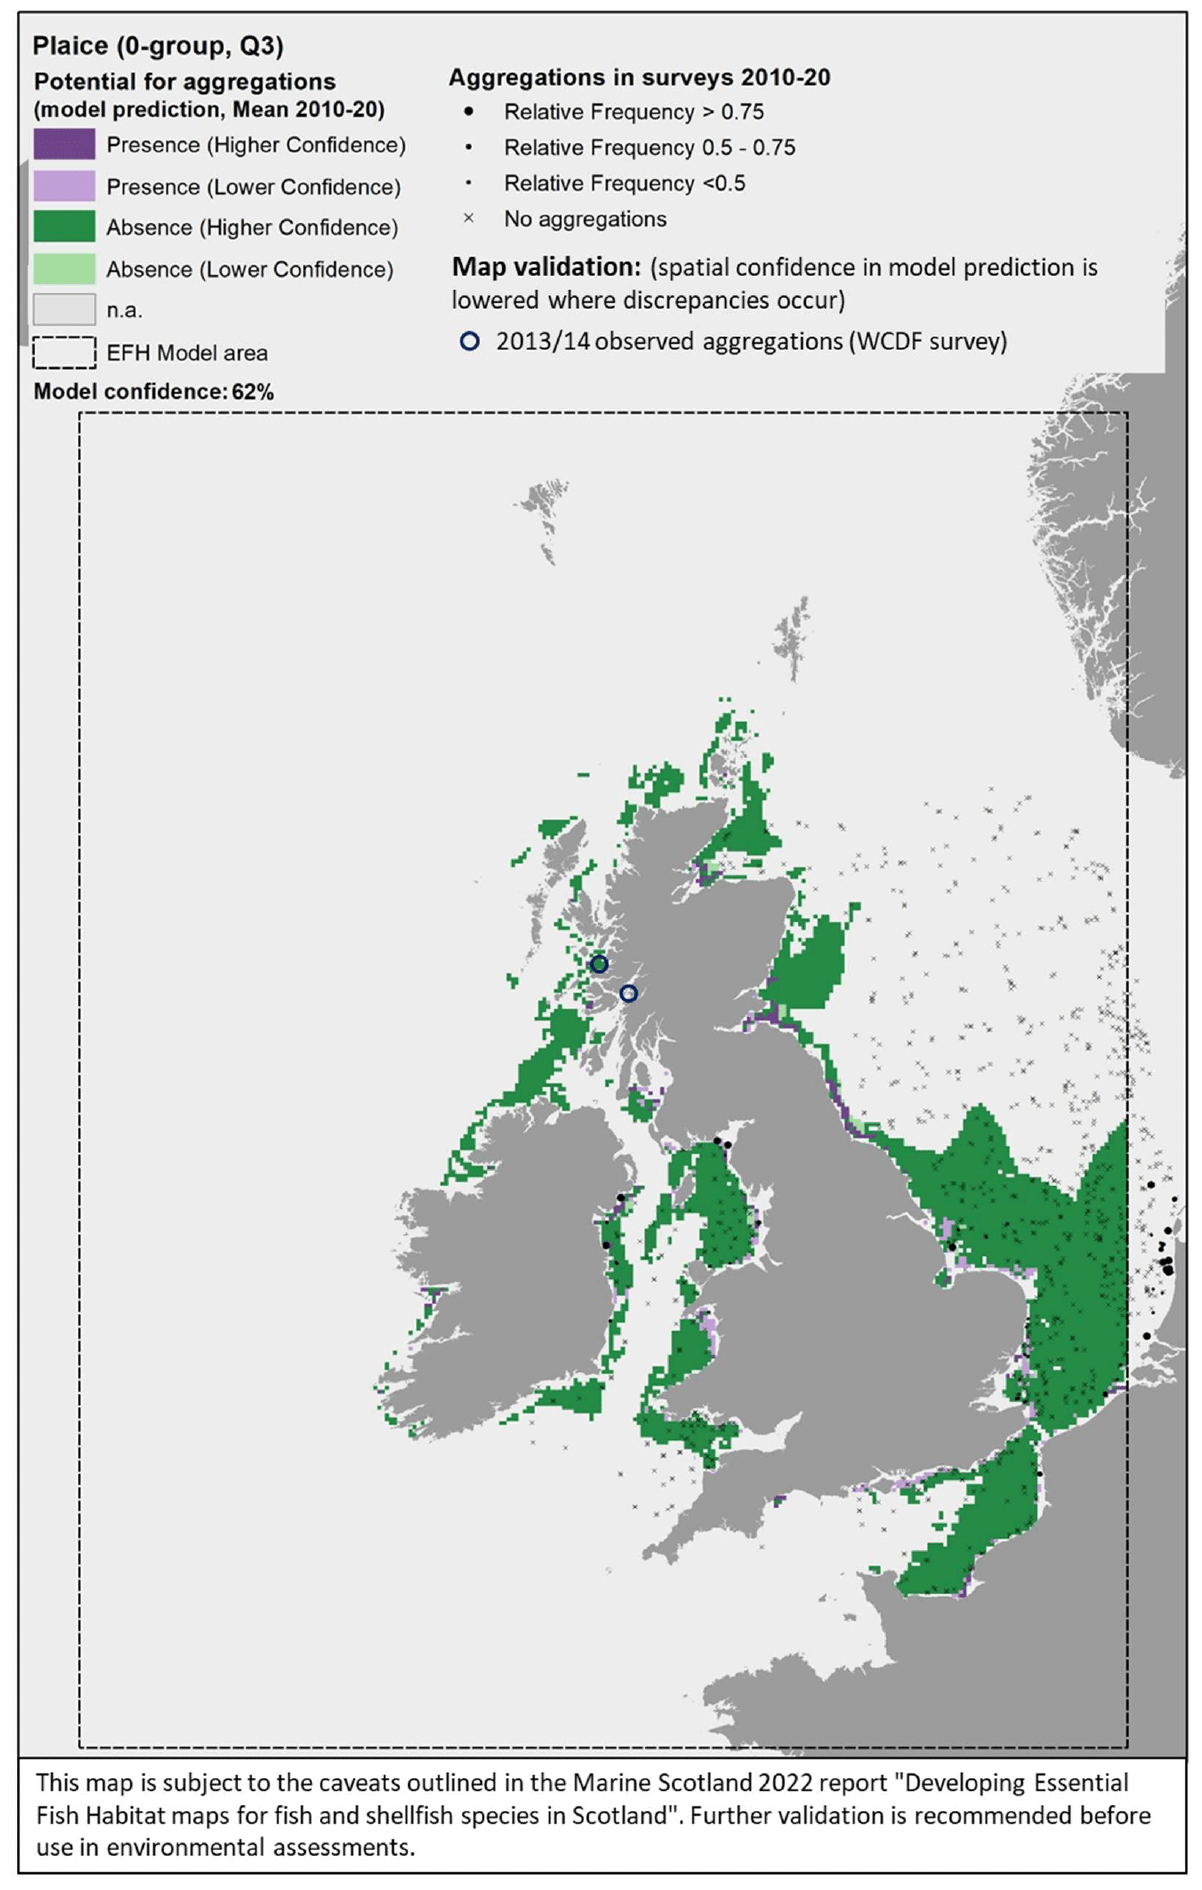
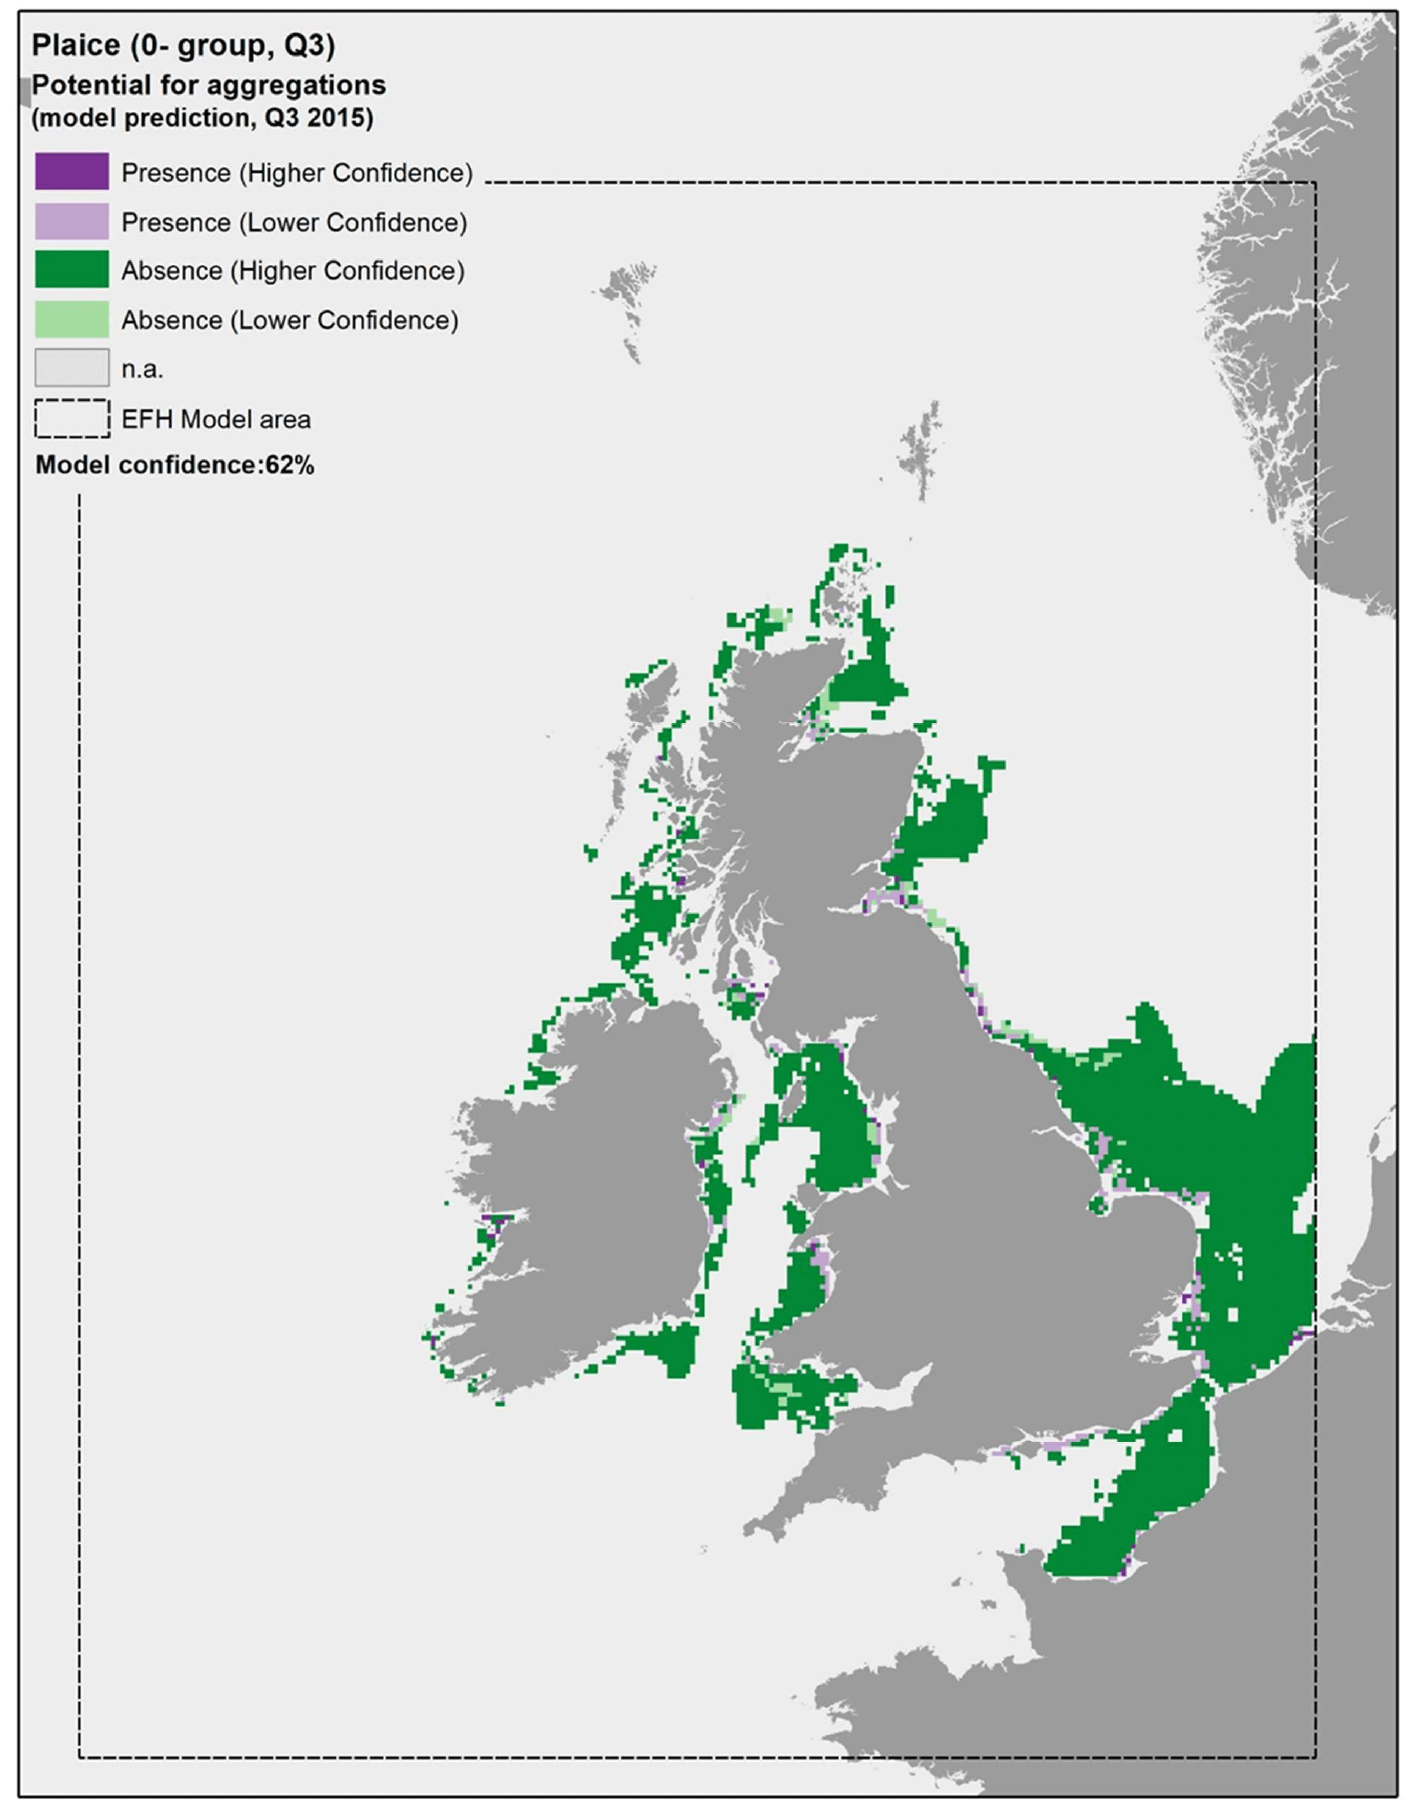
The model prediction applied to the mean summer environmental conditions of the period 2010 - 2020 allowed mapping of the potential distribution of juvenile aggregations as an indication of potential location of higher value juvenile habitats functioning as nursery for plaice (Figure 30).
Comparison with available survey data (both beam trawl surveys considered for the model calibration and additional inshore and offshore demersal surveys on the west coast of Scotland; Appendix C, Figure C8 and Figure C9) and feedback from the stakeholders have highlighted some limitations of the predicted map (Figure 30).
There was a generally good agreement between the model prediction and the bottom trawl survey data, leading to a relatively good confidence associated with the model prediction overall (one of the highest amongst the models calibrated for the species in this study). The predicted map appears to capture well the distribution of settlement habitats of 0-group plaice (individuals <12 cm in length) in shallower areas along the coast (e.g. Moray Firth, Firth of Forth, Firth of Clyde) although the coverage of the most inshore areas (expected to be most important as nursery grounds) is limited due to the distribution of the data on which the model was based (see results of the habitat proxy approach below for a better assessment of more inshore habitats).
Additional survey data available for the west coast of Scotland (2013/14 WCDF survey) only had few occurrences of plaice 0-group juveniles in the summer catches, but areas where aggregations were identified have been added to the map in Figure 30 to account for these records of actual presence. Only areas where a mismatch between observed and predicted aggregations have been highlighted, whereas other aggregations were correctly predicted in the map.
Model predictions based on a more accurate environmental scenario (summer 2015) resulted in a spatial output (Figure 31) that was generally consistent with the average map in Figure 30.
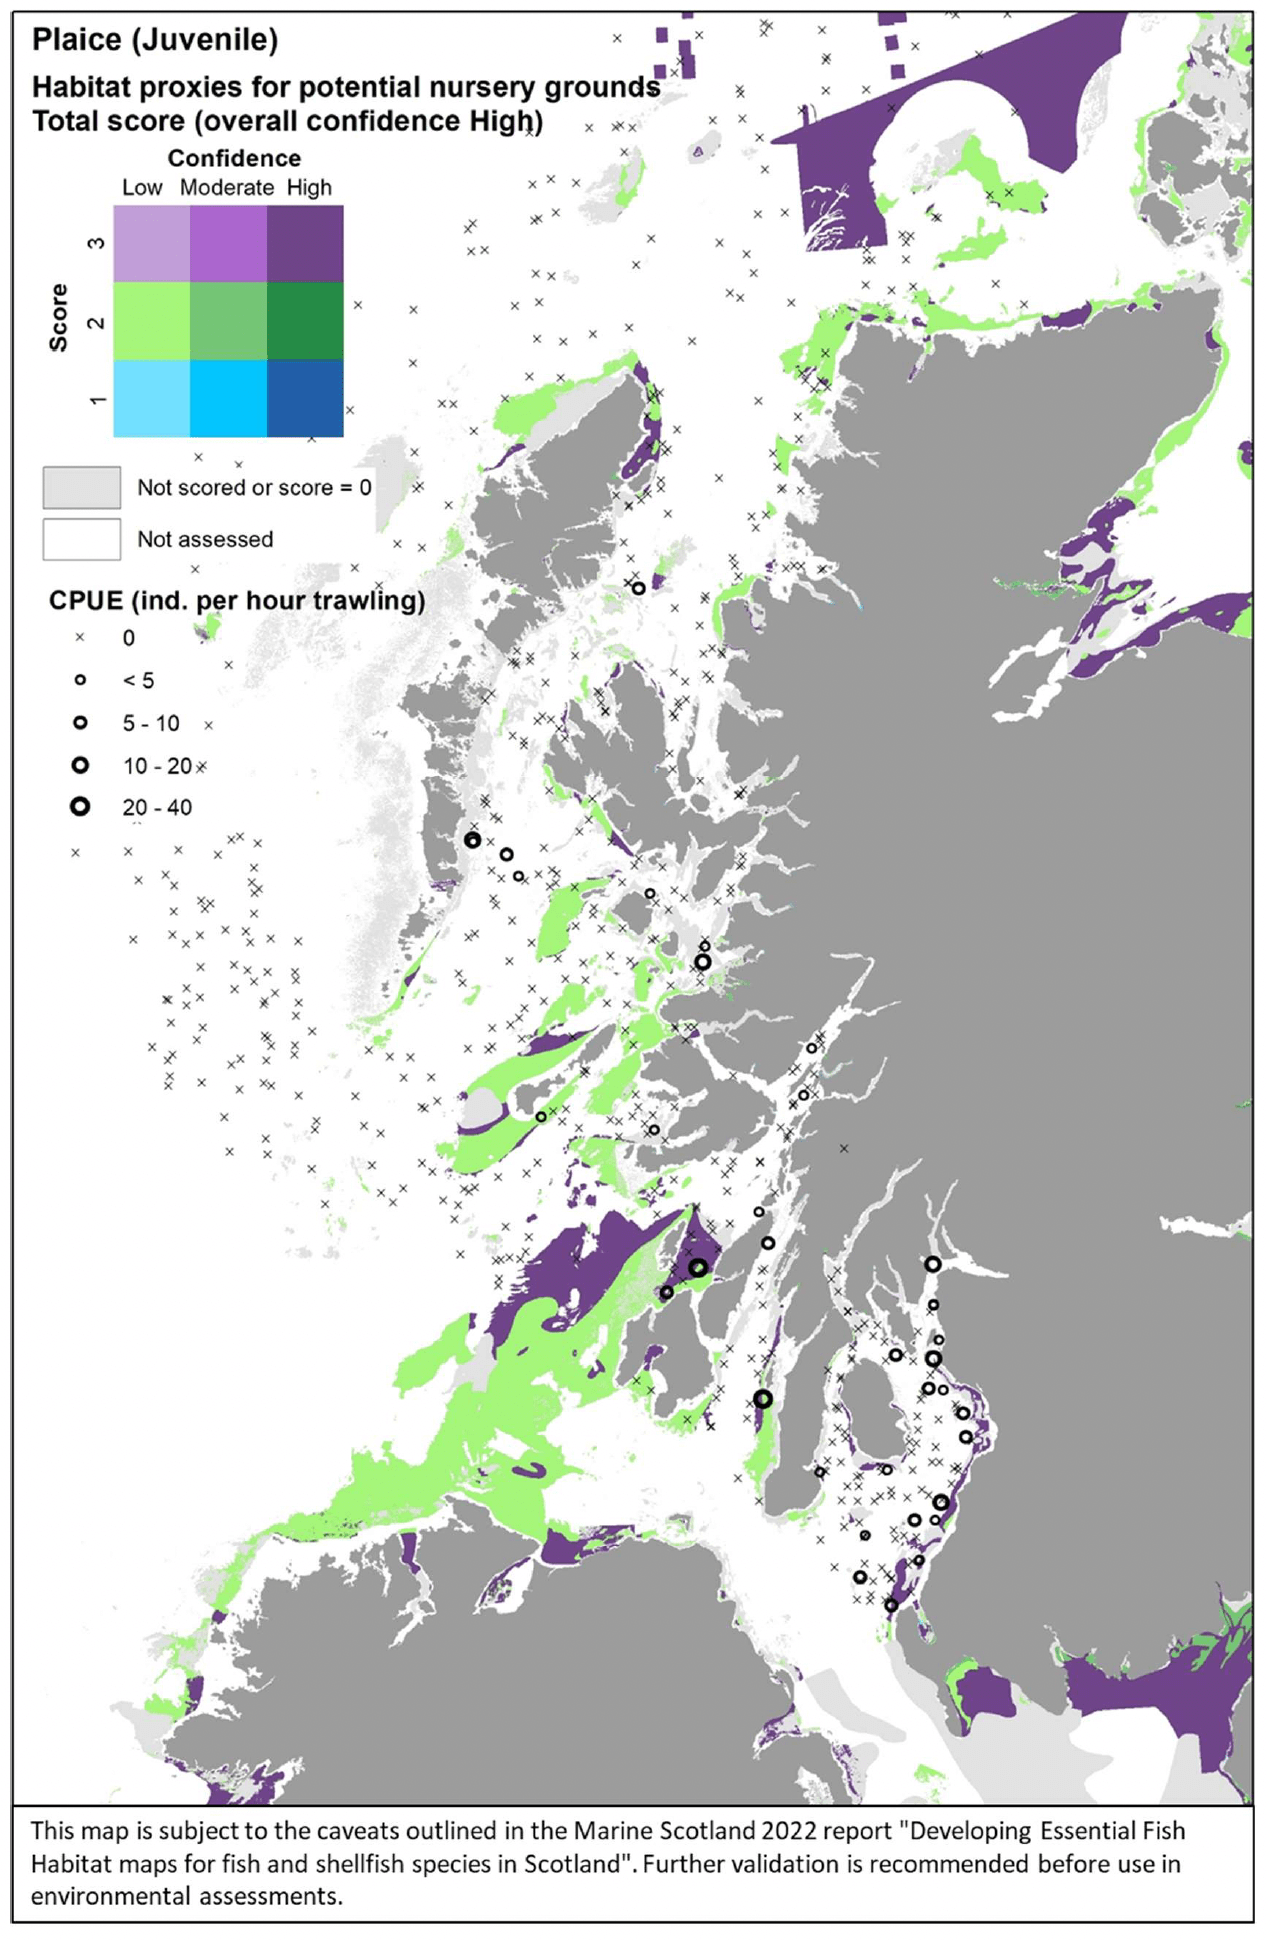
For the assessment of habitat proxies for plaice juveniles inshore, seventeen publications were reviewed and provided detailed characterisation of the species' habitat requirements (see Annex 1). This, along with expert input obtained with the stakeholder validation, led to a high confidence in the overall assessment. Sandy habitats in the infralittoral and sublittoral zones were identified as the most suitable habitats potentially functioning as nursery for plaice, with a high confidence associated (Table 12). Other possible habitats were sublittoral sandy habitats in reduced salinity or estuarine areas (all scoring 2/H). Further possible habitats, though scored with medium to low suitability and medium to low confidence (not shown in Table 12) included sublittoral biogenic reefs, infralittoral, circalittoral and sublittoral coarse sediments, and mobile sandy shores dominated by amphipods, polychaetes and bivalves.
The distribution of the inshore habitat proxies for plaice juveniles in the case study area is mapped in Figure 32, compared with the distribution of juveniles (0-group) from the West Coast of Scotland Demersal Fish Survey (WCDF, 2013/14) in the area. The habitat proxy map appears to accurately identify areas where plaice juveniles were found with higher abundance along the eastern margin of the Firth of Clyde, with the survey data also showing juveniles entering the Firth into Loch Long, where there was no coverage for the EUNIS map. High juvenile abundances west of the Kintyre peninsula and off Jura also match with highly suitable juvenile habitats identified in the map. Relatively high abundances of plaice juveniles were also observed in the survey catches from east and west of the Small Isles.
These locations do not directly match with suitable habitats in the map, although patches of suitable habitats are present nearby that are likely to be used by these juveniles. No stakeholder feedback was received on this map following consultation.
| Plaice(juvenile)–Habitat proxies for nursery function (High confidence overall) |
|---|
| EUNIS Habitat type (score /confidence) |
| A5.2 Sublittoral sand(3/H) A5.21 Sublittoral sand in low or reduced salinity (2/H) A5.22 Sublittoral sand in variable salinity (estuaries) (2/H) A5.23 Infralittoral fine sand (3/H) A5.24 Infralittoralmuddy sand (3/H) |
3.1.6 Lemon sole, Microstomuskitt
Lemon sole (Microstomus kitt, Walbaum 1792) is a benthic flatfish of high commercial importance, found mostly offshore (Annex 1). Juveniles of this species are believed to settle in early nursery areas located in deeper, offshore areas, on rougher terrain compared to other flatfish, possibly overlapping with the species spawning areas, although the literature on this species and its environmental requirements is much sparser compared to other flatfish (Annex 1).
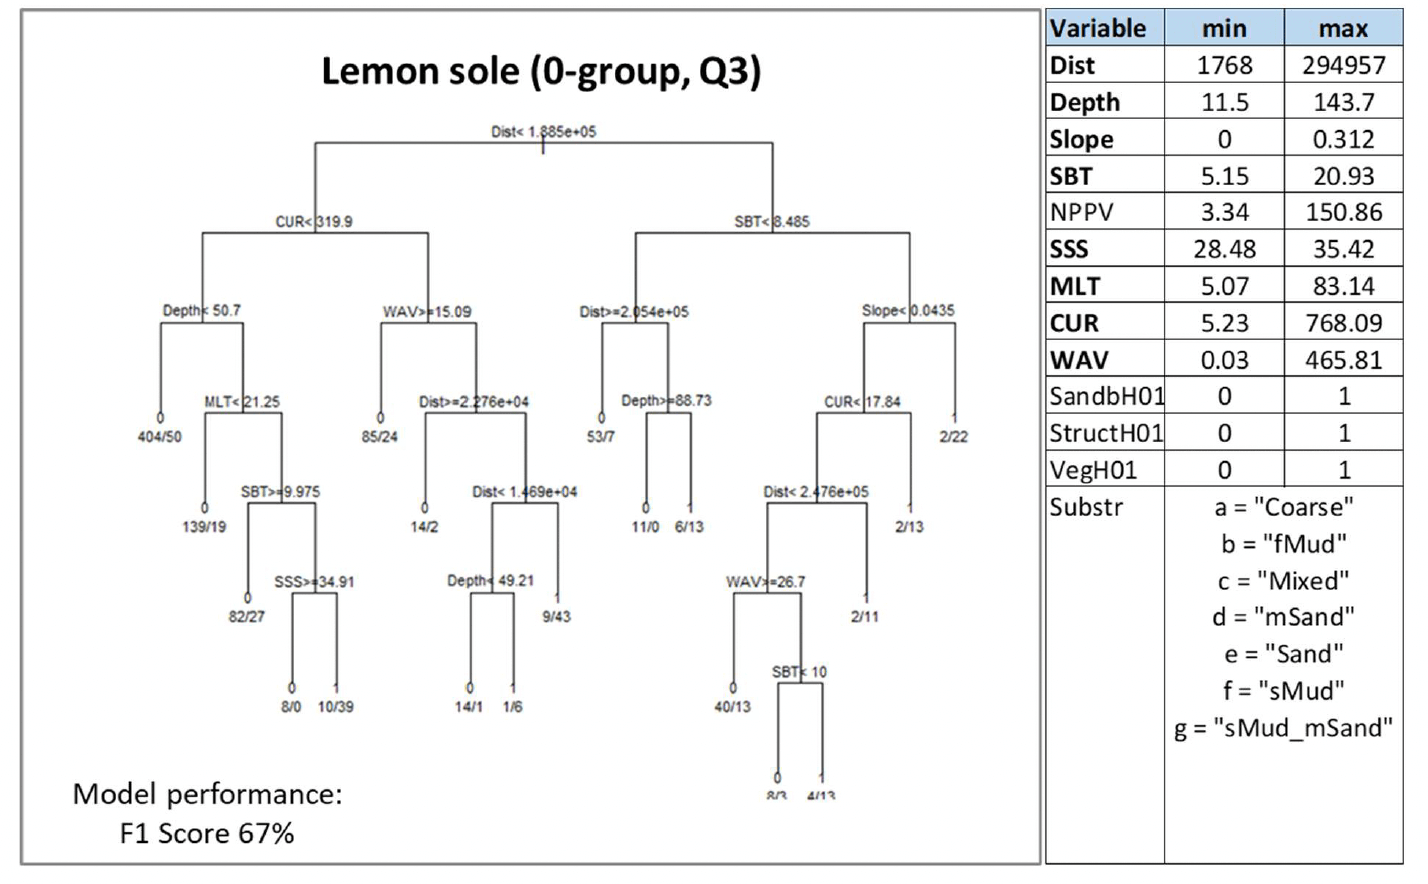
Lemon sole was assessed through modelling, based on summer catches from beam trawl surveys. Individuals <15 cm in length were considered to identify 0-group juveniles and their aggregations were used as indicator of potential higher value habitats used as nurseries.
Almost all variables accounting for geomorphological, energy and water quality characteristics (except for NPPV) were selected by the model as predictors. Distance from the shore (Dist), current energy at the seabed (CUR), depth and seabed temperature (SBT) being the most important. Juvenile aggregations were predicted to occur at various combinations of these variables (Figure 33). Predictions of occurrence were identified with the highest probability (0.92) in offshore areas (Dist ≥188 km) where the mean monthly temperature at the seabed in the summer is ≥8.5°C and on gently sloping seabed (Slope ≥0.04 degrees). The type of seabed (Substr) did not appear to affect the distribution of juvenile aggregations within the range of habitats where this life stage was sampled (Figure 33).
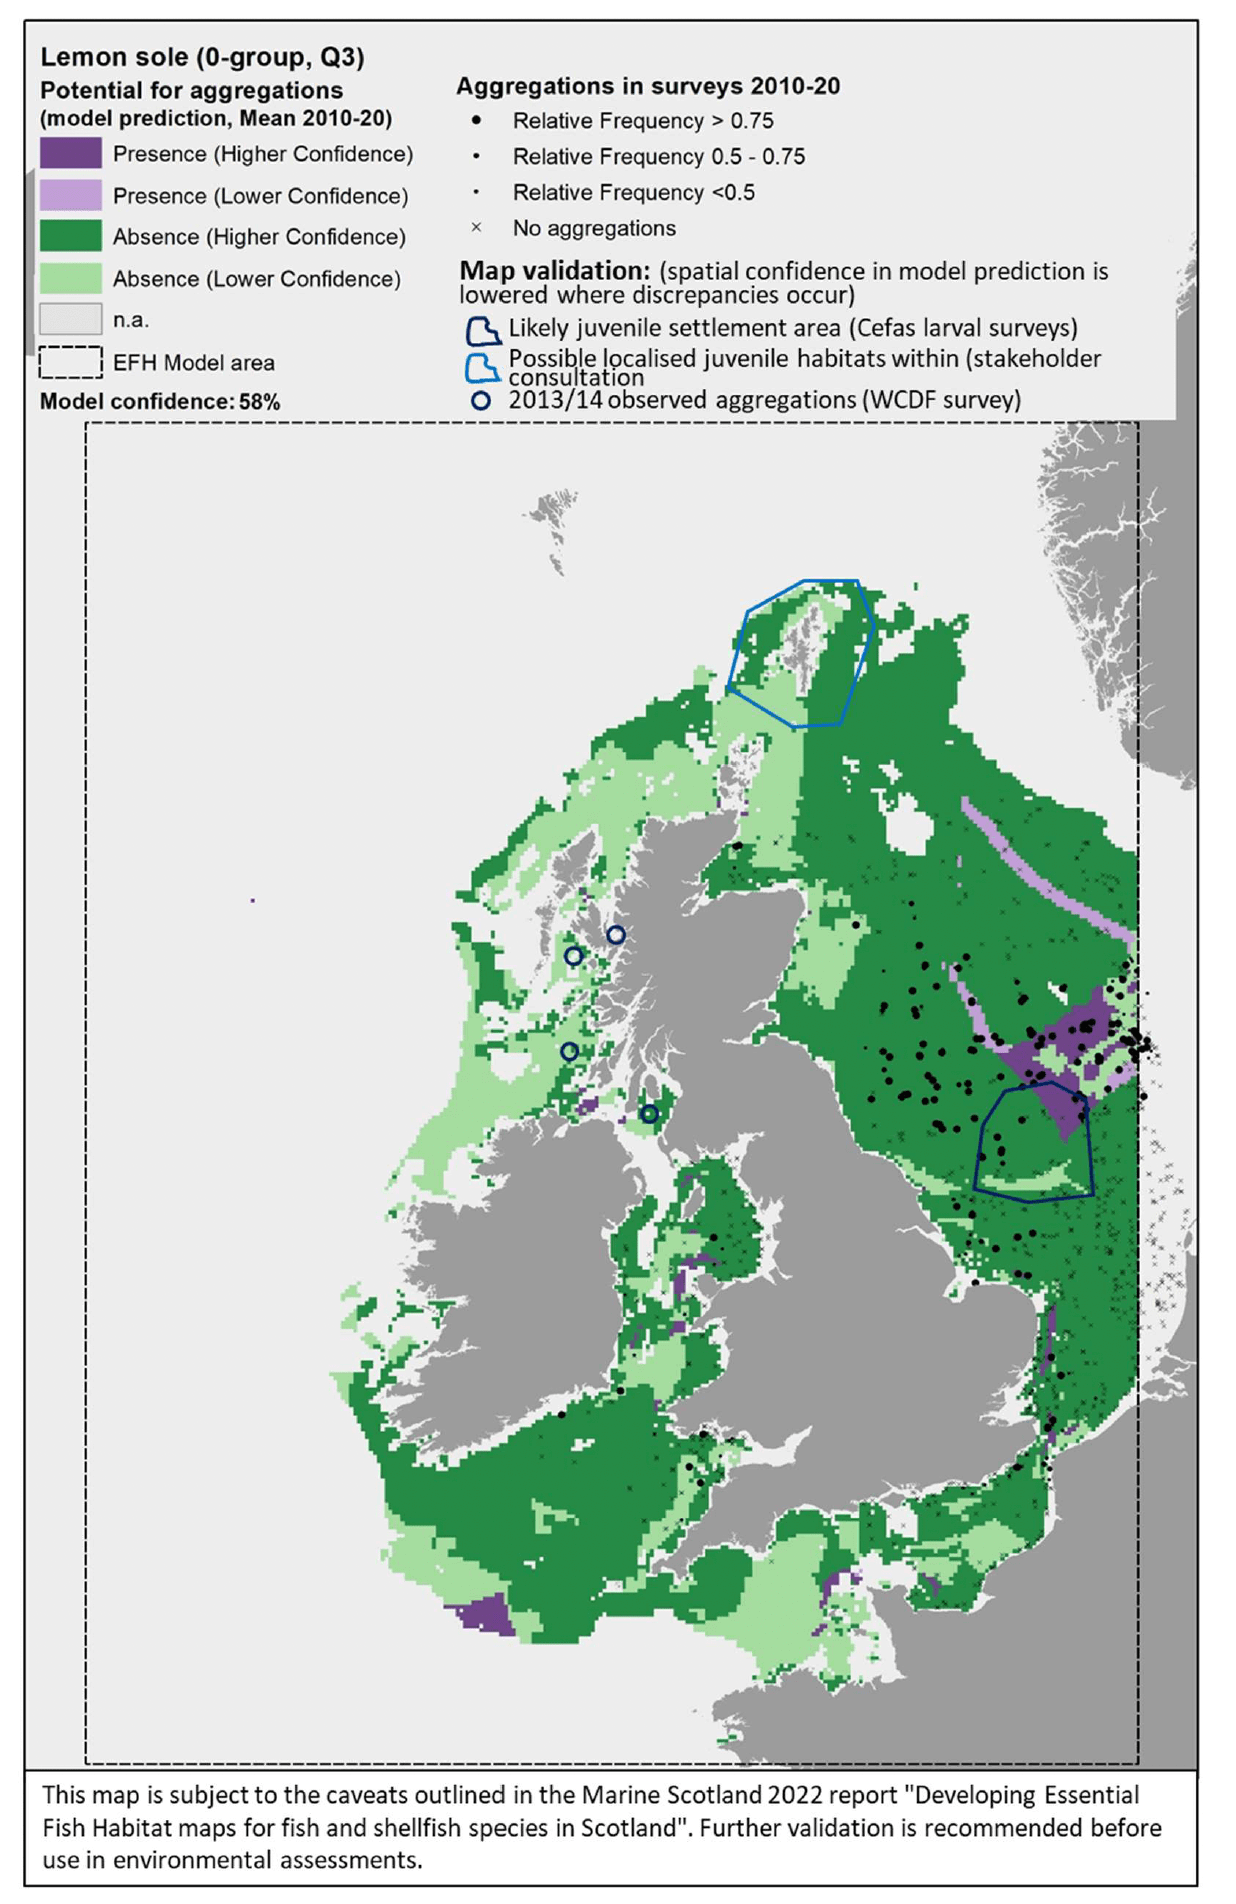
The model prediction applied to the mean summer environmental conditions of the period 2010 - 2020 allowed mapping of the potential distribution of juvenile aggregations as an indication of potential location of higher value juvenile habitats functioning as nursery for lemon sole (Figure 34).
Comparison with available survey data (both beam trawl surveys considered for the model calibration and additional inshore and offshore demersal surveys on the west coast of Scotland; Appendix C, Figure C11 and Figure C12) and feedback from the stakeholders have highlighted some limitations of the map (Figure 34).
Although the map correctly identifies potential nursery on the Dogger Bank, the observed presence of aggregations of lemon sole juveniles in the central North Sea and in more inshore areas to the south appear to be poorly predicted, a result that is likely accounted for by the model predictive performance (67%) and resulting moderate overall confidence (58%). Furthermore, larval surveys undertaken by Cefas identified abundant larvae close to settlement to the south and west of the Dogger Bank suggesting that also those areas may be potential nursery for the species.
The map has limited coverage of the most inshore areas that may also locally host aggregations of lemon sole juveniles, due to the distribution of the data on which the model was based. Stakeholder feedback also indicated the potential presence of small lemon sole in the Shetland waters, although the exact locations within this wider area were unknown (it was suggested that bottom trawl surveys and discard observer trips might account for these).
Additional survey data available for the west coast of Scotland (2013/14 WCDF survey; Appendix C, Figure C12) only had few occurrences of lemon sole 0-group juveniles (individuals <15 cm in length) in the catches, but areas where aggregations were identified have been added to the map in Figure 34 to account for these records of actual presence. Only areas where a mismatch between observed and predicted aggregations have been highlighted, whereas other aggregations were correctly predicted in the map.
3.1.7 Common sole, Soleasolea
Common sole (Solea solea, Linnaeus 1758), also known as Dover sole, is a benthic flatfish of high commercial importance, found both inshore and offshore (Annex 1). It is a predominantly southern species that reaches its northern limit in the Irish Sea, southern North Sea, Skagerrak and Kattegat, although it may sometimes be caught in low numbers around Scotland. Dependence on intertidal and shallow subtidal sandy and finer grained substrata in inshore areas (including estuaries) has been reported particularly for juveniles of the species, which use these areas as nursery grounds during the first 2 - 3 years of life before migrating into deeper offshore waters (Annex 1).
Common sole was assessed by using both the data-based model and the habitat proxy approach. The former predicted the distribution of aggregations of juveniles of the species in summer as an indicator of potential higher value habitats used as nurseries. 0-group individuals alone (<12 cm in length) were infrequent in the survey catch data, and therefore 1-group individuals (<25 cm) were also considered. As common sole is reported to spend 2 - 3 years in inshore nursery grounds (Annex 1), including 1-group individuals in the assessment was considered suitable to identify potential nursery aggregations. The habitat proxy approach also allowed identification of habitats that may potentially be used by the juveniles of the species, with better coverage of inshore habitats.
Almost all variables accounting for geomorphological (except for distance from the shore), energy and water quality characteristics were selected by the model as predictors. Depth (Depth) and water column mixing (MLT), followed by temperature (SBT) and wave energy at the seabed (WAV), and primary production (NPPV) were the most important predictors.
Juvenile aggregations were predicted to occur at various combinations of these variables (Figure 35). Predictions of occurrence were identified with the highest probability (0.96) in deeper habitats (≥21.8 m depth) with warmer waters at the seabed (SBT ≥19.2°C) and higher primary production (NPPV ≥26.1 mg C m-3 day-1). The type of seabed (Substr) did not appear to affect the distribution of juvenile aggregations within the range of sedimentary habitats where this life stage was sampled (Figure 35).
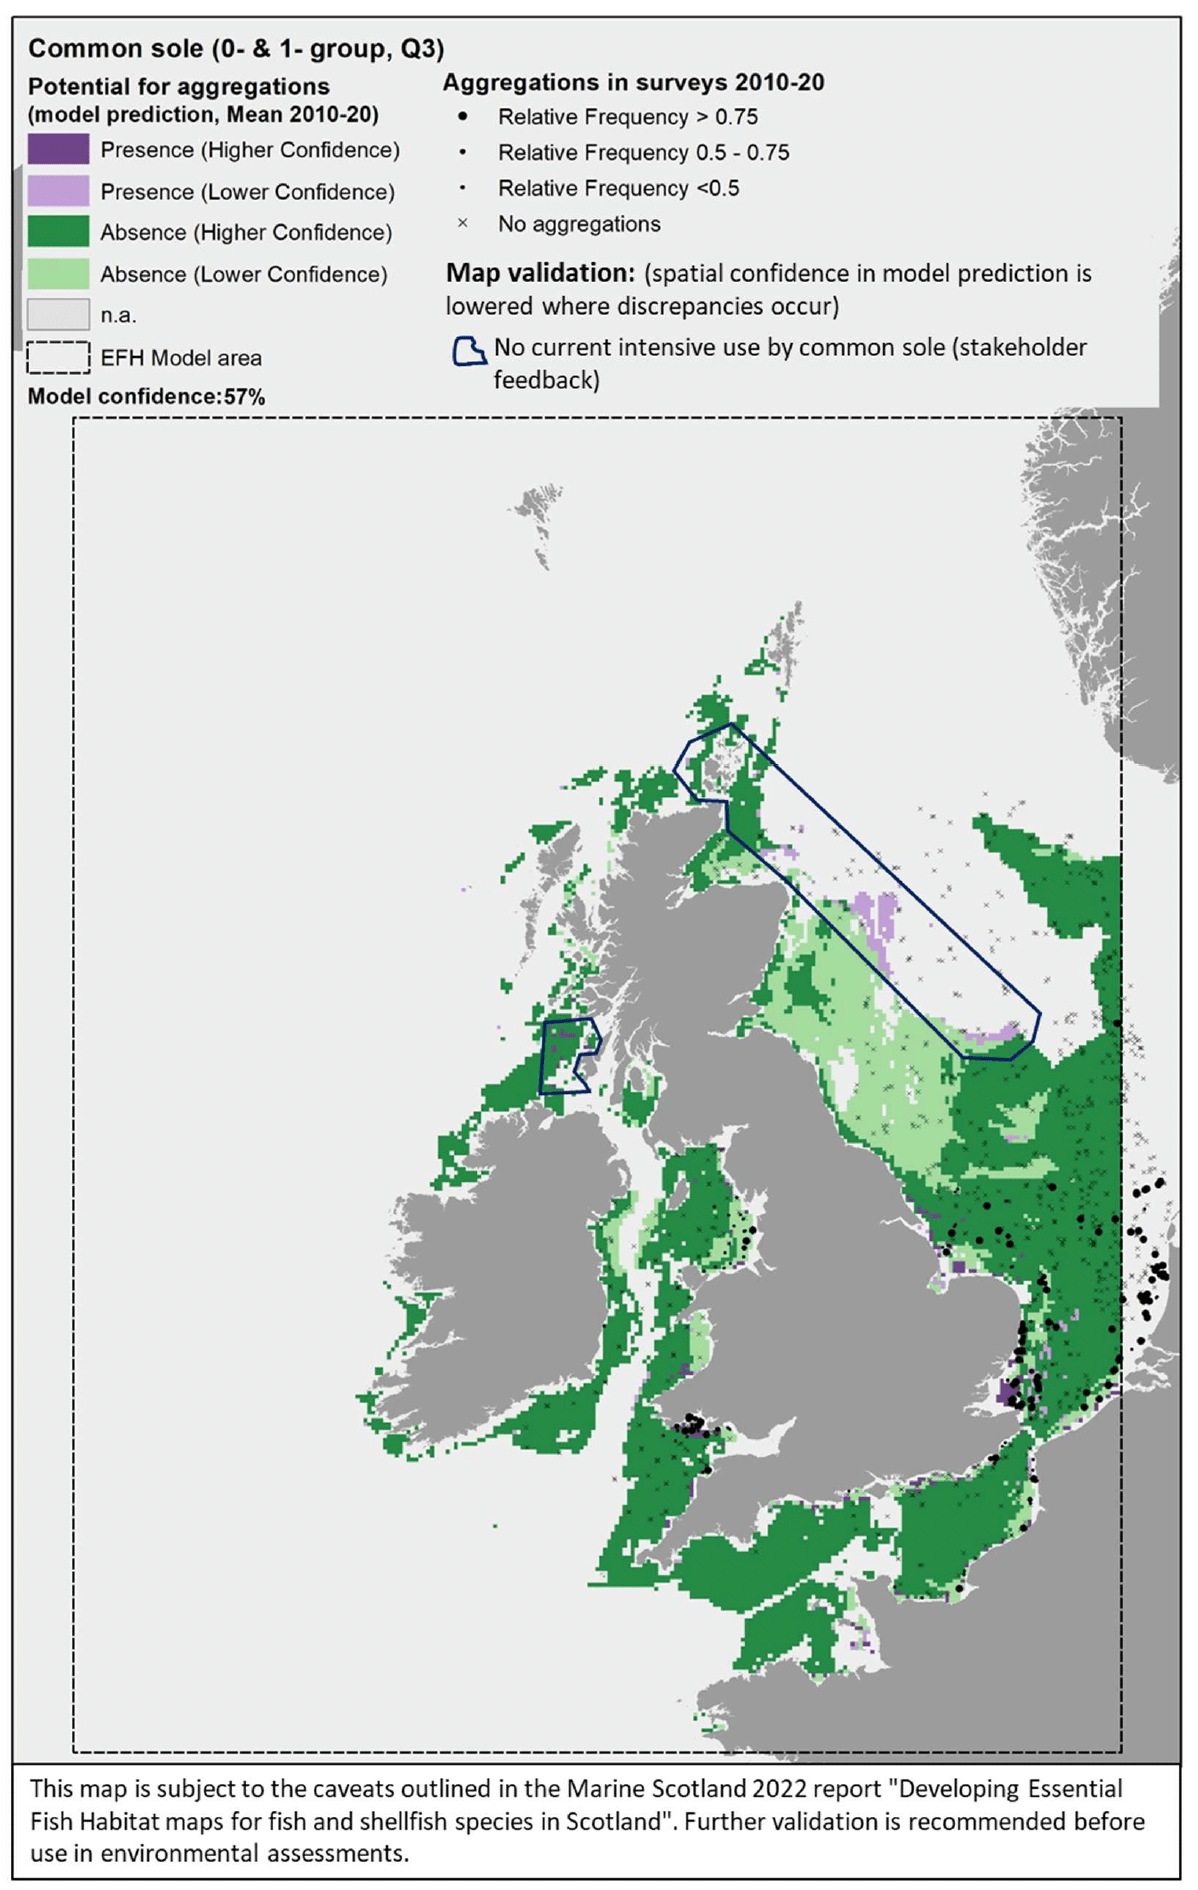
The model prediction applied to the mean summer environmental conditions of the period 2010 - 2020 allowed mapping of the potential distribution of juvenile aggregations as an indication of potential location of higher value juvenile habitats functioning as nursery for common sole (Figure 36).
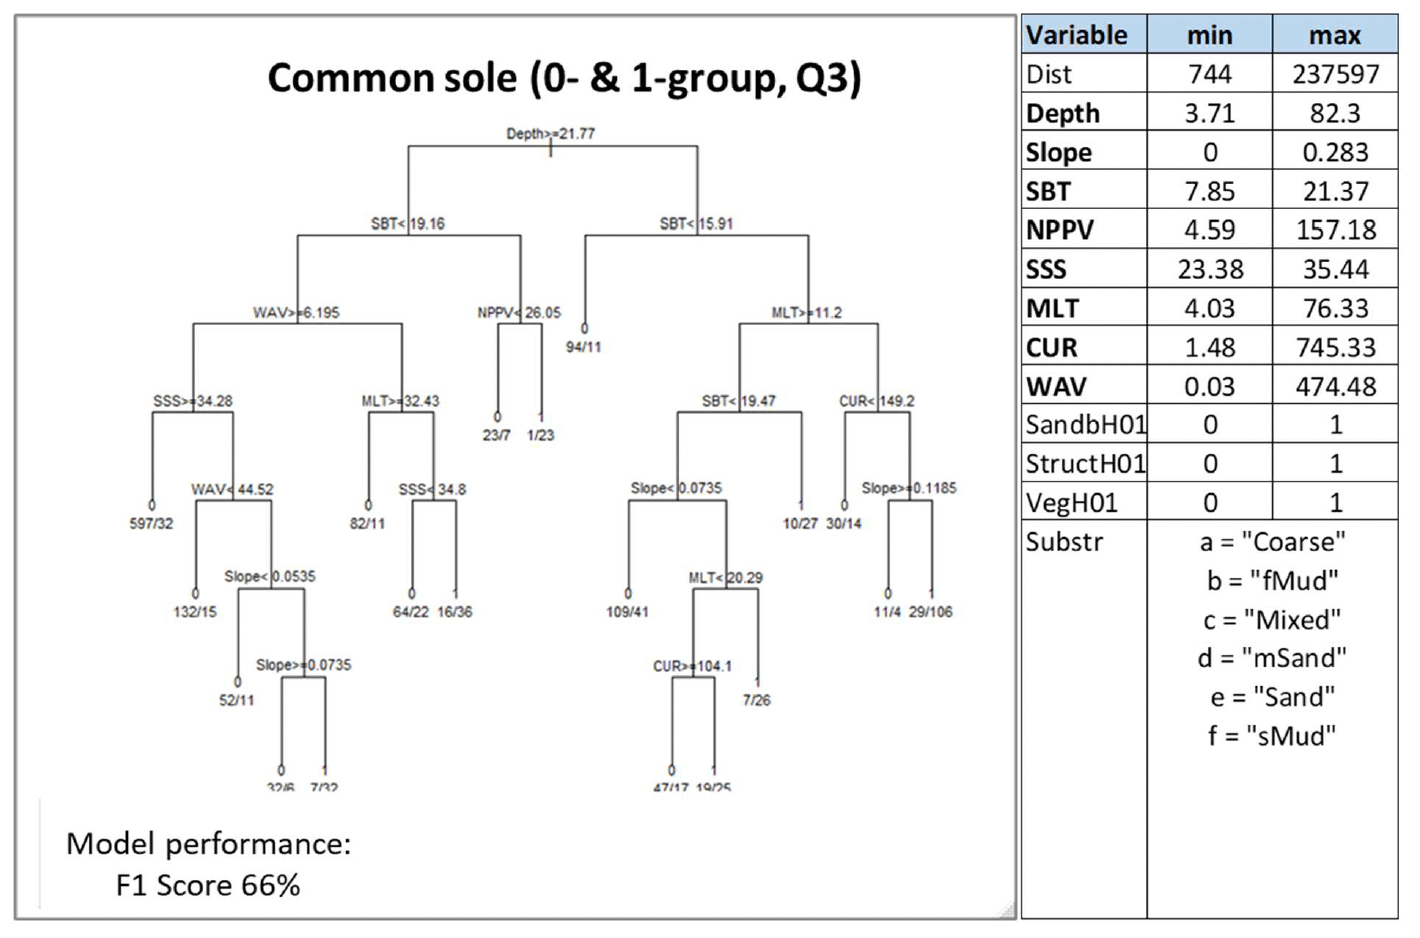
Comparison with available survey data (beam trawl surveys considered for the model calibration[17]; Appendix C, Figure C13) and feedback from the stakeholders have highlighted some limitations of the map (Figure 36).
The map correctly identifies potential inshore nurseries along the southeast, south and southwest coast of the UK, although the prediction along the west coast seems to fail to identify potentially suitable habitat patches in Liverpool Bay where juvenile aggregations were frequently observed in survey data. This is due to the fact that the mean summer environmental conditions for 2010 - 2020 used to predict the model in this area showed values that the model considered to be unsuitable for the presence of juvenile aggregations (namely, depth <21.8 m and SBT >15.9°C, with also CUR <149 N m2/s where MLT was <11.2 m, or SBT <19.5°C and slope <0.07 degrees where MLT was >11.2 m; Figure 35). The coverage of more inshore areas (expected to be most important as nursery grounds) is also limited in the map, due to the distribution of the data on which the model was based (see results of the habitat proxy approach below for a better assessment of more inshore habitats).
The model also appears to identify habitats that may be suitable for juvenile aggregations in northern waters (e.g. east and west of Scotland), despite common sole having a more southern distribution in UK waters, as confirmed by the absence of aggregations in the beam trawl survey catches that extended further north. This is likely accounted for by the model predictive performance (66%) and resulting moderate overall confidence (57%).
Stakeholder feedback confirmed the absence of common sole from commercial catches in the north and west of Scotland. This suggests that, although some of those areas may have environmental conditions that might be suitable to host juvenile aggregations (at least as far as regards the set of variables identified by the model; Figure 35), they are not currently used by common sole. This is likely due to the unsuitability of other environmental conditions that are not accounted for by the model.
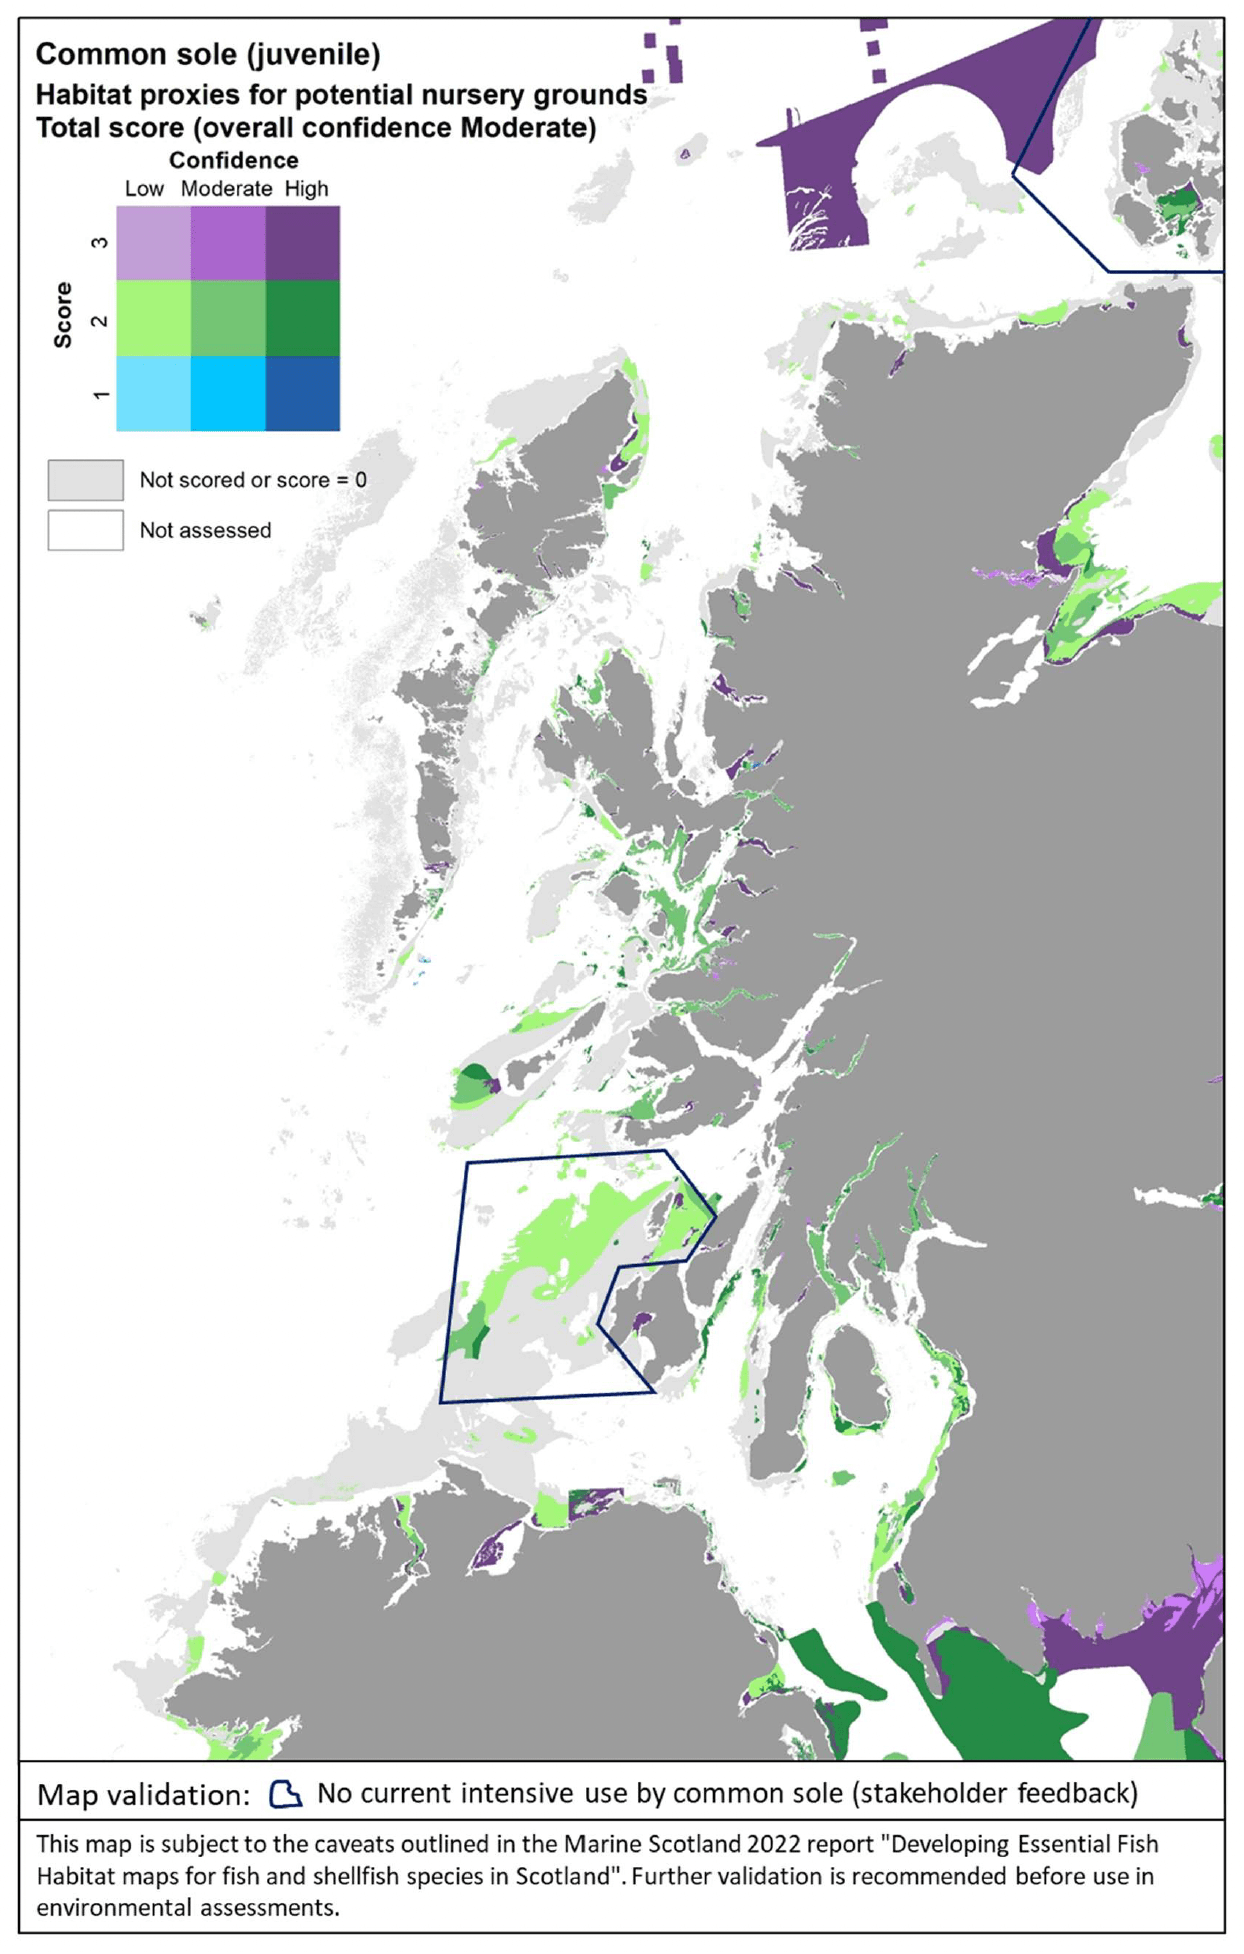
For the assessment of habitat proxies for juveniles of common sole inshore, thirteen publications were reviewed (see Annex 1). The specific information on juvenile habitat associations and environmental preferences was scarce (most of the information was about generic habitat preferences of the species) and often it was not detailed enough to discriminate suitable habitats at the higher resolution. This, along with expert input obtained with the stakeholder validation, led to a moderate confidence in the overall assessment of habitat proxies for juvenile common sole.
Sandy and muddy habitats in the infralittoral and sublittoral zones were identified as the most suitable habitats potentially functioning as nursery for common sole, with a high confidence associated (Table 13). Other possible habitats were fine sand shores or muddy shores, all with polychaete, oligochaete or bivalve dominance (all scoring 3/M). Further possible habitats, scored with medium to low suitability and medium to low confidence (not shown in Table 13), included circalittoral sands (habitat codes A5.25, A5.25, A5.35, A5.36) and sublittoral biogenic reefs (habitat code A5.6).
The distribution of the inshore habitat proxies for common sole juveniles in the case study area is mapped in Figure 37. It is of note that, currently, common sole has a predominant southern distribution in UK waters, occurring mainly along the west, south and east coast of England (the Humber Estuary represents its northern range limit in the North Sea).
Therefore, the habitats in Figure 37 are not currently used by the species (as confirmed by stakeholder feedback), and are to be read as habitats that are potentially suitable and may become available for juvenile colonisation should the species extends its range northwards in the future.
| Common sole (juvenile)–Habitat proxies for nursery function (Moderate confidence overall) |
|---|
| EUNIS Habitat type (score /confidence) |
| A2.2 Littoral sand and muddy sand (3/M) A2.22 Barren or amphipod-dominated mobile sand shores (3/M) A2.23 Polychaete/amphipod-dominated fine sand shores (3/M) A2.24 Polychaete/bivalve-dominated muddy sand shores (3/M) A2.3 Littoral mud (3/M) A2.31 Polychaete/bivalve-dominated mid estuarine mud shores (3/M) A2.32 Polychaete/oligochaete-dominated upper estuarine mud shores (3/M) A2.33 Marine mud shores (3/M) A5.2 Sublittoral sand(3/H) A5.22 Sublittoral sand in variable salinity (estuaries) (3/H) A5.23 Infralittoral fine sand (3/H) A5.24Infralittoralmuddysand(3/H) A5.3 Sublittoral mud(3/H) A5.32 Sublittoral mud in variable salinity (estuaries) (3/H) A5.33 Infralittoral sandy mud (3/H) A5.34 Infralittoral fine mud (3/H) |
3.1.8 Anglerfish, Lophiuspiscatorius
Anglerfish (Lophius piscatorius Linnaeus 1758), also known as s ea monkfish, are a slow moving, bottom dwelling marine fish which is designated as a Priority Marine Feature in Scotland seas. It is mostly widespread in deeper waters of the continental shelf and slope (Annex 1). Small numbers may also occur in shallow coastal waters, although these are largely juveniles which drift from the deeper spawning areas and settled into the inshore nursery grounds (Annex 1).
Anglerfish was assessed through modelling based on spring catches from trawl surveys targeting this species in Scottish waters. 0-group individuals alone (<18 cm in length) were infrequent in the survey catch data, likely due to the gear characteristics (e.g. large mesh size) as the surveys did not target specifically juveniles[18] (this was taken into account in the confidence assessment). Therefore, 1-group individuals (<28 cm) were also considered.
These are still immature individuals (Annex 1) and including them in the assessment was considered suitable to identify potential higher value habitats used as nurseries.
Substratum type was excluded from the analysis due to its high collinearity with the other variables (VIF 12.1). Seabed temperature (SBT), water column mixing (MLT), salinity (SSS) and current energy at the seabed (CUR) were the environmental predictors selected by the model for juvenile aggregations. SBT and MLT were the most important predictors. Juvenile aggregations were identified with the highest probability (0.94) in warmer waters (mean monthly temperature at the seabed in the spring ≥8.2°C) characterised by an intermediate- low degree of vertical mixing (MLT between 113.1 and 146.5 m) within the range where juveniles were found (Figure 38). These conditions were mostly correspondent to substrata dominated by fine and sandy mud and muddy sand.
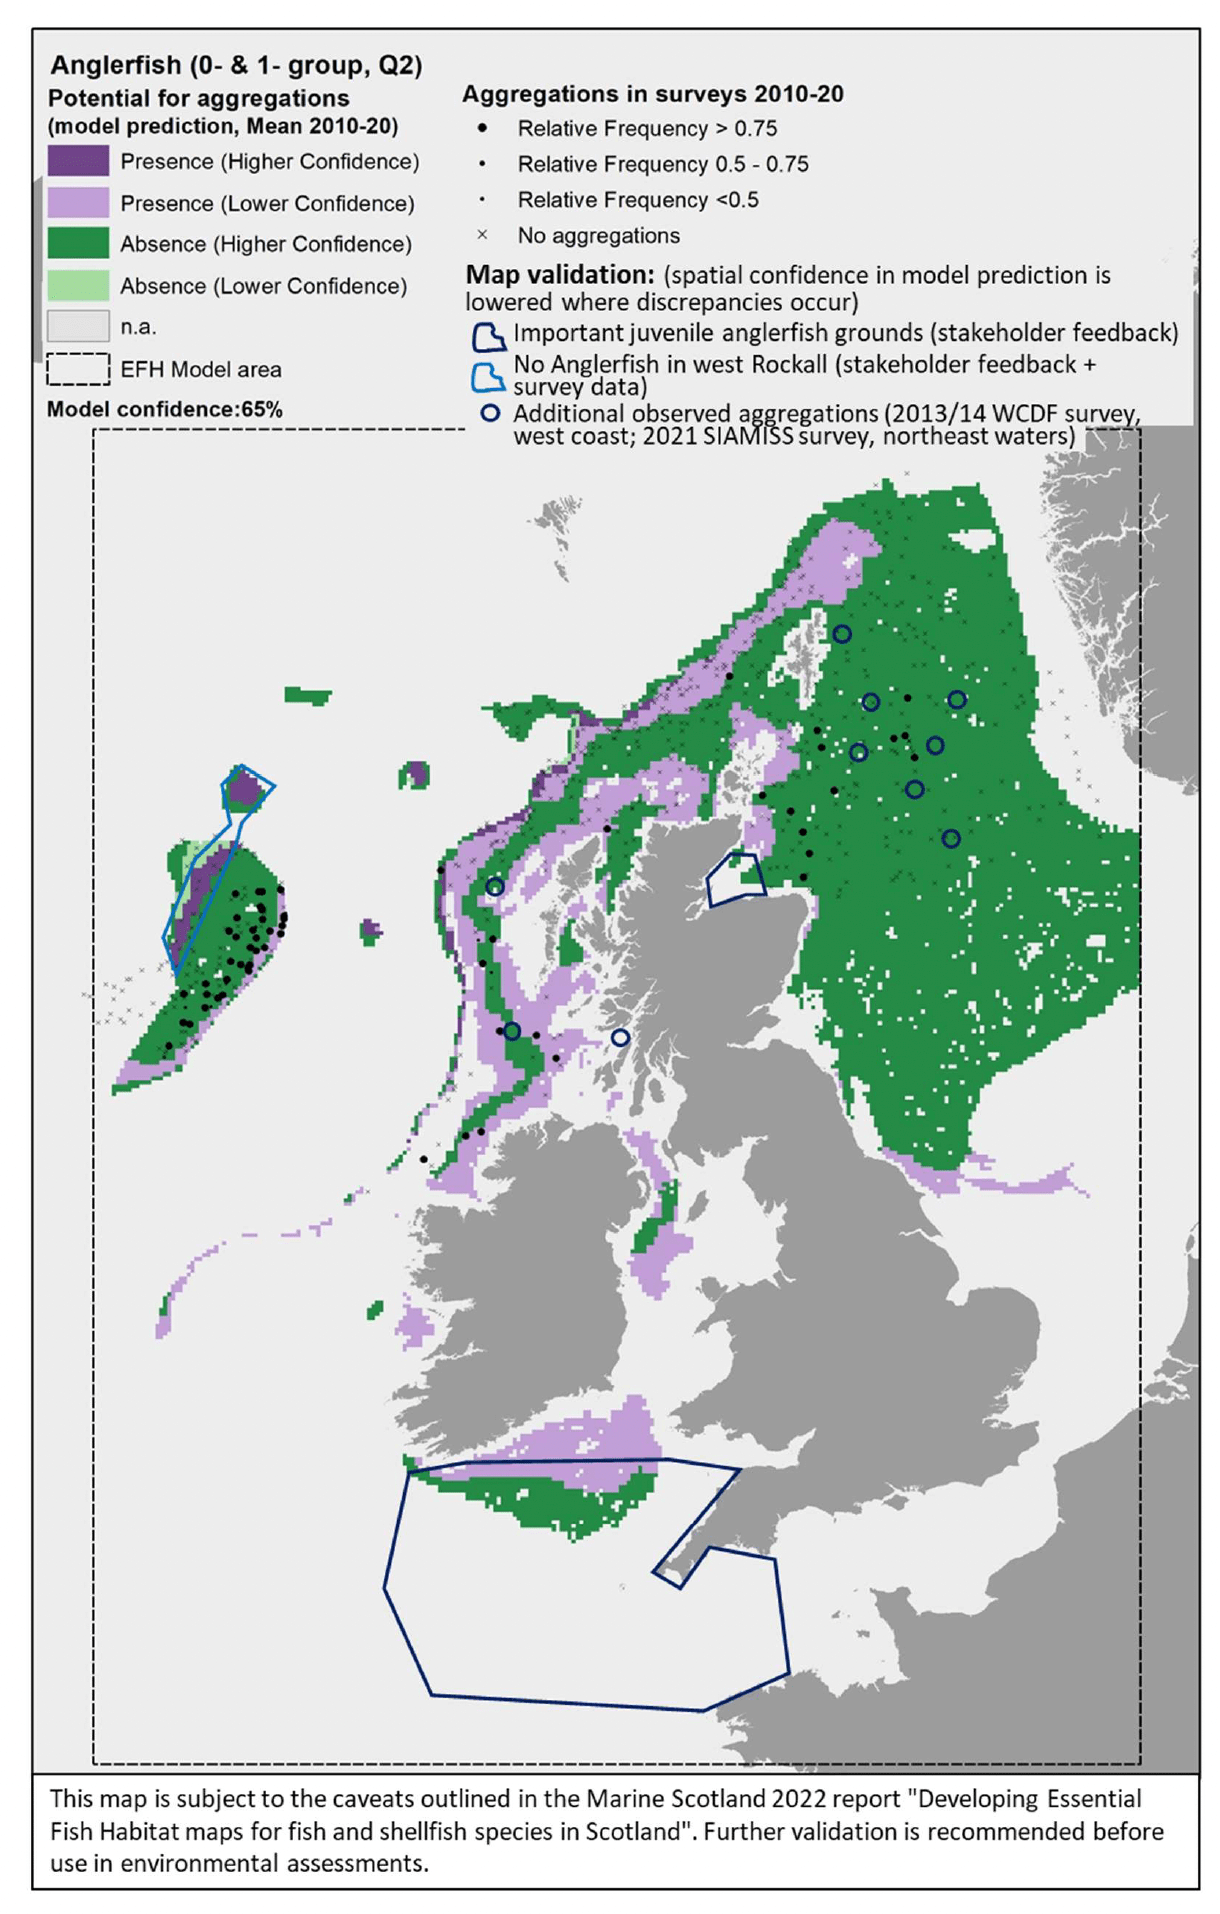
The model prediction applied to the mean spring environmental conditions of the period 2010 - 2020 allowed to map the potential distribution of juvenile aggregations as an indication of potential location of higher value juvenile habitats functioning as nursery for anglerfish (Figure 39).
Comparison with available survey data (both used for the model calibration and additional ones; Appendix C, Figure C14 and Figure C15) and feedback from stakeholders have highlighted some inaccuracies in the map (Figure 39).
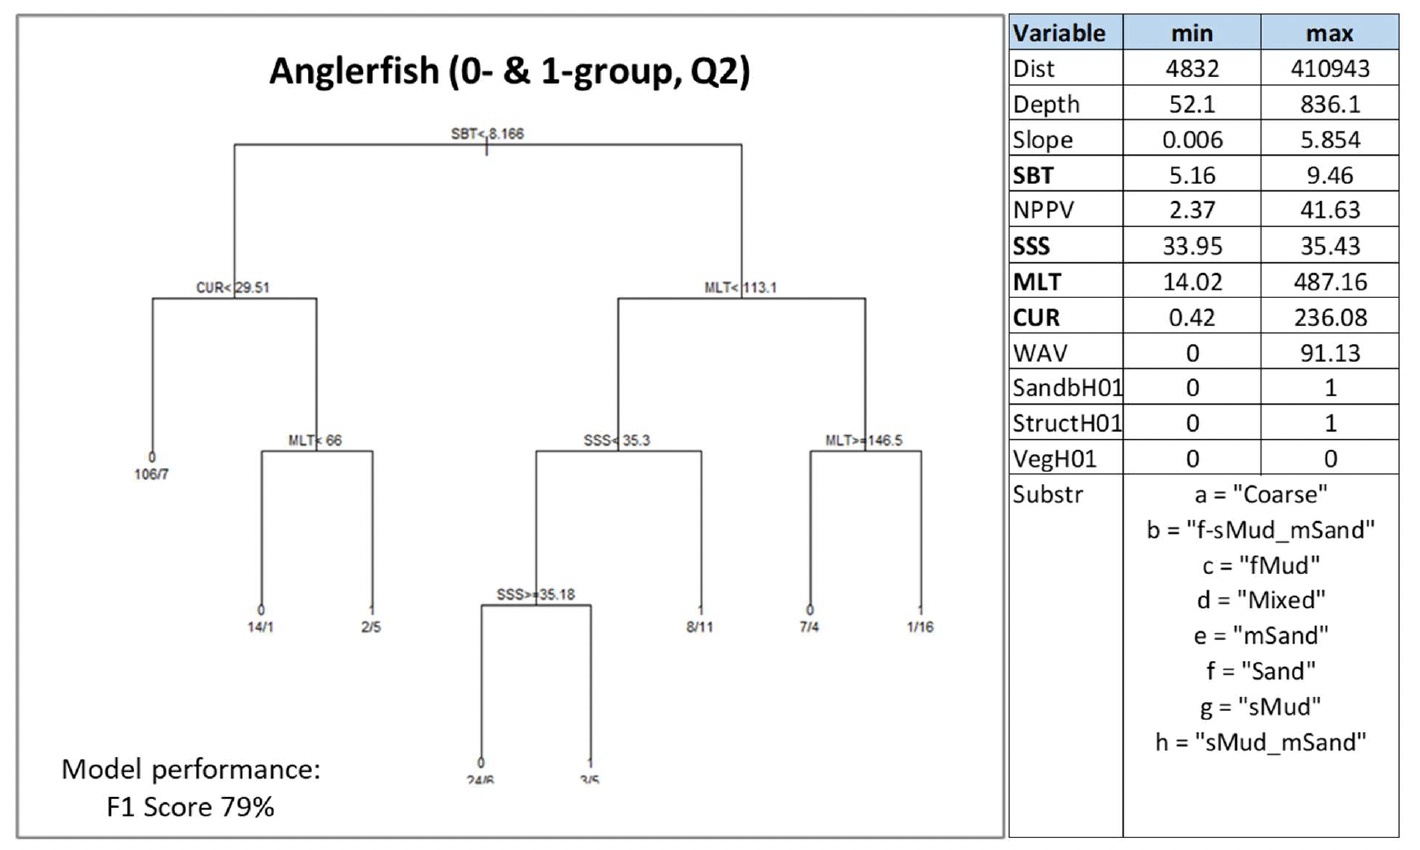
Stakeholder feedback identified important anglerfish juvenile grounds that were not predicted by the model in the western English Channel and in most of the Celtic Seas. In turn, the model appeared to predict the presence of aggregations in west Rockall, an area where anglerfish has never been found according to both survey data and stakeholder personal observations, whereas the actual aggregation areas on east Rockall are wider than predicted in the map. Additional survey data also indicated further occurrence of aggregations on the west coast of Scotland and in the northern North Sea, where the model predicted absences or did not provide valid predictions (Figure 39). The latter was in inshore areas that are generally poorly covered by the model due to the distribution of the data on which the model was calibrated.
Further exploration of the model predictions showed that the inaccuracies highlighted in the map in Figure 39 (particularly those regarding Rockall and Celtic Seas) were mainly due to limitations in the environmental scenario used to draw that map (environmental conditions averaged for the spring season over the period 2010 - 2020), rather than to limitations in the model predictive ability. In fact, the model predictive performance for anglerfish was good (79%), with the overall confidence lowered to 65% mainly due to the restricted geographical coverage of the fish survey data (northern Scottish waters) used to calibrate the model and the lower confidence in the ability of the fishing gear used in SIAMISS surveys to effectively sample juveniles of the species (Annex 3), as also highlighted during stakeholder consultation. As a result, the model for anglerfish juvenile aggregations was the model with the highest confidence amongst those calibrated for the species in this study.
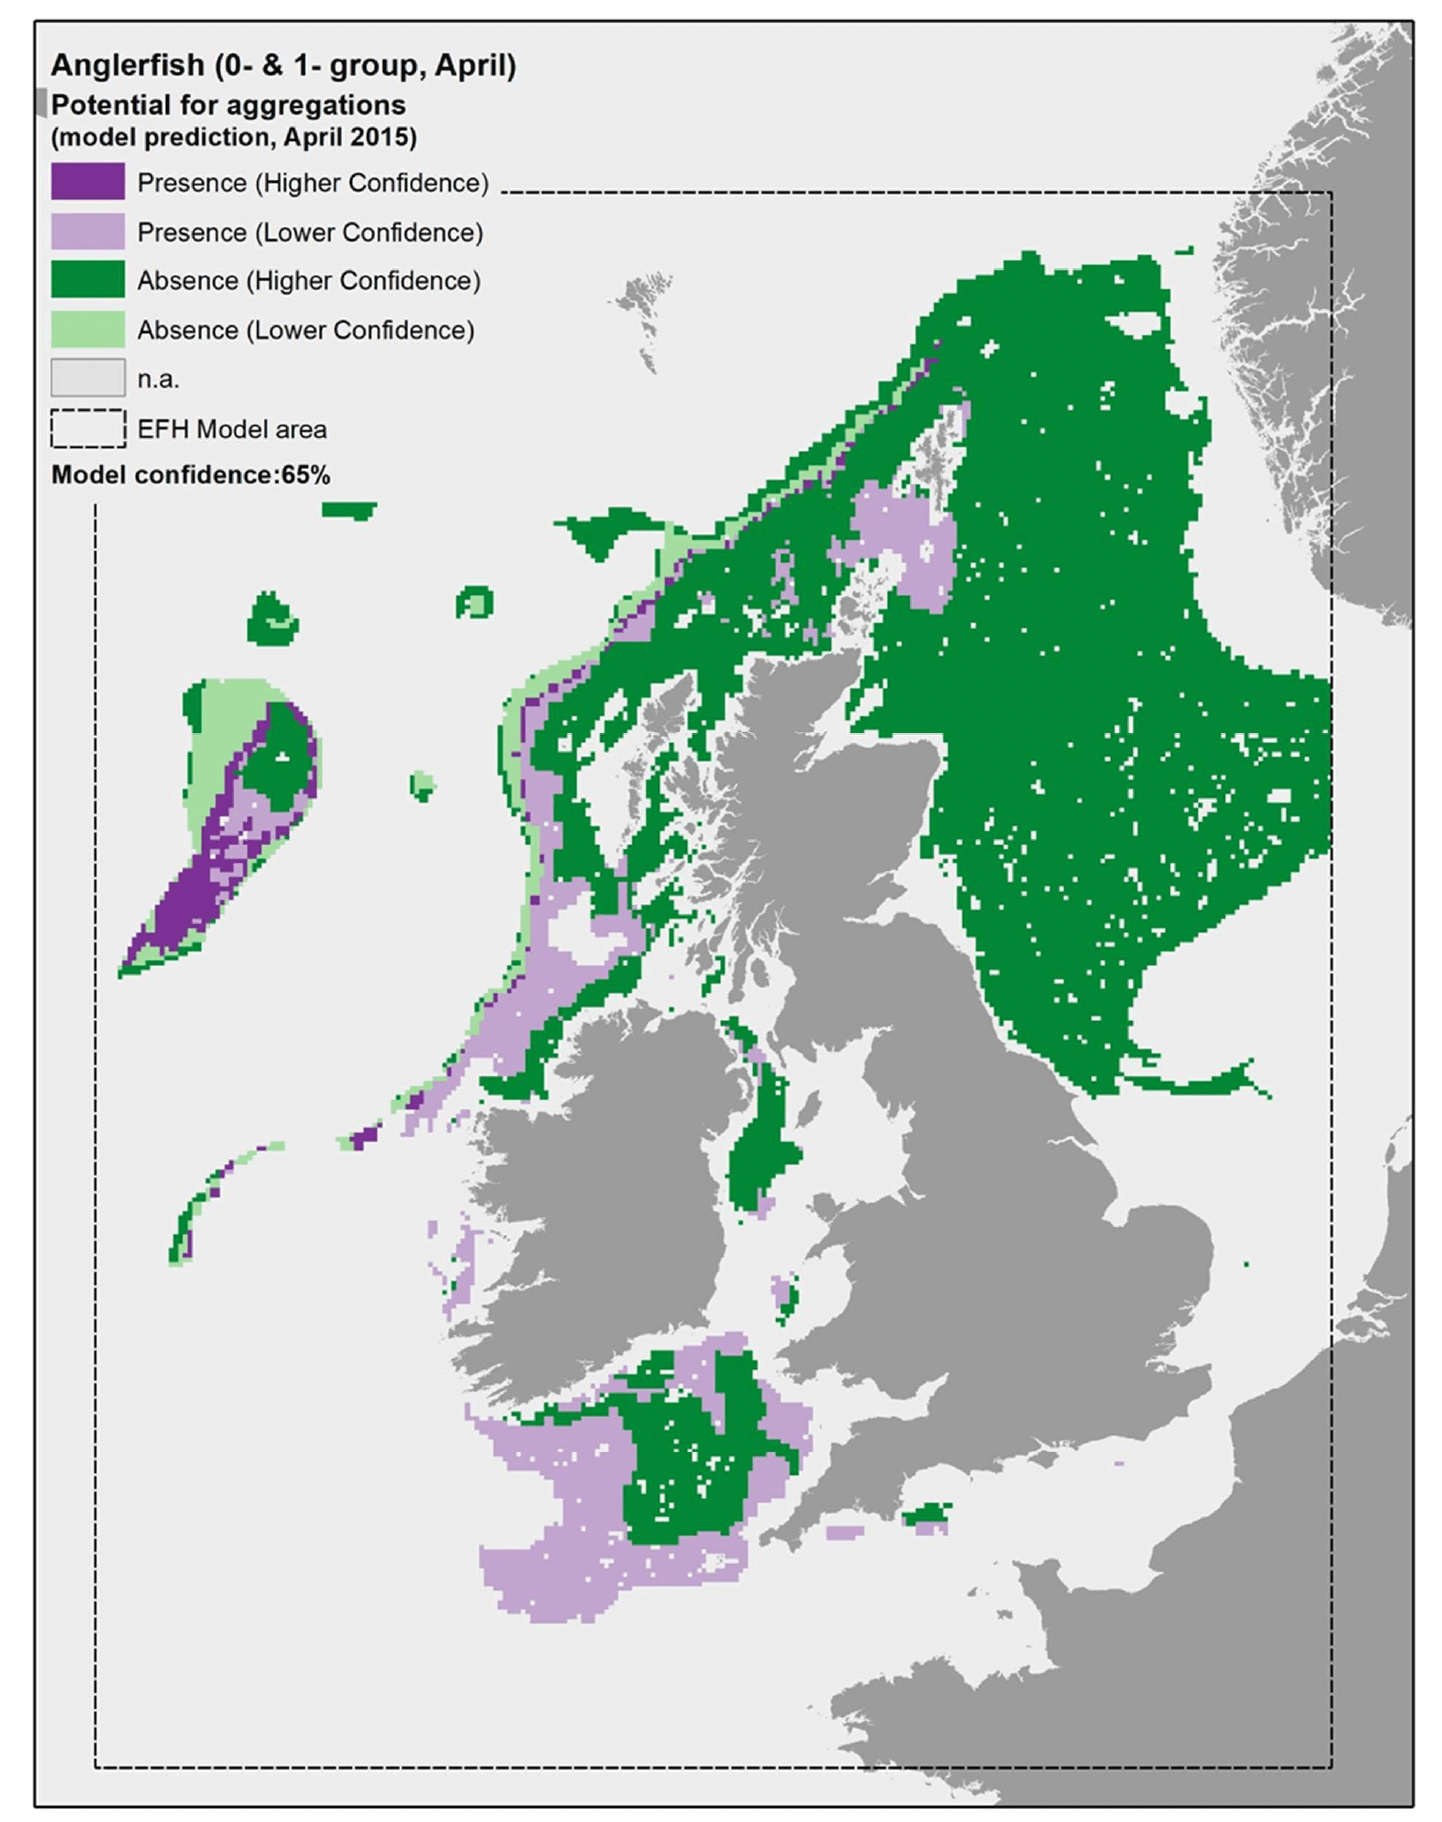
In turn, it appears that using the mean of spring environmental conditions over the study period 2010 - 2020 (particularly for the model predictors SBT, MLT and SSS) provides an inaccurate representation of the actual conditions experienced by anglerfish over the years, thus leading to the observed inaccuracies in the map prediction in Figure 22. In fact, when the model was applied to a more accurate environmental scenario (April 2015; Figure 40), a better matching with survey data and stakeholder feedback was observed.
3.1.9 Whiting, Merlangiusmerlangus
Whiting (Merlangius merlangus, Linnaeus 1758) is a demersal gadoid (cod-like) fish of commercial value, which is very common around much of the UK. It is designated as a Priority Marine Feature in Scotland seas. Whiting are pelagic spawners (in winter - spring) that demonstrate a high spatial fidelity to spawning sites, mostly located offshore, due to either geographical attachment or year-to-year persistence of the spatial distribution of the population (Annex 1). Nursery habitats for juveniles of the species are mostly inshore, with higher abundances often found in estuaries and sea lochs throughout the UK (Annex 1).
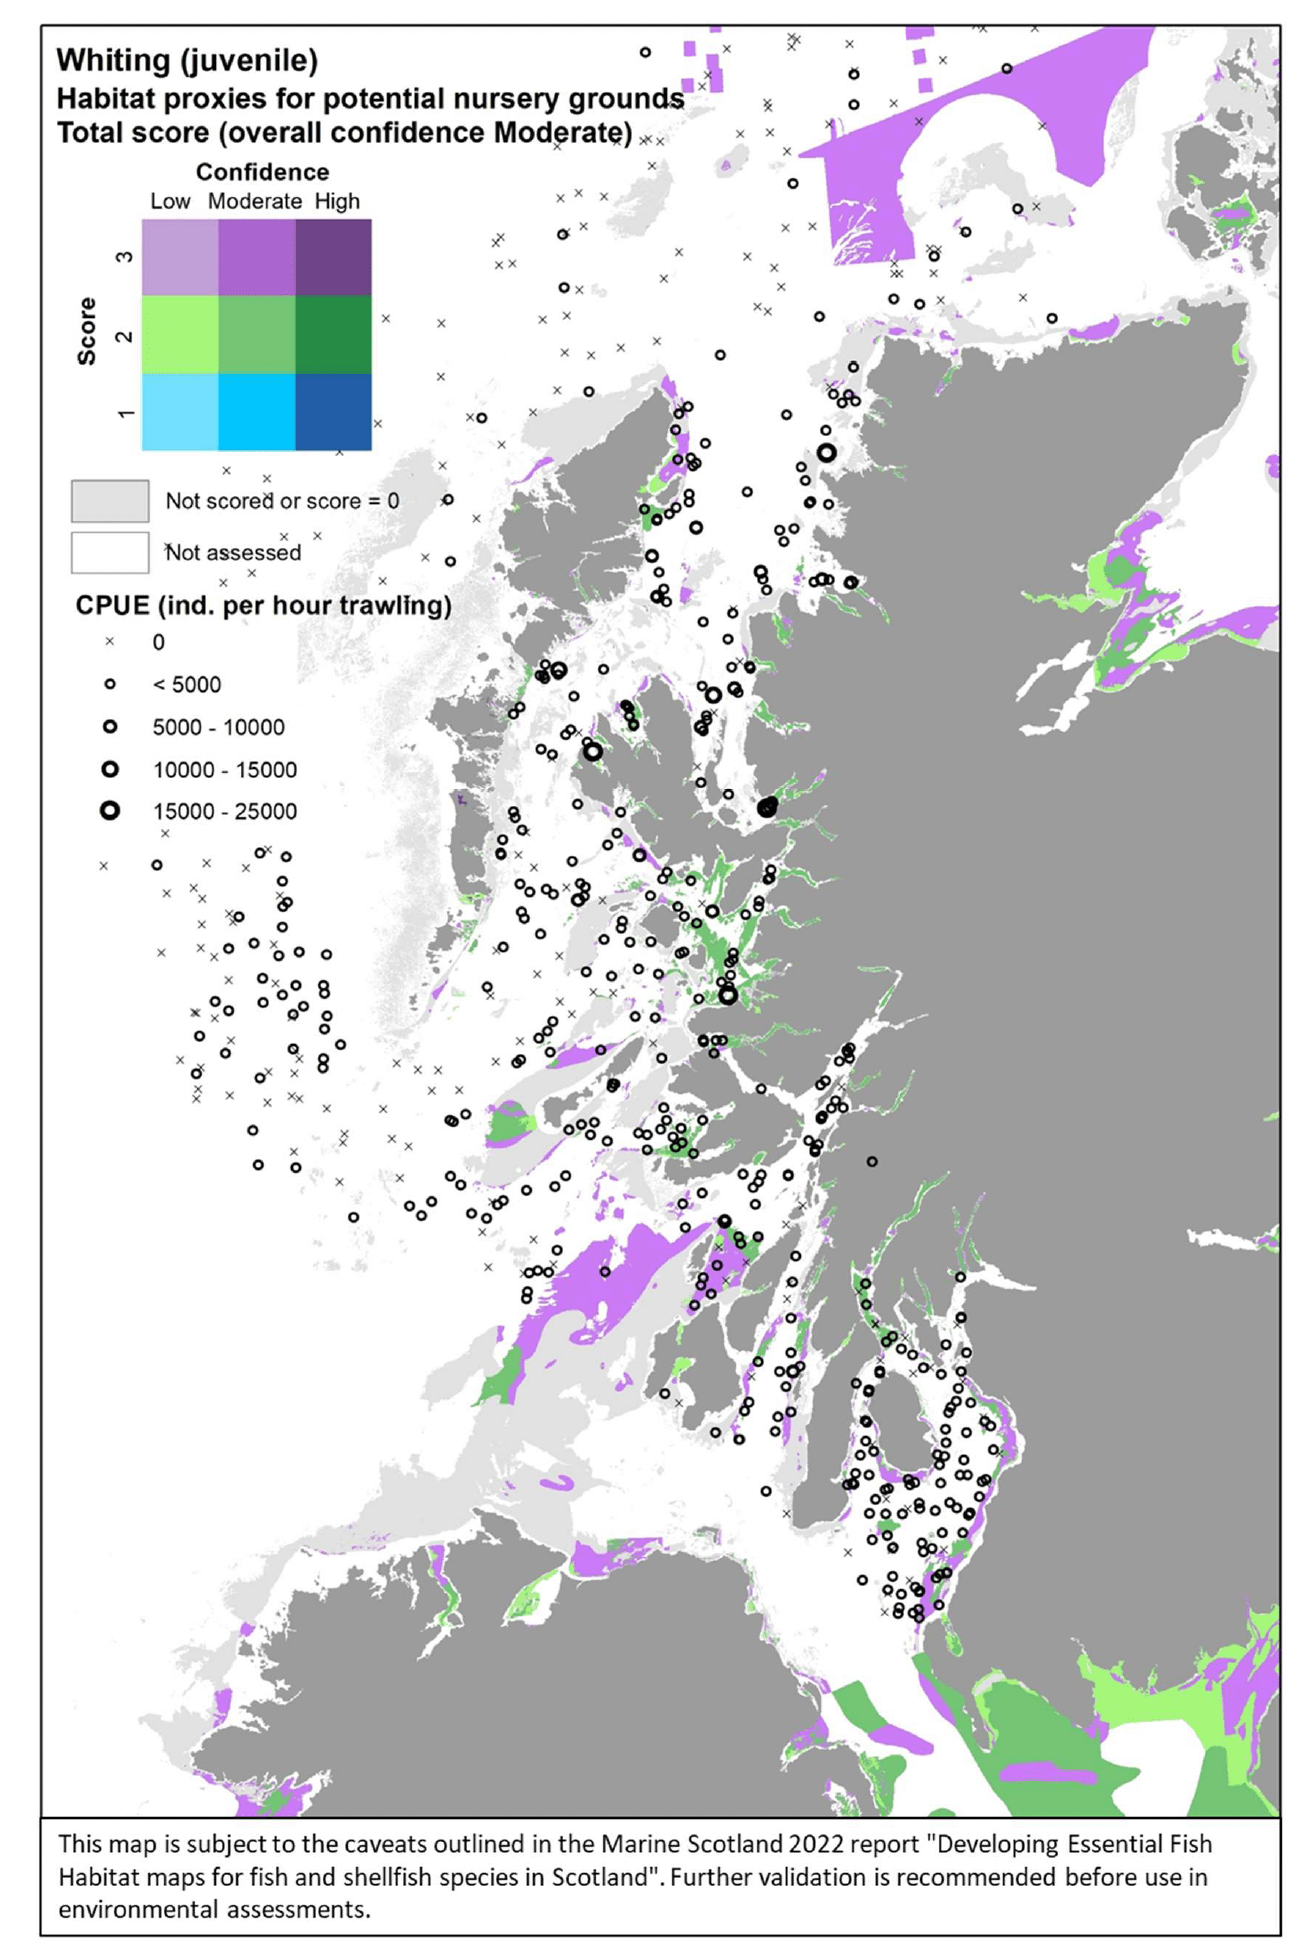
Whiting was assessed by using both the data-based model and the habitat proxy approach. The former allowed the authors to model the distribution of aggregations of both juveniles in summer-autumn and "running" individuals in winter as indicators of potential important habitats used as nursery or for spawning, respectively. Individuals of body length <16 cm and <20 cm were considered to identify 0-group whiting in summer and autumn catches from bottom trawl surveys, respectively. "Running" individuals were identified in the winter catches as mature individuals with gonads in spawning or spent condition as based on SMALK data available for the bottom trawl surveys analysed. The habitat proxy approach also allowed to identify habitats that may potentially be used by the juveniles of the species, with better coverage of inshore coastal areas.
Juveniles
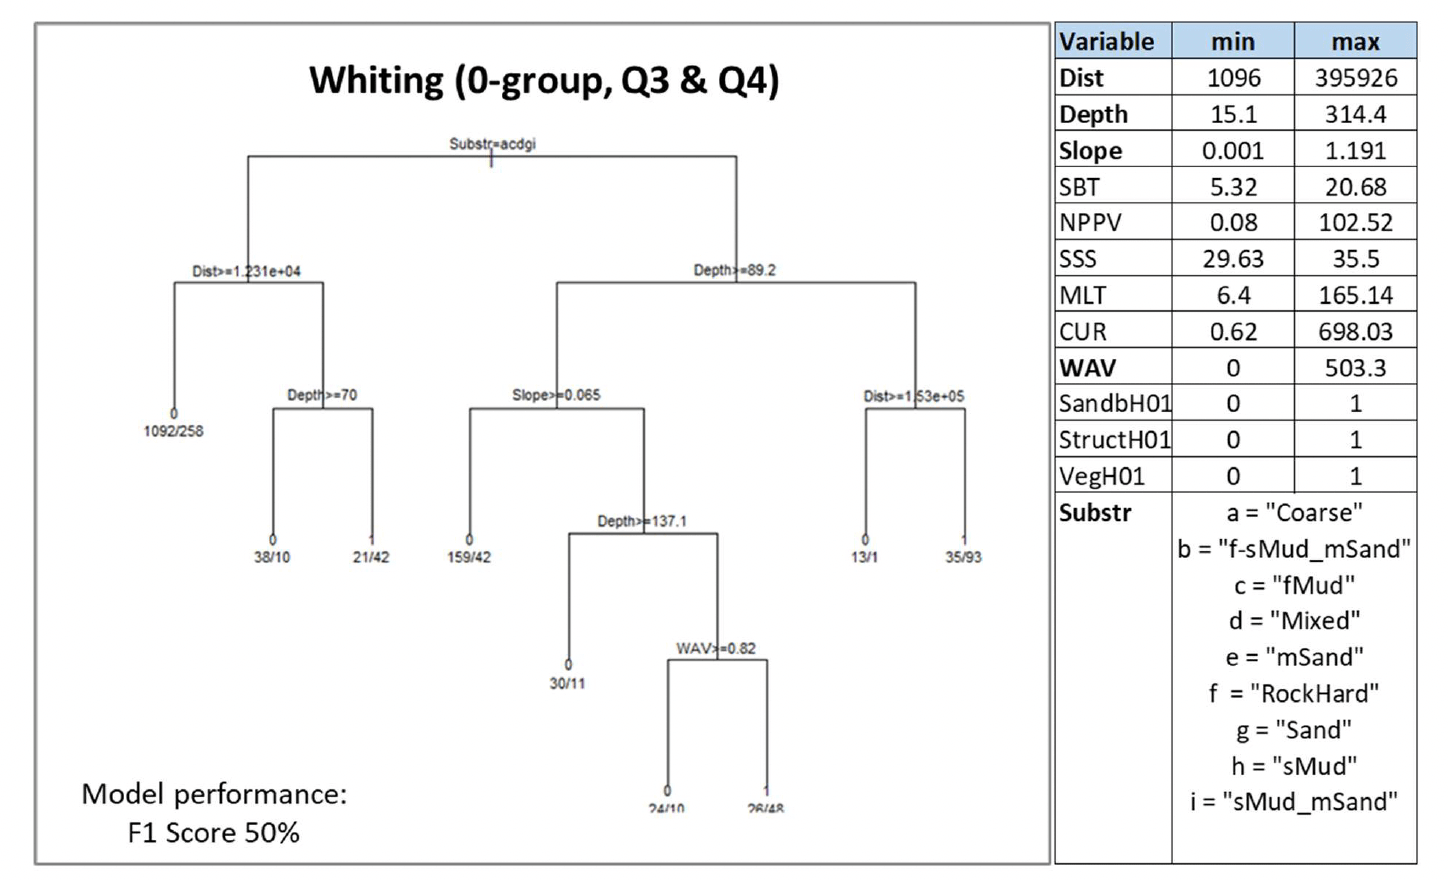
Depth and distance from the shore (Dist) were the most important predictors of juvenile whiting aggregations selected by the model, followed by substratum type (Substr) and wave energy at the seabed (WAV), and, lastly, slope. Juvenile aggregations were predicted to occur at various combinations of these variables (Figure 41). Predictions of occurrence were identified with the highest probability (0.73) on habitats with predominant sandy mud, muddy sand, or rock or other hard substrata, at shallower depth (<89.2 m) and within153 km from the shore.
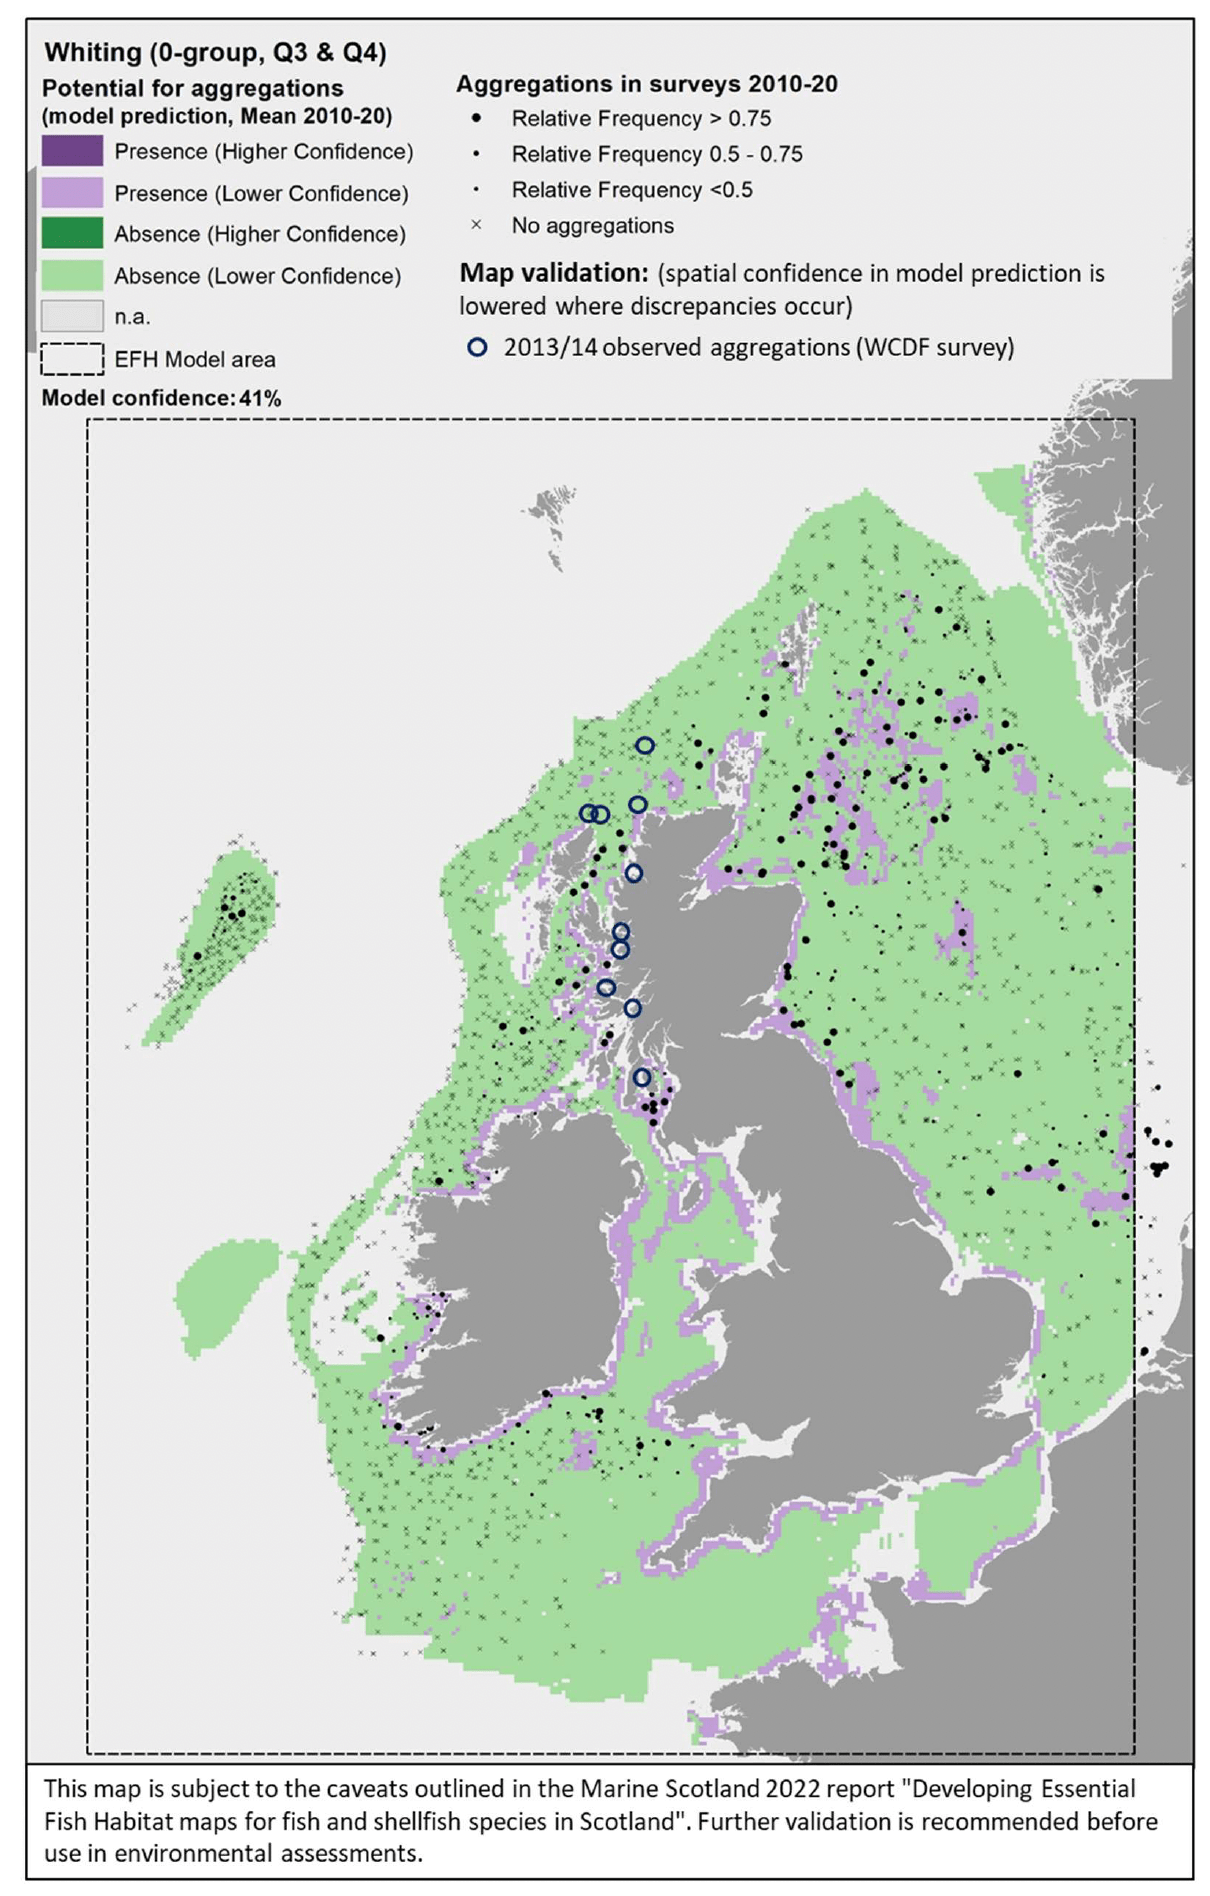
The model prediction applied to the mean environmental conditions of the period 2010 - 2020 (summer-autumn) allowed mapping of the potential distribution of juvenile aggregations as an indication of potential location of higher value juvenile habitats functioning as nursery for whiting (Figure 42). This was the only model that did not include non-persistent environmental variables (SBT, SSS, NPPV or MLT) as predictors and therefore the mapped prediction is not sensitive to the temporal variability (between and within years) of water quality conditions as for the other species/life stages mapped.
Based on the comparison with available survey data (both used for the model calibration and additional ones; Appendix C, Figure C17 and Figure C18) and the feedback from stakeholders, the mapped predictions appear to match well with the known distribution of juvenile whiting along the UK coast and in the northern North Sea, whereas the model appears to fail in predicting juvenile aggregations as observed in more offshore areas, e.g. at Rockall, off the southwest coast of Scotland, off Aberdeen and Forth estuary (Figure 42). This likely contributed to the moderate-low confidence (41%) associated with the model on the whole, although it is noted that, in some of these areas, survey catches are mostly infrequent. For example, stakeholder feedback highlighted that survey catch rates at Rockall are generally low, as also confirmed by fishery catches, so that it has been hypothesised that whiting in that area are vagrants from elsewhere rather than being part of a self-supporting stock from that area.
Additional survey data from demersal fish surveys on the west coast of Scotland have highlighted a wider distribution of juveniles in most inshore areas (Appendix C, Figure C18), which are poorly covered by the model predictions due to the distribution of the data on which the model was based (Figure 42). These areas are expected to be most important as nursery grounds, and are better assessed through the habitat proxy approach below.
For the assessment of habitat proxies for whiting juveniles inshore, sixteen publications were reviewed and provided characterisation of the species' habitat requirements, although in some cases this was not detailed enough to discriminate suitable habitats at the higher resolution (see Annex 1). This, along with expert input obtained with the stakeholder validation, led to a moderate confidence in the overall assessment of habitat proxies for juvenile whiting.
Sublittoral vegetated habitats (macrophyte-dominated sediments or seagrass beds) were identified as the most suitable habitats potentially functioning as nursery for whiting, with a high confidence associated (Table 14). Other structured habitats in the intertidal or subtidal zones were also identified as highly suitable, albeit with lower (moderate) confidence. These included seagrass beds on littoral sediments, littoral sediments dominated by aquatic angiosperms, maerl beds and kelp and seaweed communities on sublittoral sediments, as well as circalittoral sediments. Further possible habitats, scored with medium to low suitability and medium to low confidence (not shown in Table 14), included littoral sediments, infralittoral sediments, mussel beds and biogenic reefs.
The distribution of the inshore habitat proxies for whiting juveniles in the case study area is mapped in Figure 43, compared with the overall distribution of juveniles from the West Coast of Scotland Demersal Fish Survey (WCDF, 2013/14) in the area. Both the map and the survey data show that whiting juveniles are widely distributed in the area, including in deeper areas not covered by the habitat proxy map. Although juveniles have been found at some distance from the shore, they occur with higher abundance in coastal habitat closer to shore, in agreement with the distribution of habitat proxies, often covering bays and sea lochs (e.g. Loch Dunvegan, west of Skye, and Loch Carron, to the east). Suitable habitats have also been identified into the Moray Firth, matching the data-base model prediction and survey data in Figure 42. No stakeholder feedback was received on this map following consultation.
| Whiting (juvenile)–Habitat proxies for nursery function (Moderate confidenceoverall) |
|---|
| EUNIS Habitat type (score /confidence) |
| A2.6 Littoral sediments dominated by aquatic angiosperms (3/M) A2.61 Seagrass beds on littoral sediments (3/M) A5.2 Sublittoral sand (3/M) A5.25 Circalittoral fine sand (3/M) A5.26 Circalittoral muddy sand (3/M) A5.4 Circalittoral mixed sediments (3/M) A5.5 Sublittoralmacrophyte-dominatedsediment(3/H) A5.51 Maerl beds (3/M) A5.52 Kelp & seaweed communities on sublittoral sediment (3/M) A5.53 Sublittoral seagrass beds (3/H) |
Spawning
As for whiting spawning aggregations, the model was calibrated on all environmental variables excluding the water column mixing (MLT), and its correlate, depth (Pearson's correlation coefficient 0.9) was used instead.
Depth was the most important predictor selected by the model, followed by current energy at the seabed (CUR) and salinity (SSS), by slope, distance from the shore (Dist) and seabed temperature (SBT), and, lastly, by substratum type (Substr). Prediction of spawning aggregations was always excluded from habitats shallower than 74.8 m or deeper than 136 m, with very low current energy (≤3.96 N m2/s), in colder (mean monthly winter SBT <6.6°C) and more saline waters (SSS≥ 35.3) (Figure 44). Where present, spawning aggregations were predicted to occur with the highest probability (0.72) on habitats that were also characterised by predominant substrata such as sand, sandy mud, fine mud, mixed sediment, or rock or other hard substrata, low current energy at the seabed (<26.1 N m2/s), and with almost no slope (<0.01 degrees)
The model prediction applied to the mean winter environmental conditions of the period 2010 - 2020 allowed mapping of the potential distribution of whiting spawning aggregations as an indication of potential location of higher value spawning habitats (Figure 45).
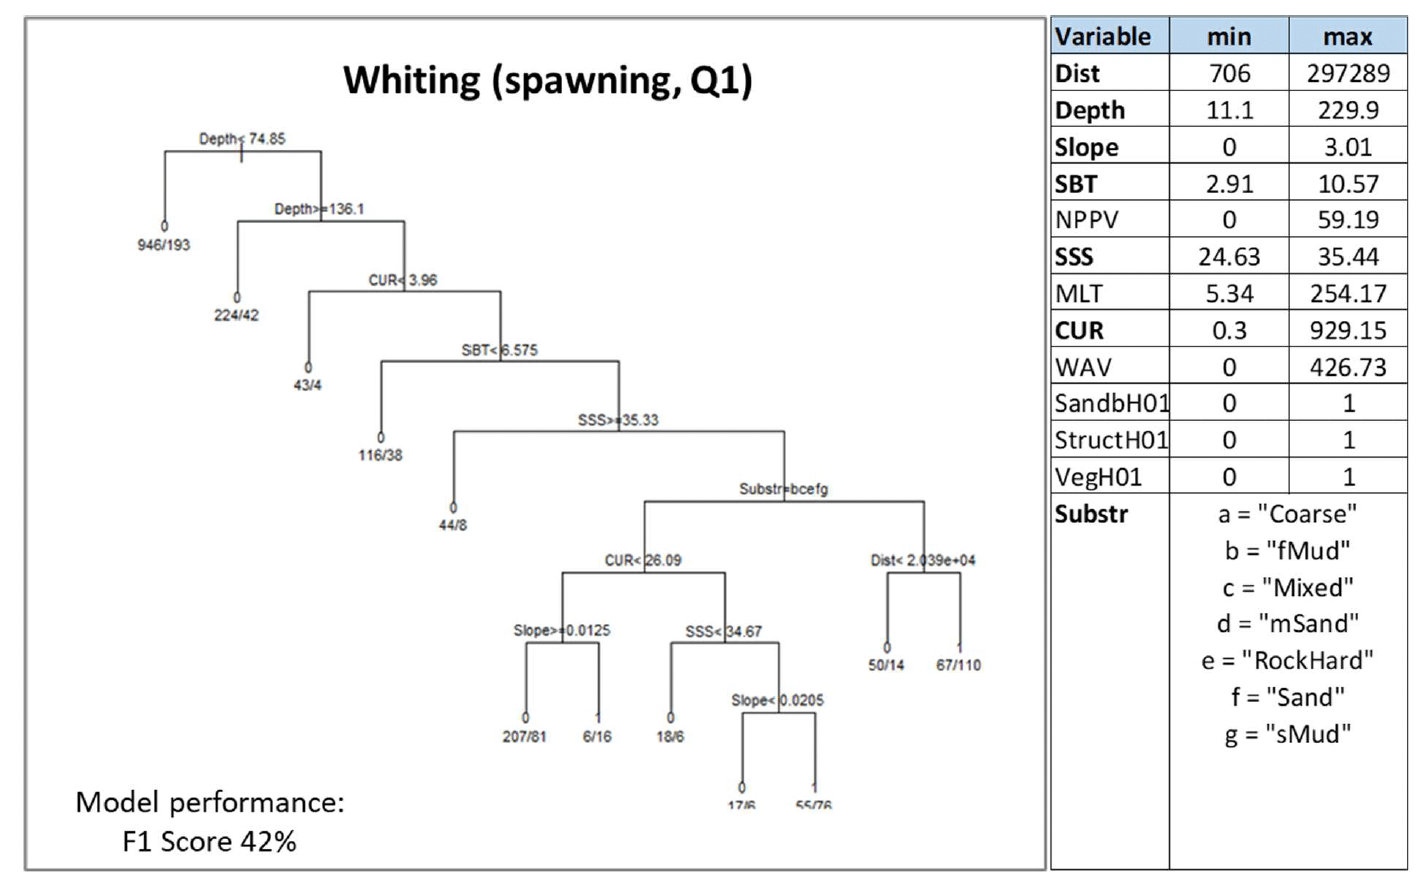
Comparison with available survey data (used for the model calibration; Appendix C, Figure C20) and the feedback from stakeholders showed a relatively good matching with the mapped predictions of spawning aggregations in the central and northern North Sea, north coast of Scotland and offshore areas to the west of Scotland. In turn, the model appeared to fail in predicting spawning aggregations observed in wide areas of the southern North Sea and eastern English Channel, likely contributing to the low confidence (36%) associated with this model. Stakeholder feedback also indicated the presence of spawning grounds for whiting in the English Channel and on the Trevose ground, where spawning aggregations were suitable conditions for spawning aggregations were not identified by the model (Figure 45). Therefore, a lower confidence should be associated with these predictions in the map and this is highlighted in the blue boxes.
3.1.10 Cod, Gadusmorhua
Atlantic cod (Gadus morhua Linnaeus 1758), hereafter referred to as "cod", is a demersal gadoid fish of high commercial value, which is common around much of the UK (although less common than it used to be 30 years ago due to stock decline). It is designated as a Priority Marine Feature in Scotland seas. It is a pelagic winter spawner, which aggregates over specific grounds to spawn, mostly located offshore, and shows a high seasonal fidelity to spawning sites (Annex 1). Juveniles are demersal, with nursery habitats for 0-group Cod being almost exclusively inshore, in shallow waters and often associated with 'complex' habitats (e.g. associated with vegetation, maerl, biogenic structures on gravelly seabed). As juveniles grow, larger individuals gradually migrate to deeper waters to join adult stocks (Annex 1).
Cod was assessed by using both the data-based model and the habitat proxy approach. The former allowed to model the distribution of aggregations "running" individuals in winter as indicator of potential important habitats used for spawning. These were identified as winter aggregations of mature individuals with gonads in spawning or spent condition as based on SMALK data available for the bottom trawl surveys analysed. The habitat proxy approach, in turn, was used to identify inshore habitats that may potentially be used by the juveniles of the species.
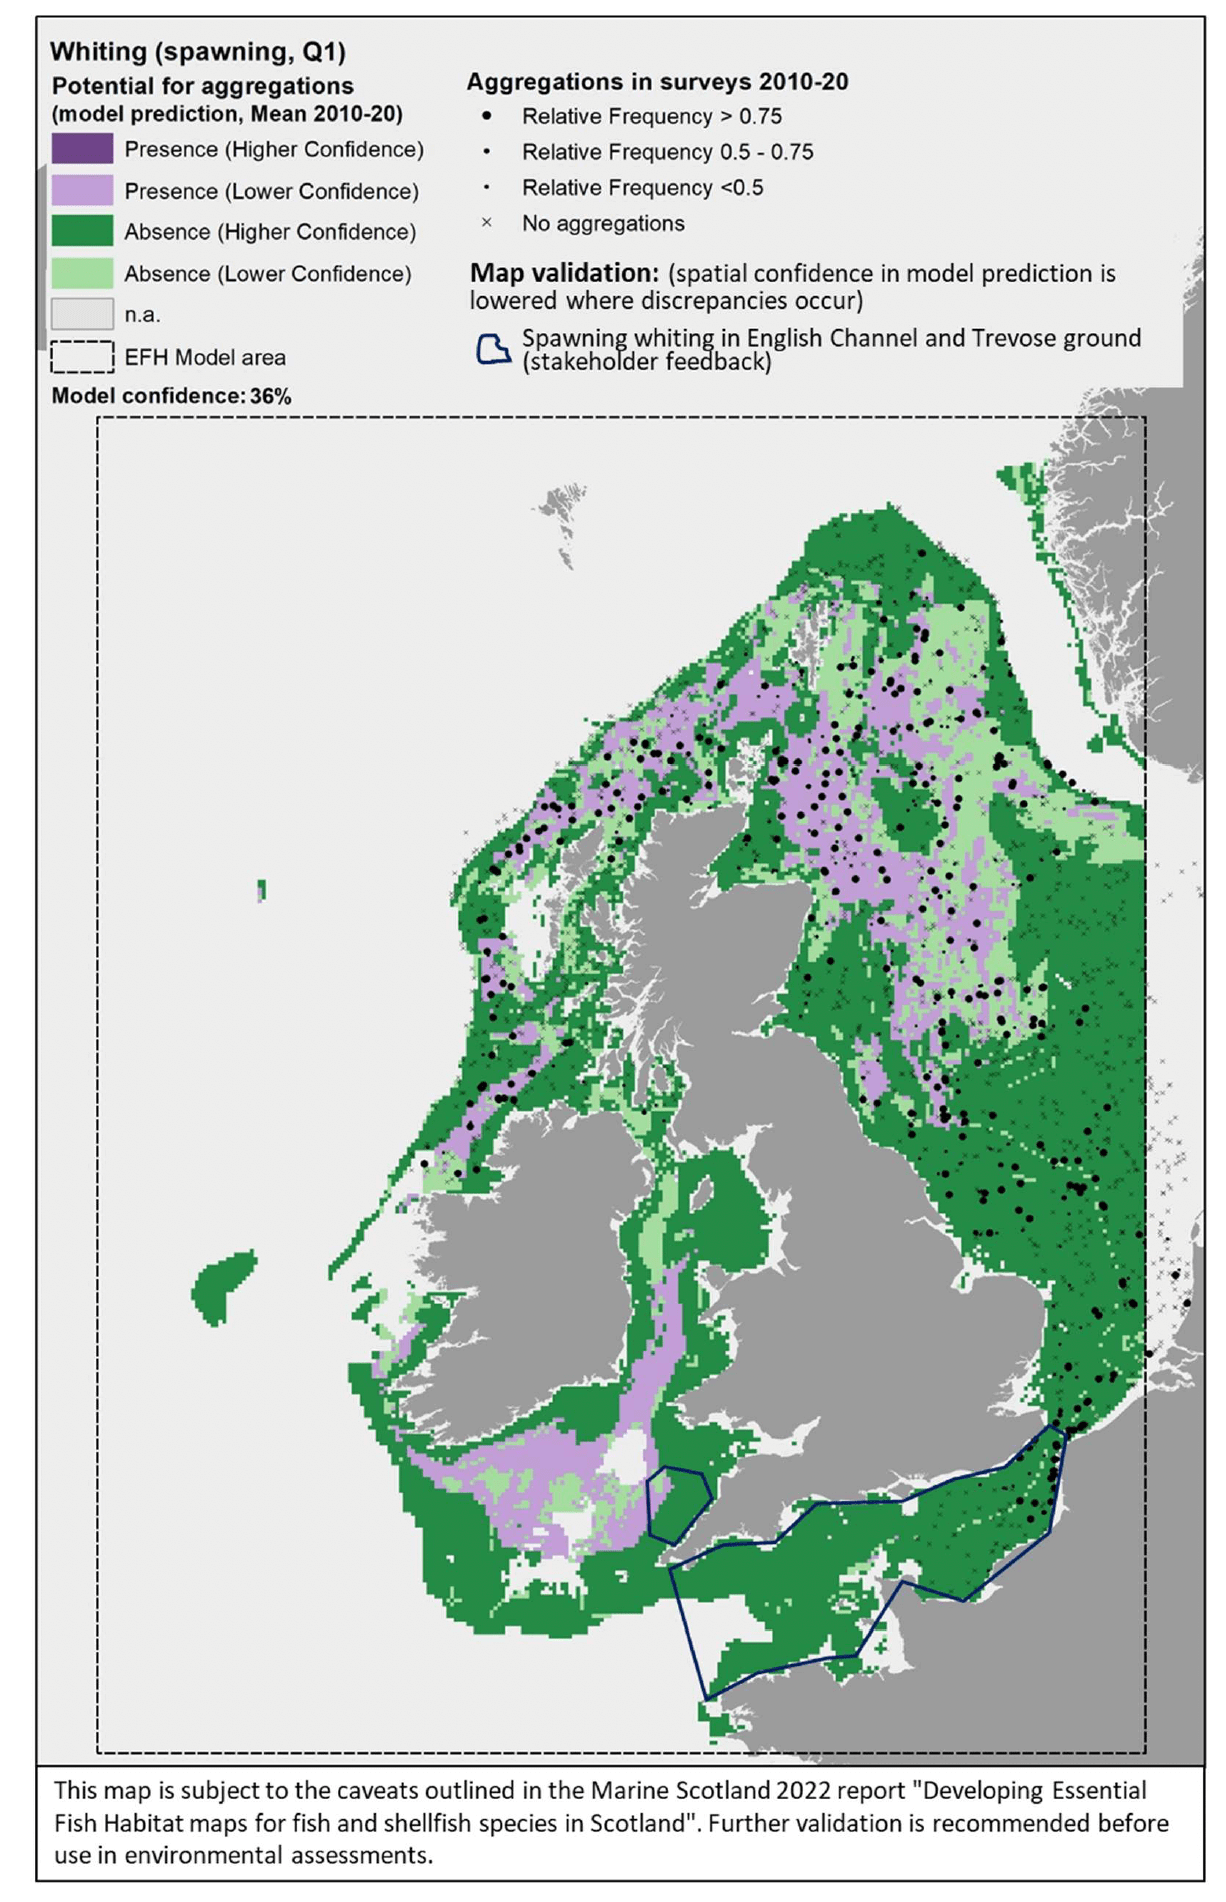
Juveniles
For the assessment of habitat proxies for cod juveniles inshore, fourteen publications were reviewed. These provided characterisation of the species' habitat requirements, although in some cases this was not detailed enough to discriminate suitable habitats at the higher resolution (see Annex 1). This, along with expert input obtained with the stakeholder validation, led to a moderate confidence in the overall assessment of habitat proxies for juvenile cod..
Juvenile cod had a range of potentially suitable habitats inshore. In terms of depth there was not a specific preference, with habitats from the littoral, infralittoral and sublittoral zones all scoring with high suitability and high or medium confidence (Table 15). The most suitable (scoring 3/H) were determined to be those habitats with prevalence of aquatic angiosperms, macrophytes and seagrasses. Other likely habitats included maerl beds, biogenic reefs and mussel beds. Further possible habitats, scored with medium to low suitability and medium to low confidence (not shown in Table 15), included sandy and mixed sediments in the infralittoral, circalittoral and sublittoral zones.
The distribution of the inshore habitat proxies for cod juveniles in the case study area is mapped in Figure 46, compared with the overall distribution of juveniles from the West Coast of Scotland Demersal Fish Survey (WCDF, 2013/14) in the area. Although potentially suitable habitats appear to be widely distributed in the case study area (albeit their suitability was identified as low in the assessment, based on literature review and stakeholder feedback), survey data seem to confirm the occurrence of cod juveniles mostly
to the south of the study area, in the Firth of Clyde. Higher abundances were particularly found in the survey catches from the inner reaches (e.g. Loch Long, Loch Fyne), where suitable habitat proxies were also identified. However, gaps in the habitat map (due to lack of coverage by the EUNIS habitat data layers) restricted the ability to identify habitat proxies for juvenile cod in these inner areas. No stakeholder feedback was received on this map following consultation.
| Cod (juvenile) – Habitat proxies for nursery function (Moderate confidence overall) |
|---|
| EUNIS Habitat type (score /confidence) |
| A2.6 Littoralsedimentsdominatedbyaquaticangiosperms(3/H) A2.61 Seagrass beds on littoral sediments (3/M) A3.1 Atlantic and Mediterranean high energy infralittoral rock (3/M) A3.11 Kelp with cushion fauna and/or foliose red seaweeds (3/M) A3.15 Frondose algal communities (other than kelp) (3/M) A5.5 Sublittoral macrophyte-dominated sediment(3/H) A5.51 Maerl beds (3/M) A5.52 Kelp and seaweed communities on sublittoral sediment (3/M) A5.53 Sublittoral seagrass beds(3/H) A5.6 Sublittoral biogenic reefs (3/M) A5.62 Sublittoral mussel beds on sediment (3/M) |
Spawning
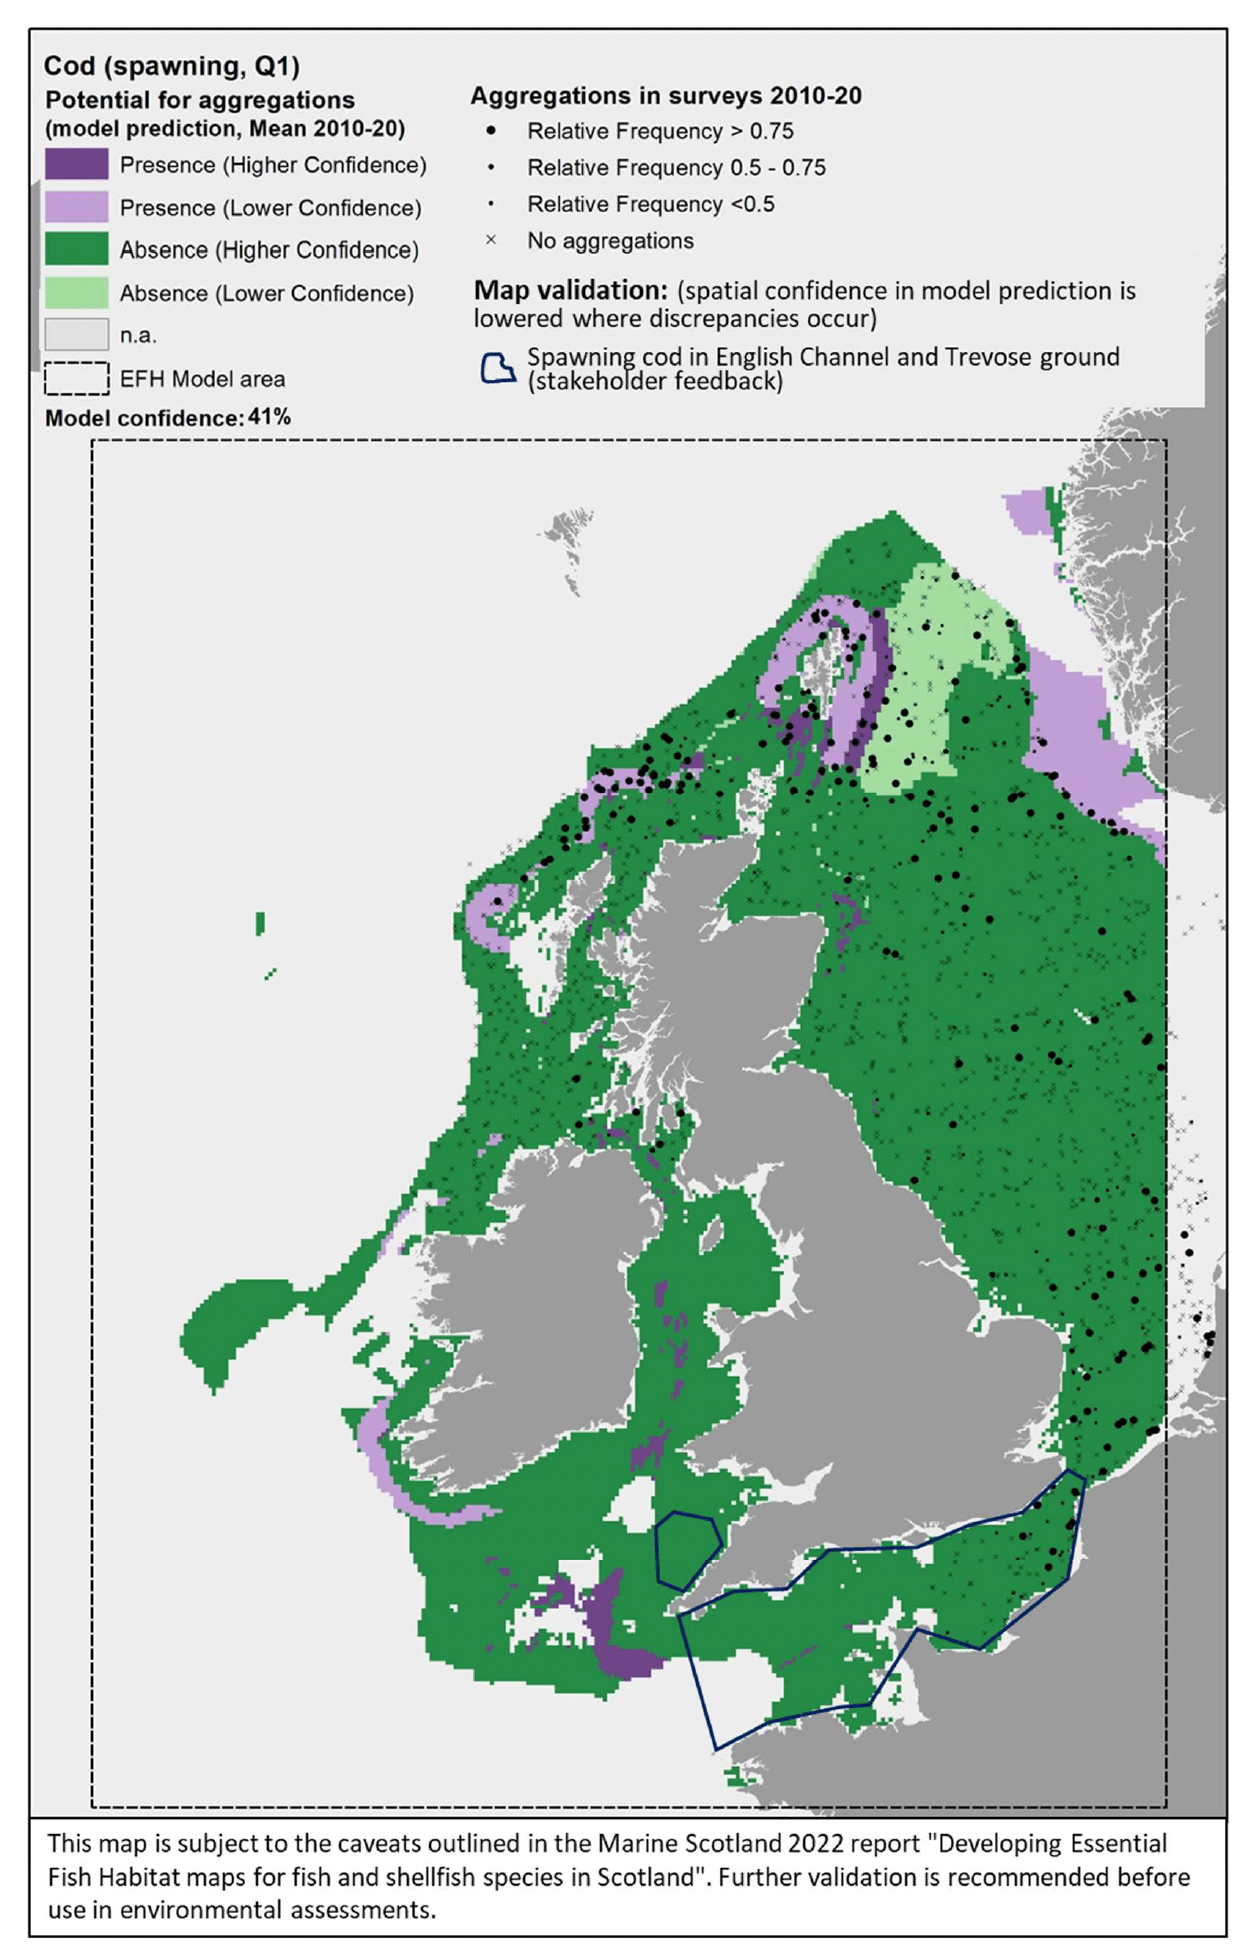
Water column mixing (MLT) was excluded from the analysis due to its collinearity with depth (Pearson's correlation coefficient 0.9), which was used instead. Depth and current energy at the seabed (CUR) were identified as the most important predictors of cod spawning aggregations, followed by distance from the shore (Dist) and salinity (SSS), and seabed temperature (SBT) and primary production (NPPV).
Cod spawning aggregations were generally predicted as absent from areas shallower than 95.6 m (Figure 47). They were predicted to occur with the highest probability (0.83) in areas with wide ranging current energy at the seabed (≥53.9 N m2/s) to a maximum depth of 112m. In lower current energy conditions, spawning aggregations were also predicted as highly probable (0.82) in areas with higher salinity (≥35.2), lower seasonal temperature at the seabed (<8°C) and at a distance between 39 and 60 km from the shore.
The model prediction applied to the mean winter environmental conditions of the period 2010 - 2020 allowed mapping of the potential distribution of cod spawning aggregations as an indication of potential location of higher value spawning habitats (Figure 48).
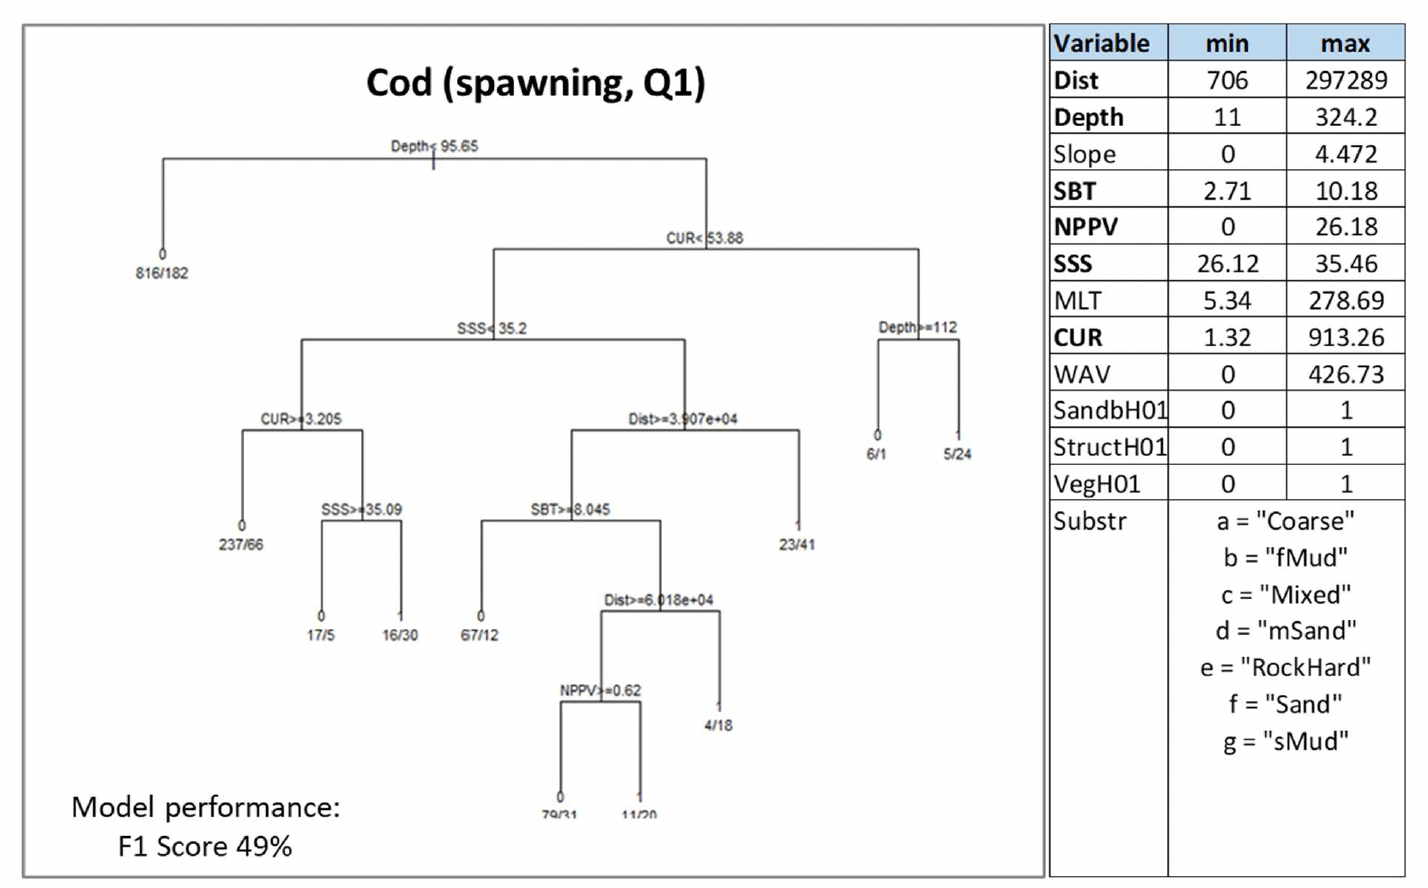
Based on the comparison with available survey data (used for the model calibration; Appendix C, Figure C21) and the feedback from stakeholders, the mapped predictions appear to better predict the distribution of spawning cod in the northern North Sea and off the north coast of Scotland. However, the map appears to fail in predicting the aggregations observed in other areas of the North Sea, and particularly to the south (Figure 48). Such discrepancies have likely contributed to the moderate-low confidence (41%) associated with this model on the whole. Stakeholders also highlighted the presence of spawning grounds for cod in the English Channel and on the Trevose ground, off the north coast of Cornwall, and therefore the absence predicted by the model, particularly in these southern areas, is to be taken with lower confidence (Figure 48).
3.1.11 Haddock, Melanogrammusaeglefinus
Haddock (Melanogrammus aeglefinus, Linnaeus 1758) is a demersal gadoid (cod-like) fish of commercial value, which is found throughout British and Irish waters, although it is more common in northern waters (e.g. off north-eastern Scotland, northeast England, Irish sea). The species mostly occurs offshore. It is a pelagic spawner (in winter - spring) known to aggregate over specific spawning grounds offshore. Juveniles are also pelagic, and they appear to disperse soon after settling, without occupying distinct areas of habitat repeatedly selected over time, therefore suggesting no particular use of nursery areas (Annex 1).
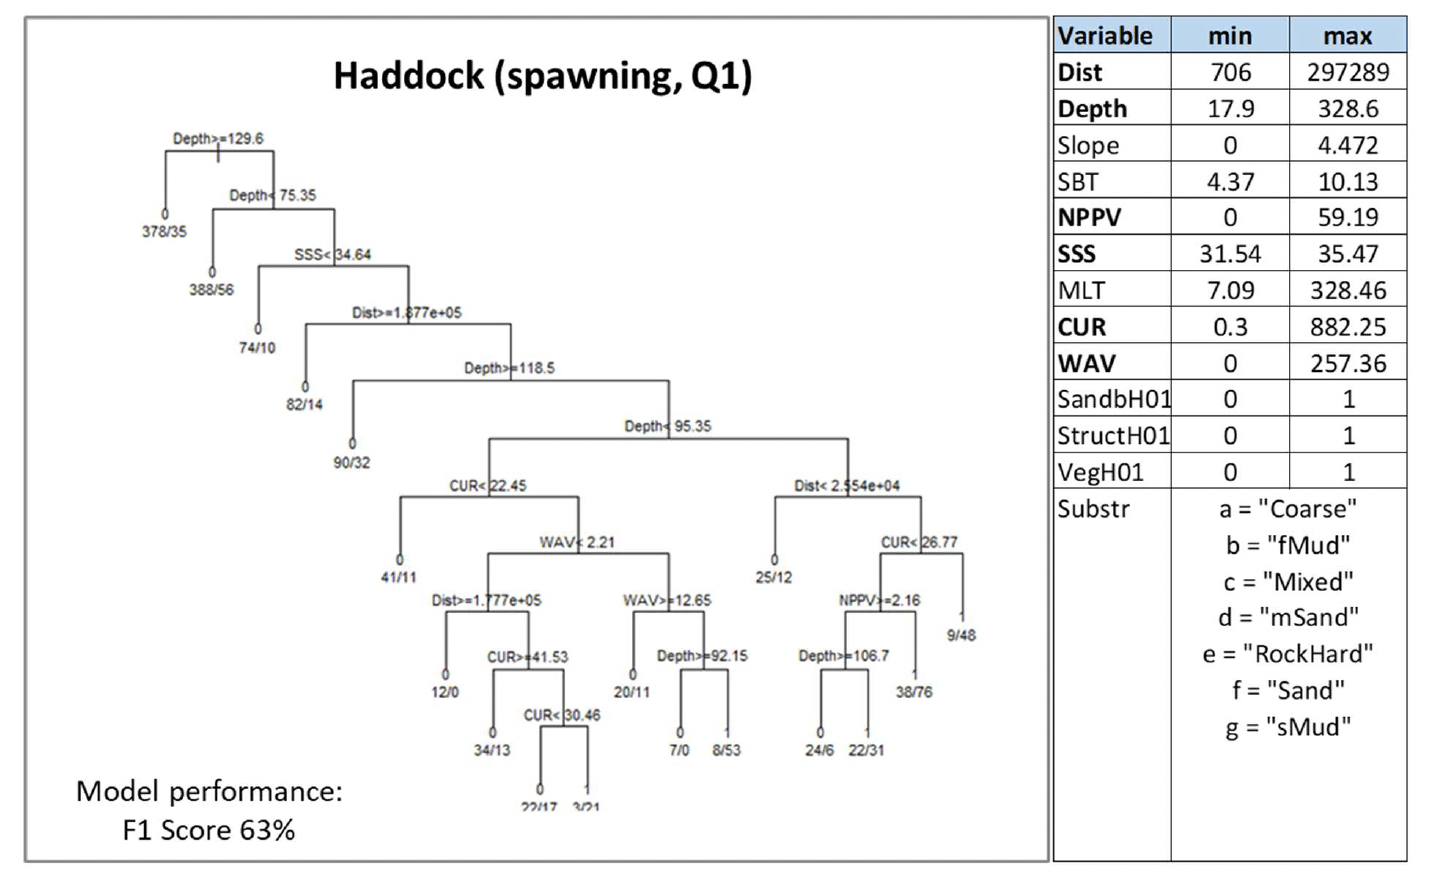
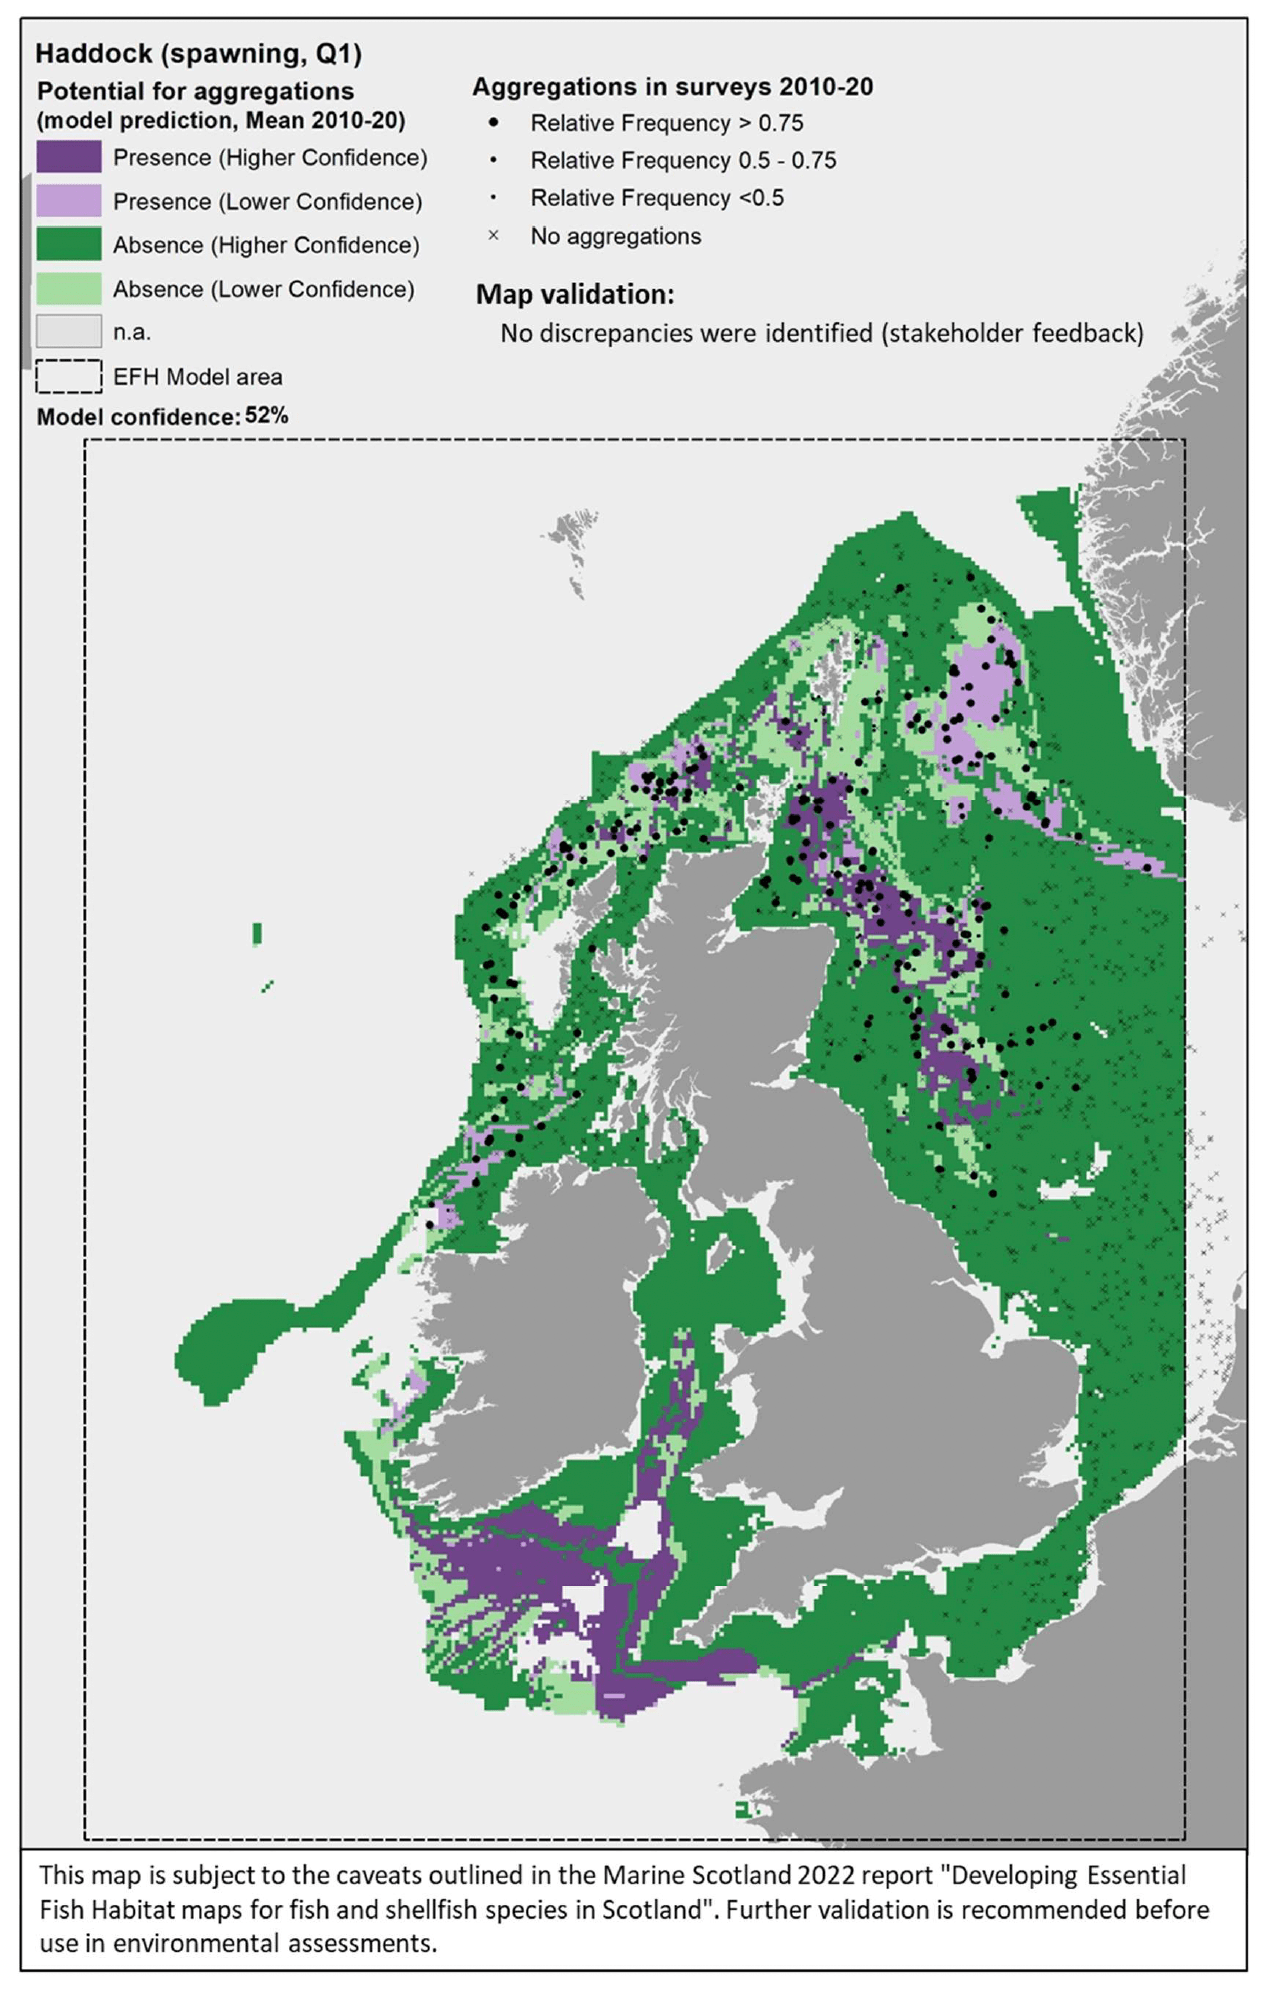
Haddock was assessed through modelling of spawning aggregations based on winter bottom trawl data as indicator of potential important habitats used for spawning. Mature individuals with gonads in spawning or spent condition were identified as based on SMALK data available for the bottom trawl surveys analysed.
Water column mixing (MLT) was excluded from the analysis due to its collinearity with depth (Pearson's correlation coefficient 0.9), which was used instead. Depth was by far the most important predictor of haddock spawning aggregations, this variable recurring at different levels of the decision tree model (Figure 49). Distance from the shore (Dist), current and wave energy at the seabed (CUR, WAV), salinity (SSS) and primary production (NPPV) were also selected as predictors by the model. Prediction of spawning aggregations was always excluded from habitats shallower than 75.3 m or deeper than 118 m, farther than 188 km from the shore and with salinity lower than 34.6 (Figure 49). Where present, spawning aggregations were generally predicted to occur with higher probability (0.87) in habitats at depths down to a maximum of 95.3 m and current energy at the seabed ≥22.5 N m2/s.
Under these conditions, presence of aggregations was predicted specifically in habitats with very low energy (CUR between 30.5 and 41.5 N m2/s and WAV <2.21 N m2/s) and within 178 km from the shore, or where wave energy is slightly higher (but still generally low, between 2.21 and 12.6 N m2/s) and at depth <92.1 m.
The model prediction applied to the mean winter environmental conditions of the period 2010 - 2020 allowed mapping of the potential distribution of haddock spawning aggregations as an indication of potential location of higher value spawning habitats (Figure 50).
Based on the comparison with available survey data (used for the model calibration; Appendix C, Figure C23), the mapped predictions appear to predict well the distribution of spawning haddock in the central and northern North Sea and off the north coast of Scotland, with suitable habitats for spawning aggregations also being identified over most of the Celtic Seas (Figure 50). In turn, the distribution of survey data suggests that aggregations also occur along the Atlantic coast west of Scotland, despite the model predicting absence in some of these areas. No particular discrepancies with stakeholder knowledge were highlighted during consultation.
3.1.12 Norway pout, Trisopterusesmarkii
Norway pout (Trisopterus esmarkii, Nilsson 1855) is a benthopelagic gadoid (cod-like) fish of limited commercial value in the UK. It is found throughout British and Irish waters, although it is more common on the west coast. Norway pout is an important food item in the diet of other gadoid predators (e.g. hake, cod, whiting and pollack) and is designated as a Priority Marine Feature in Scotland's seas. The species occurs both inshore and offshore, although its spawning grounds are mostly located offshore, with spawning occurring mainly in winter over the coastal shelf and in spring in deeper areas. This species is not considered to have specific nursery grounds (Annex 1).
Norway pout was assessed through modelling of spawning aggregations based on winter bottom trawl data as indicator of potential important habitats used for spawning. Mature individuals with gonads in spawning or spent condition were identified as based on SMALK data available for the bottom trawl surveys analysed.
Water column mixing (MLT) was excluded from the analysis due to its collinearity with depth (Pearson's correlation coefficient 0.9), which was used instead. Depth was by far the most important predictor of Norway pout spawning aggregations, this variable recurring at different levels of the decision tree model (Figure 51). Seabed temperature (SBT) and substratum type (Substr) were also moderately important predictors, followed by distance from the shore (Dist), slope and primary production (NPPV). Prediction of spawning aggregations was always excluded from habitats shallower than 111 m or deeper than 159 m, within 20 km of the shore and with slope ≥0.17 degrees (Figure 51). In turn, spawning aggregations were predicted to occur either in habitats within 113 km of the shore where the dominant substratum is muddy sand, sand, coarse or mixed sediment (0.58 probability), or in deeper (≥119 m) habitats further offshore (Dist ≥113 km), with warmer waters (mean winter seabed temperature ≥6.9°C) and excluding areas with very low productivity (NPPV ≥1.3 mg C m-3 day-1) (0.68 probability).
The model prediction applied to the mean winter environmental conditions of the period 2010 - 2020 allowed mapping of the potential distribution of Norway pout spawning aggregations as an indication of potential location of higher value spawning habitats (Figure 52).
Based on the comparison with available survey data (used for the model calibration; Appendix C, Figure C24), the mapped predictions appear to predict well the distribution of spawning Norway pout in the northern North Sea and off the north and west coast of Scotland, although a low probability of presence and associated low spatial confidence is associated with these predictions (Figure 52).
The potential presence of spawning aggregations is also predicted in some areas of the Celtic Seas, although stakeholder feedback suggested that spawning areas of Norway pout in this region are more widespread. The distribution of survey data suggests that aggregations also frequently occur in the central North Sea, despite the model predicting absence in some of these areas.
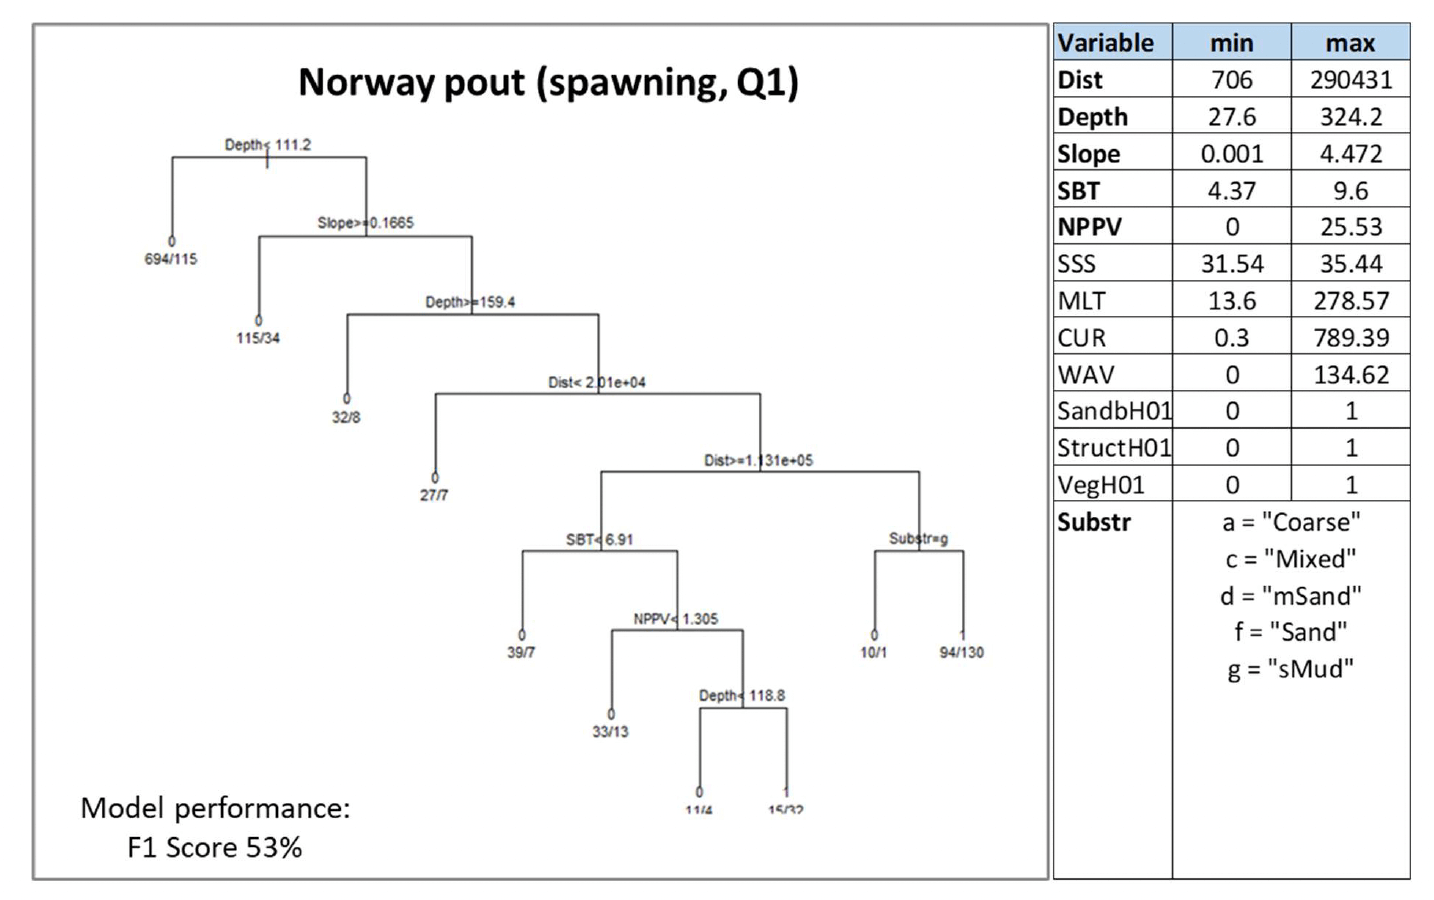
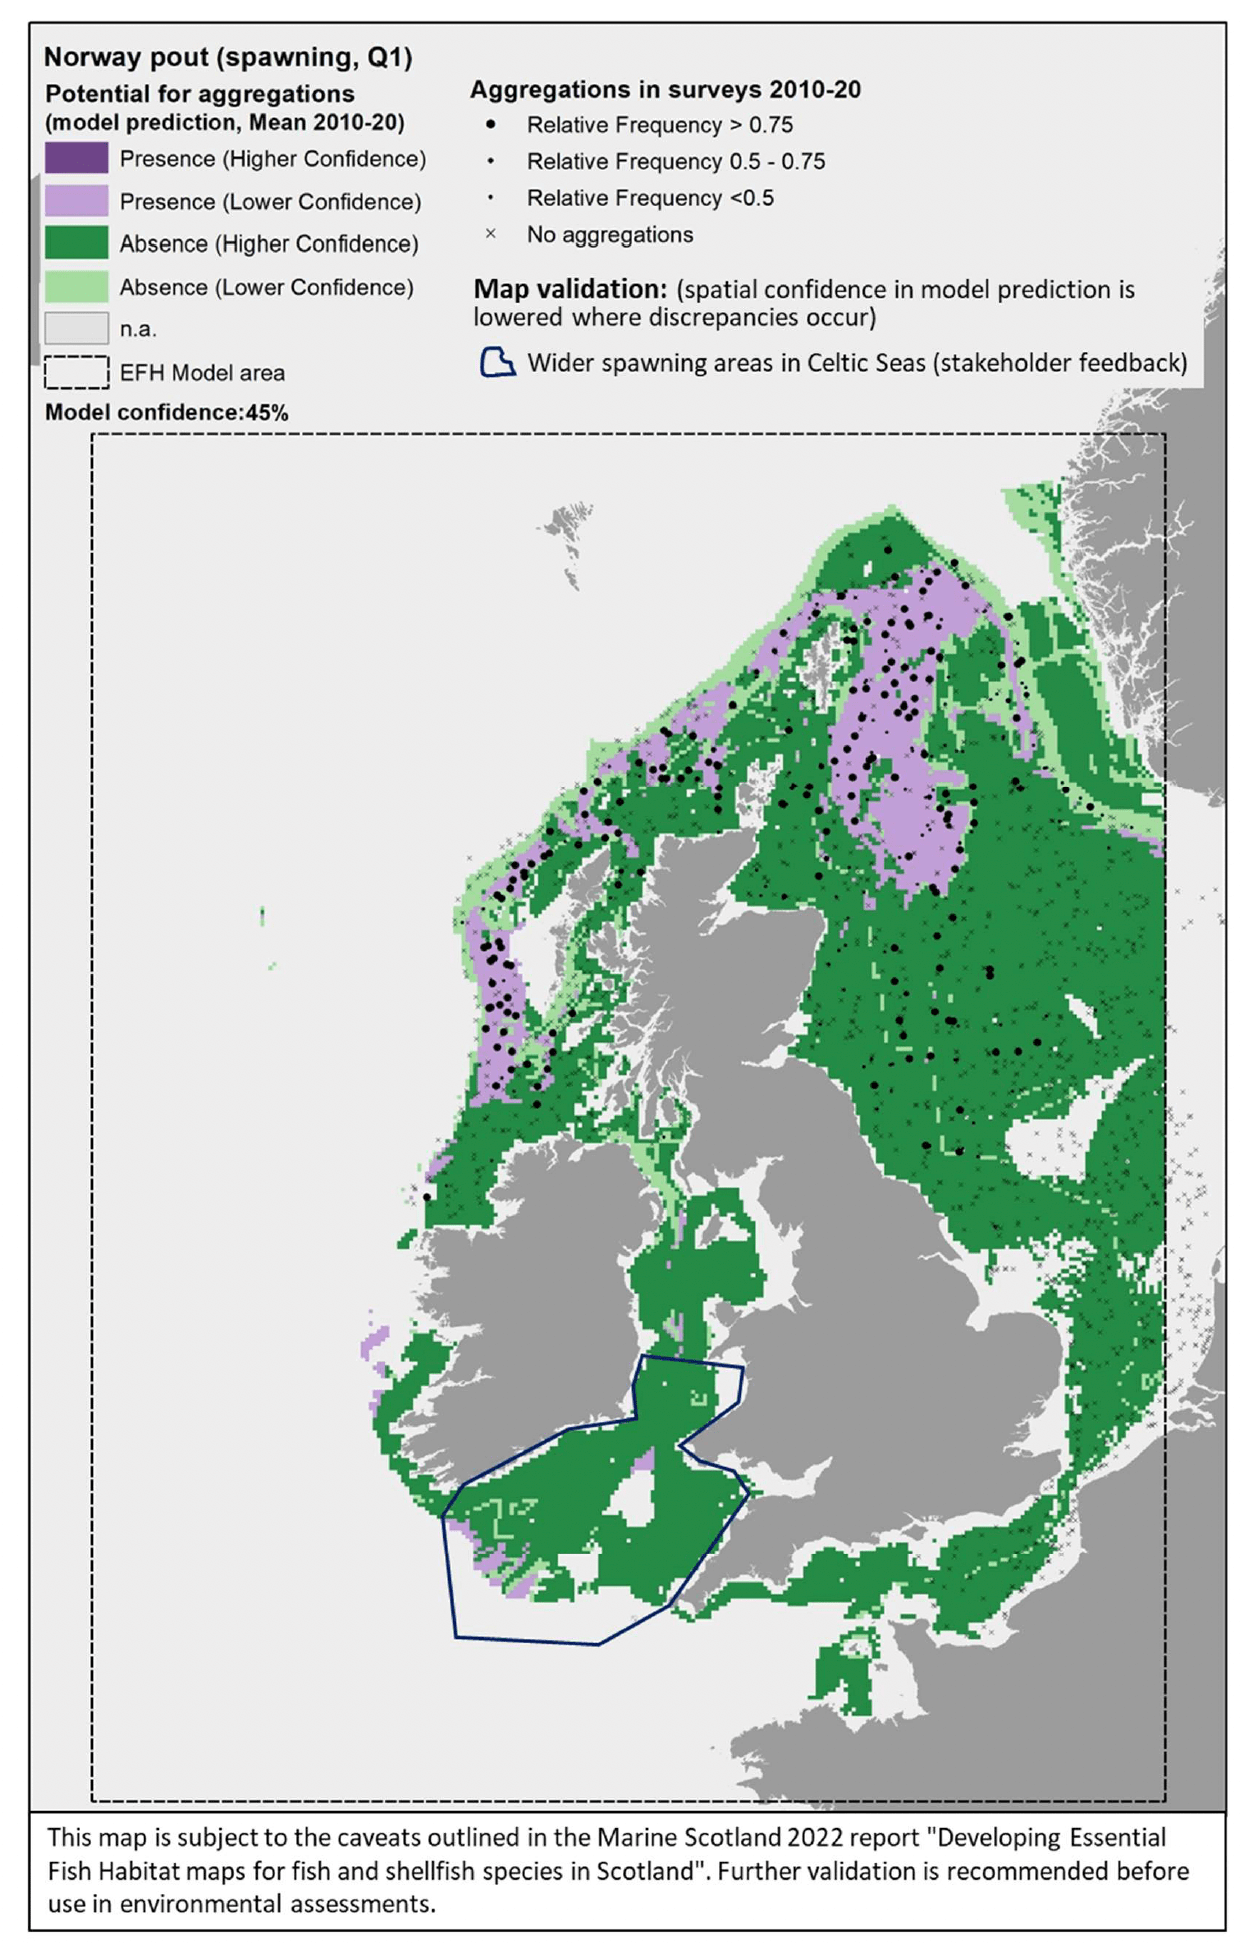
3.1.13 Blue whiting, Micromesistiuspoutassou
Blue whiting (Micromesistius poutassou, Risso 1827) is a benthopelagic gadoid (cod-like) fish of commercial value (mostly marketed outside the UK as fishmeal and oil), which inhabits the continental slope and shelf in deeper offshore areas, mostly off western and northern Scotland, in the North Sea and off the southern and western coasts of Ireland and the British Isles. It is designated as a Priority Marine Feature in Scotland seas (offshore only). Pelagic spawning is reported to occur in spring mostly along the edge of the continental shelf in areas west of the British Isles and on the Rockall Bank plateau, whereas there is no knowledge of specific habitat requirements for juveniles (Annex 1).
Blue whiting was assessed through modelling based on summer and autumn catches from bottom trawl surveys. Individuals <19 cm in length were considered to identify 0-group juveniles and their aggregations were used as indicator of potential higher value habitats used as nurseries.
As for the other gadoids, depth was the most important predictor of blue whiting juvenile aggregations, this variable recurring at different levels of the decision tree model (Figure 53). Wave and current energy at the seabed (WAV, CUR) were also moderately important predictors, followed by slope, salinity (SSS), water column mixing (MLT), distance from the shore (Dist) and primary production (NPPV). Prediction of juvenile aggregations was always excluded from habitats shallower than 119 m or at depths between 161 and 168 m (Figure 53).
In turn, juvenile aggregations were predicted to always occur with higher probability (>0.8) in deeper habitats (≥168 m) with variable degree of mixing (MLT ≥30.2 m). In these conditions, higher probability of occurrence was predicted either in offshore habitats (Dist ≥132 km) where mean salinity in the summer-autumn is <35, or in habitats within 132 km distance from the shore but with either negligible slope (<0.28 degrees) or, where slope is ≥0.28 degrees, at depth <357 m and with more saline waters (≥35.5).
The model prediction applied to the mean environmental conditions of the period 2010 - 2020 (summer-autumn) allowed mapping of the potential distribution of juvenile aggregations as an indication of potential location of higher value juvenile habitats functioning as nursery for blue whiting (Figure 54).
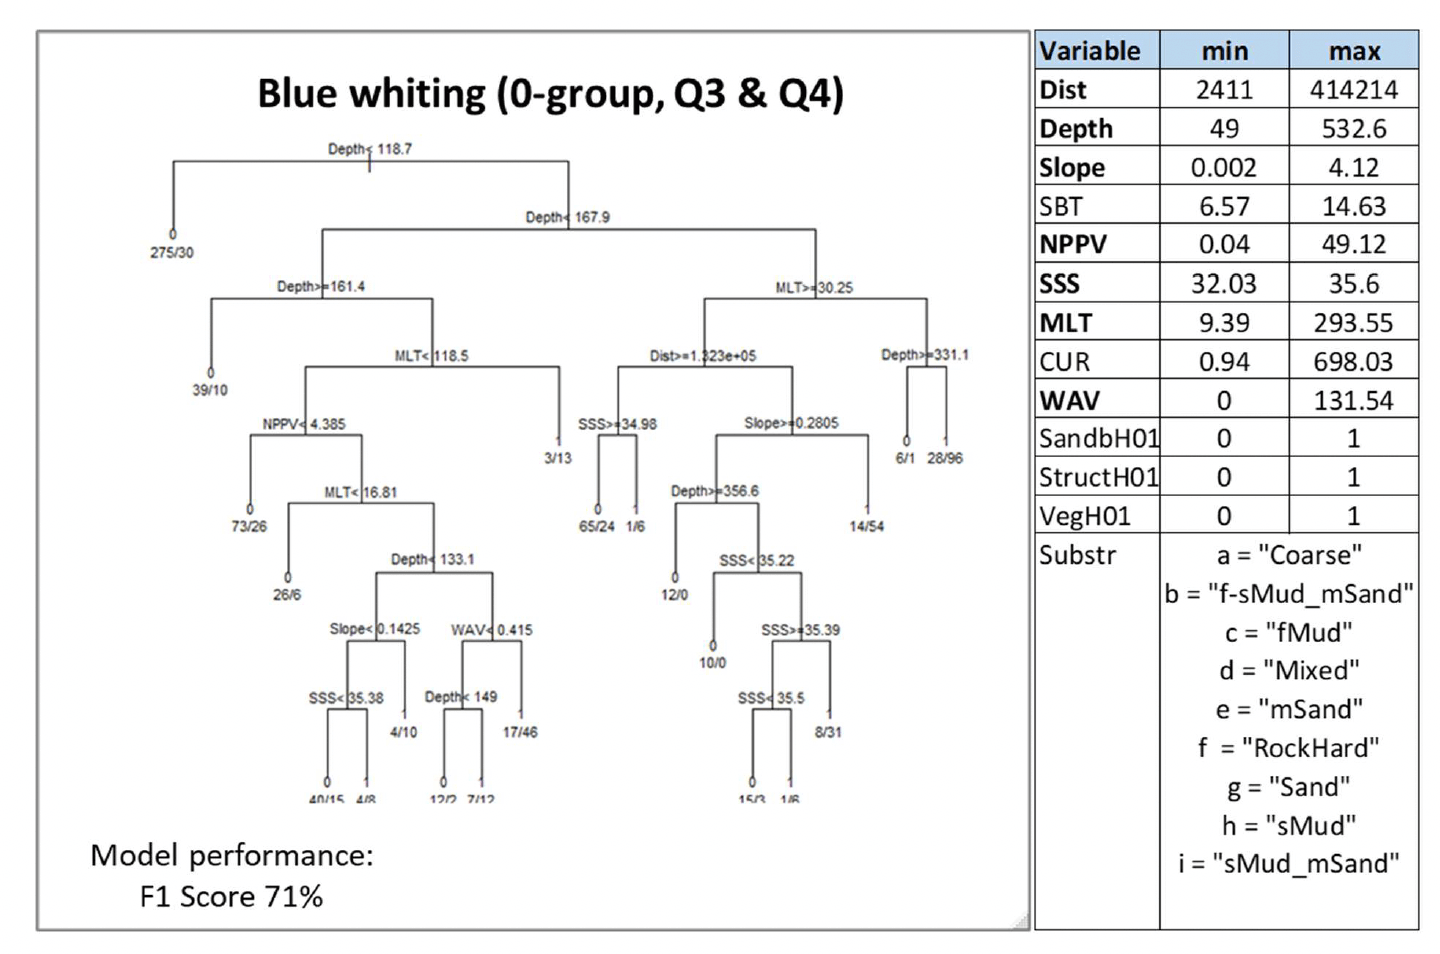
The comparison with the distribution of aggregations in the survey data (Figure 54, and Appendix C, Figure C25) showed a good agreement of the mapped predictions in locating juvenile aggregations mostly along the continental shelf edge west and north of the British Isles, these also overlapping with the known spawning migration routes for blue whiting in the northern Atlantic (Worsøe Clausen et al. 2005). A lower agreement was observed over Rockall (this also being reported as a spawning ground for the species), where aggregations were frequently found over a wider area than the one predicted by the model. Additional survey data from demersal fish surveys along the west coast of Scotland showed juvenile aggregations of blue whiting also occurring in areas further inshore (Appendix C, Figure C26), which instead are poorly covered by the predicted map due to the distribution of the data that were used to calibrate the model (Figure 54).
Stakeholder feedback highlighted that the status of the blue whiting stock in the North Sea (ICES area VI) is such that fishery catches in the area northeast of Shetland are negligible (ICES 2019c). This evidence does not directly pertain to juvenile stages, and survey data showed the presence of juvenile aggregations in this area, albeit sparsely. However, it might indirectly suggest that juvenile aggregations may also be less widely distributed in this area compared to what predicted by the map, and therefore the confidence associated with this spatial prediction could possibly be lower (Figure 54).
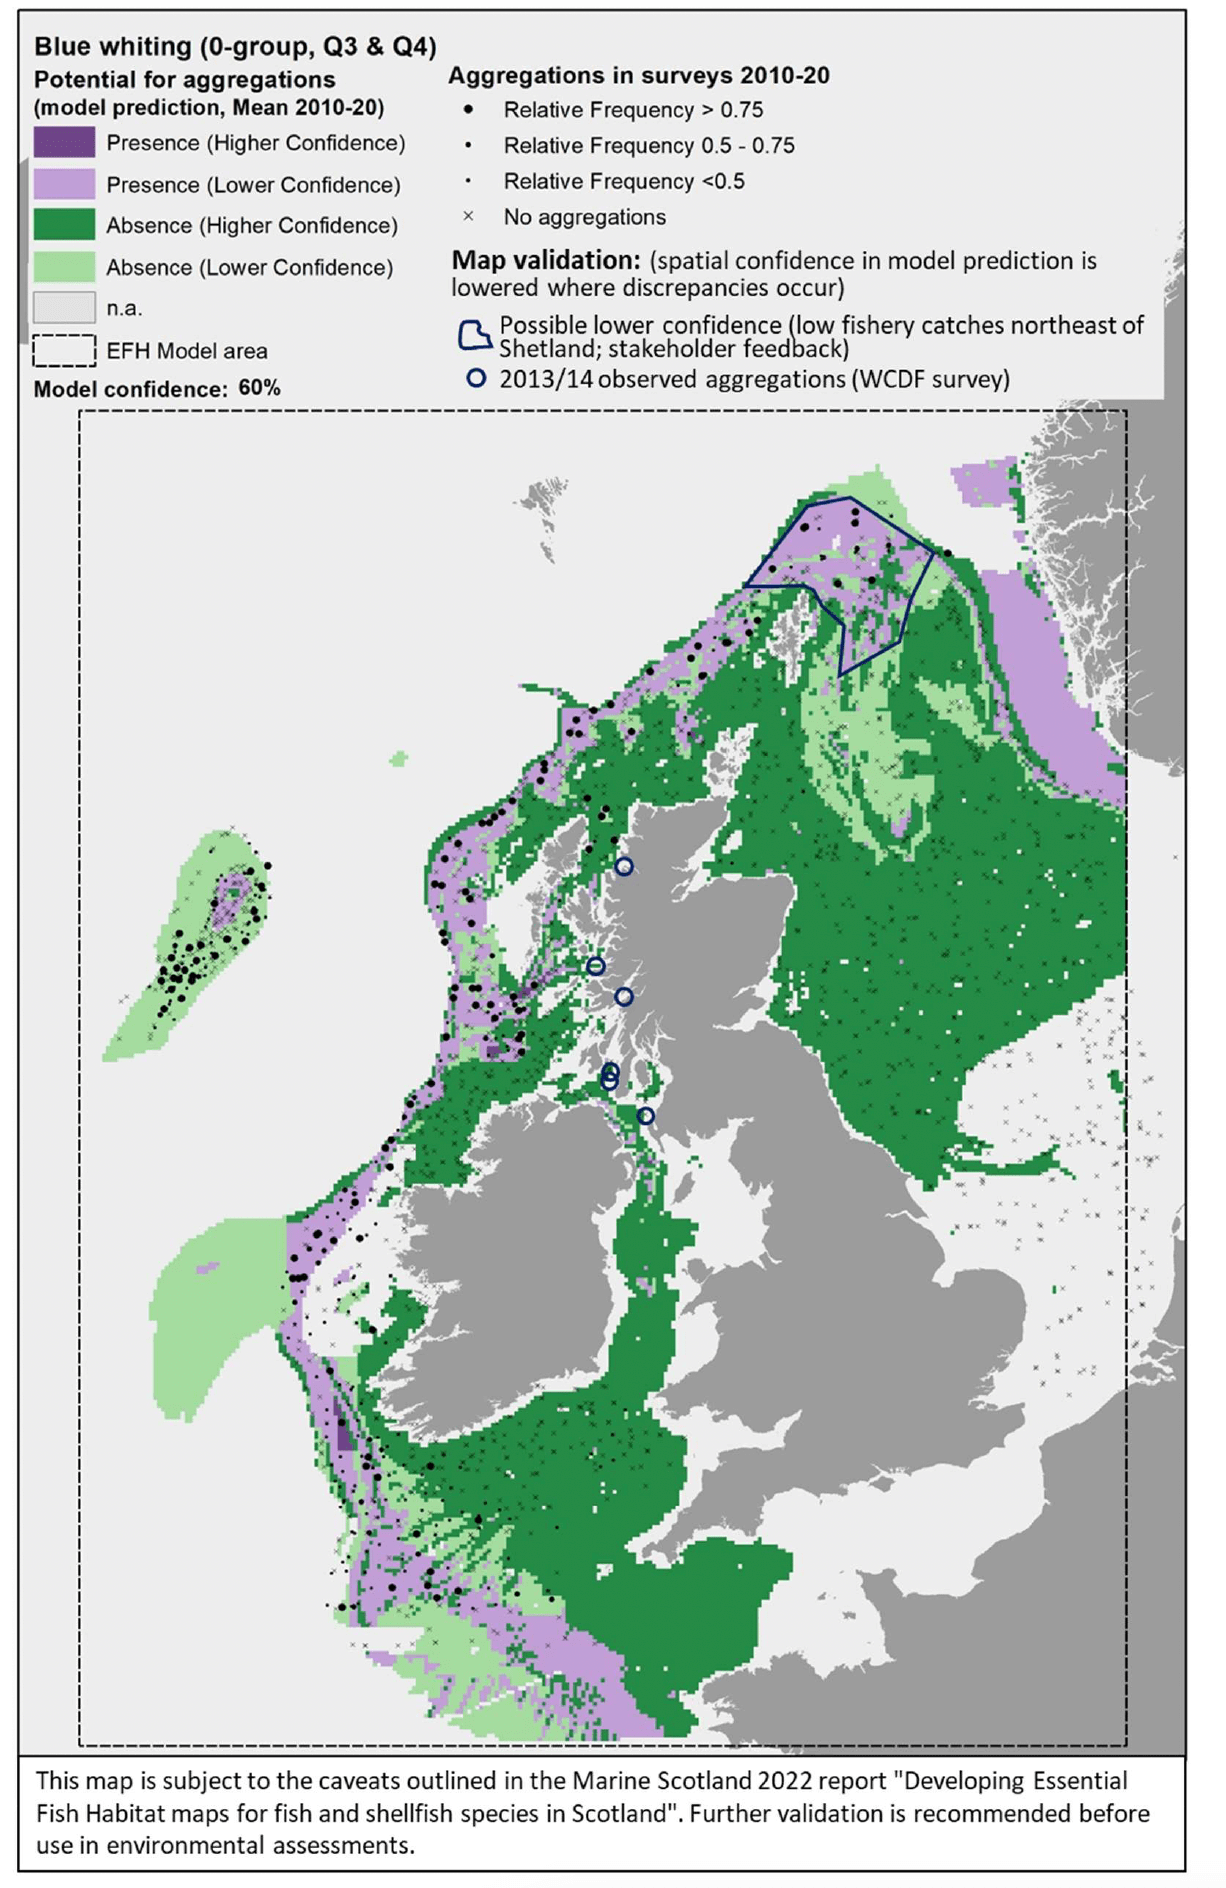
3.1.14 Hake, Merlucciusmerluccius
European hake (Merluccius merluccius, Linnaeus 1758), hereafter referred to as "hake", is a demersal and benthopelagic gadoid (cod-like) fish of commercial value. It is a top predator in the demersal marine community (e.g. feeding on other gadoid fish, clupeids, squids). It inhabits offshore deeper areas in the western English Channel, the southern Irish Sea and off southern Ireland although it has been also recorded off western Scotland and in the North Sea. Hake spawns (winter - spring) in deeper waters along the continental shelf edge, with demersal juveniles usually found on muddy substrata on the continental shelf (Annex 1).
Hake was assessed through modelling based on summer and autumn catches from bottom trawl surveys. Individuals <19 cm in length were considered to identify 0-group juveniles and their aggregations were used as indicator of potential higher value habitats used as nurseries.
Current energy at the seabed (CUR) and depth were the most important predictors identified by the model for hake juvenile aggregations, followed by wave energy at the seabed (WAV), slope and substratum type (Substr), and distance from the shore (Dist), primary production (NPPV), seabed temperature (SBT) and water column mixing (MLT). Juvenile aggregations were predicted to occur at various combinations of these variables Figure 55). Predictions of occurrence were identified with the highest probability either in habitats with predominant muddy sand, sandy mud, fine mud, mixed sediment, or rock or other hard substrata, at depth <250 m, with slope <0.4 degrees, lower primary production (NPPV <3.7 mg C m-3 day-1) and current energy at the seabed ≥26 N m2/s (0.76 probability), or in habitats where the substratum is dominated by a combination of sandy mud-muddy sand, or sand or coarse sediment, at depth >90 m, within 47 km distance from the shore, and where current energy at the seabed is ≥3.4 N m2/s, waters in the summer-autumn are warmer (SBT ≥10.7°C), with lower mixing of the water column (MLT <69 m) and variable primary production (NPPV ≥2.6 mg C m-3 day-1) (0.73 probability).
The model prediction applied to the mean environmental conditions of the period 2010 - 2020 (summer-autumn) allowed mapping of the potential distribution of juvenile aggregations as an indication of potential location of higher value juvenile habitats functioning as nursery for hake (Figure 56).
Comparison with available survey data (both bottom trawl surveys considered for the model calibration and additional inshore and offshore demersal surveys on the west coast of Scotland; Appendix C, Figure C27 and Figure C28) and feedback from the stakeholders have highlighted some limitations of the map (Figure 56).
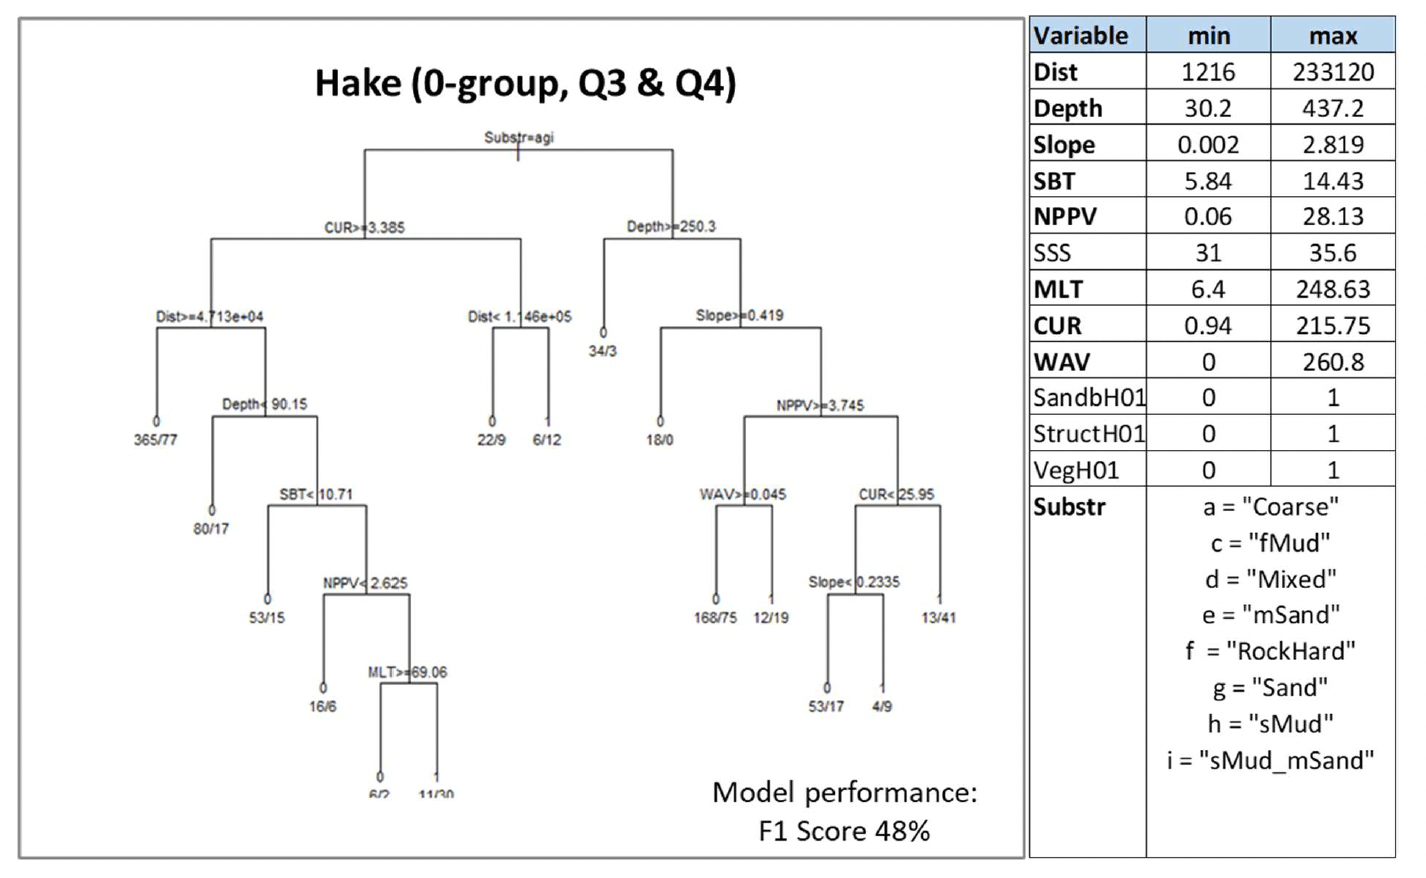
Aggregations in the surveys undertaken along the south coast of Ireland were not correctly predicted in the map. These are notably included in the Hake Box (Appendix C, Figure C29), an area defined as part of the EU's Hake Recovery Plan, where catches of small hake in fisheries are regulated to protect the hake nursery grounds in this area (Figure 56).
Stakeholder feedback also highlighted that hake juveniles occur widely in the Celtic Seas. Although this information does not account for density (which differentiates between aggregations, considered in the model, and mere presence of juvenile), it is possible that juvenile aggregations are also more widespread in this area than what predicted by the model. A lower confidence should therefore be ascribed to the predictions of absence in these areas.
Hake juvenile aggregations found to be frequent in the northern North Sea and on the west coast of Scotland (mainly in the south Minch) also appear to be poorly predicted in the map. The additional survey data from demersal fish surveys (Appendix C, Figure C28) confirmed the presence of aggregations of hake juveniles in this latter area and also in the inner Clyde (these have not been marked in Figure 56).
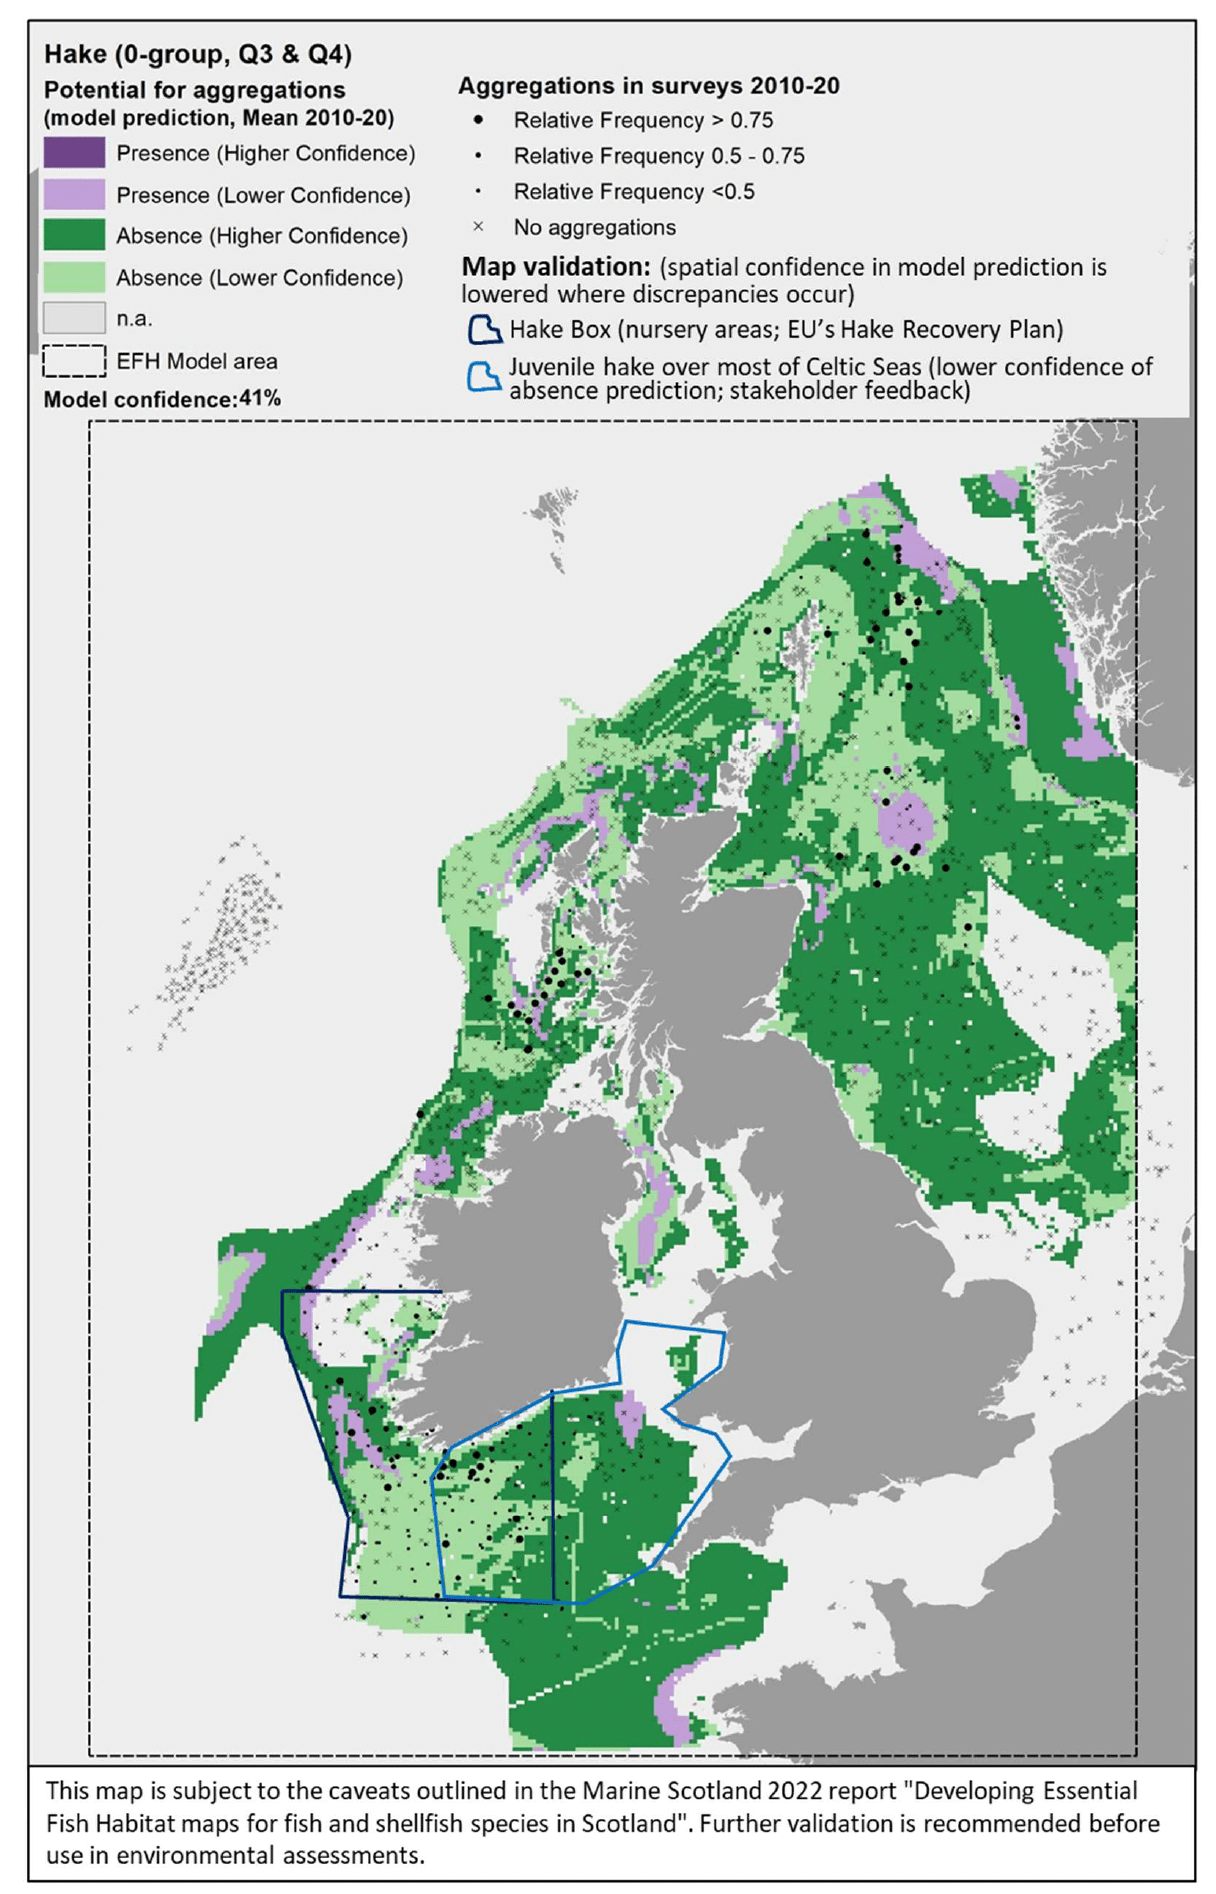
3.1.15 Saithe, Pollachiusvirens
Saithe (Pollachius virens, Linnaeus 1758) is a benthopelagic gadoid (cod-like) fish of high commercial value, which is found throughout British and Irish waters, although it is more common off the north-west coasts of Scotland and Ireland. The species occurs both inshore and offshore. It is designated as a Priority Marine Feature in Scotland's seas. Pelagic winter spawning mostly occurs offshore, although there is limited information on the characteristics of these area in British waters. In turn, nursery areas are mostly located inshore, where saithe juveniles enter in spring and may spend 2 - 3 years before returning to deeper waters offshore (Annex 1).
Saithe were assessed by using the habitat proxy approach to identify inshore habitats that may potentially be used by the juveniles of the species. Twelve publications were reviewed, but the specific information on juvenile habitat associations and environmental preferences was not detailed enough to discriminate suitable habitats at the higher resolution (see Annex 1). Furthermore, no stakeholder feedback was received for this species. As a result, a moderate confidence was associated with the overall assessment of habitat proxies for juvenile saithe.
There were a wide variety of highly suitable habitats identified for saithe juveniles with high confidence. These included rocky environments in the littoral zone often with the presence of fucoids, barnacles and mussels (Table 16). Other high scoring habitats, albeit identified with a lower (moderate) confidence, were rocky habitats in the infralittoral zone, largely those with the presence of kelps and seaweeds. Further possible habitats, scored with medium to low suitability and medium to low confidence (not shown in Table 16), included sandy and muddy substrate in the infra- circa- and sublittoral zones, as well as maerl beds and water column habitats.
The distribution of the inshore habitat proxies for saithe juveniles in the case study area is mapped in Figure 57, compared with the overall distribution of juveniles from the West Coast of Scotland Demersal Fish Survey (WCDF, 2013/14) in the area. Habitats with the highest potential suitability for saithe juveniles were identified mainly to the south of the case study area (littoral rocky fringes along the Scottish coastline in the northern Irish Sea), where no survey data were available for validation. Where survey data overlapped with the habitat proxy map, a general match could be observed between potentially suitable areas in the map and locations where saithe juveniles were found with higher abundance closer to the shore (e.g. in the Clyde, north of Islay, west of Mull). Aggregations of juveniles were also occasionally found in deeper habitats farther from the shore. Although these habitats were not assessed in the map, potentially suitable habitats were identified nearby, which are likely to be used by these juvenile fish, considering their mobility. No stakeholder feedback was received on this map following consultation.
Table 16. Main (highest scoring) habitats potentially associated with nursery function for saithe juveniles (Pollachius virens). Habitat suitability score varies from 1 (Low) to 3 (High), with confidence in the scoring assessed as Low (L), Medium (M) or High (H). Habitat codes and names are as per EUNIS Habitat classification.
| Saithe (juvenile)– Habitat proxies for nursery function (Low confidence overall) |
|---|
| EUNIS Habitat type (score /confidence) |
| A1.1 Highenergylittoralrock(3/H) A1.12 Robust fucoid and/or red seaweed communities (3/H) A1.15 Fucoids in tide-swept conditions (3/H) A1.2 Moderateenergylittoralrock(3/H) A1.21Barnacles&fucoidsonmoderatelyexposedshores(3/H) A1.22 Mussels & fucoids on moderately exposed shores (3/H) A1.3 Lowenergylittoralrock(3/H) A1.31 Fucoids on sheltered marine shores (3/H) A3.1 Atlantic and Mediterranean high energy infralittoral rock (3/M) A3.11 Kelp with cushion fauna and/or foliose red seaweeds (3/M) A3.14 Encrusting algal communities (3/M) A3.2 Atlantic and Mediterranean moderate energy infralittoral rock (3/M) A3.21 Kelp & red seaweeds (moderate energy infralittoral rock) (3/M) A3.22 Kelp & seaweed communities in tide-swept sheltered conditions (3/M) |
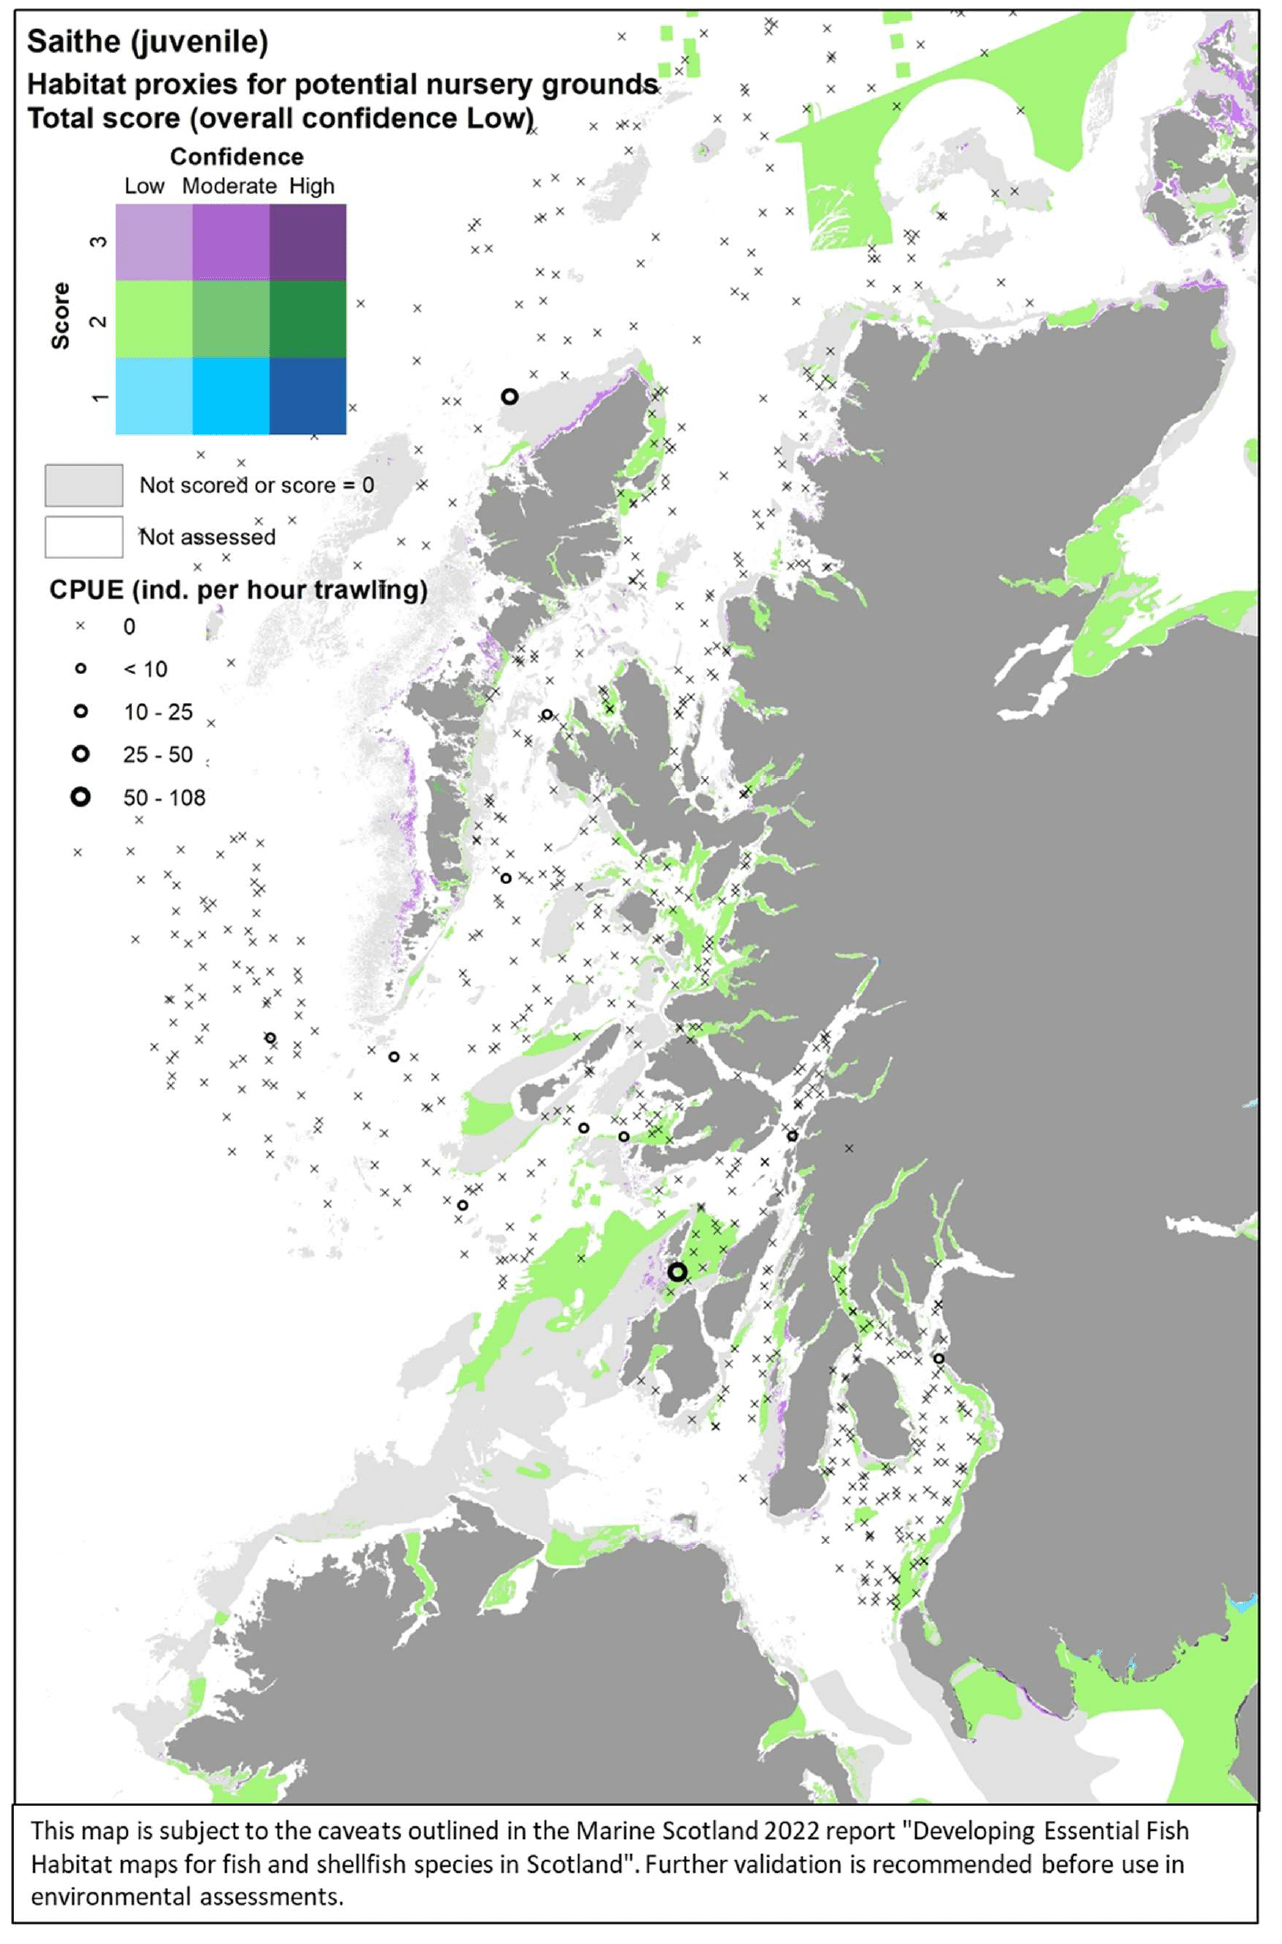
3.1.16 Sprat, Sprattussprattus
Sprat (Sprattus sprattus, Linnaeus 1758) are a small pelagic schooling fish found all around the coasts of Britain and Ireland and is exploited commercially. It is usually found in inshore waters, also entering estuaries to areas of low salinity. Spawning generally occur farther from the shore, with hydrography playing a key role in eggs and larval distribution and survival. Nursery grounds are known to occur in shallow inshore waters (e.g. Severn Estuary) (Annex 1).
Sprat was assessed by using both the data-based model and the habitat proxy approach. The farther allowed to model the distribution of aggregations of juveniles in summer-autumn as indicators of potential important habitats used as nursery. Individuals of body length < 9 cm and 9.5 cm were considered to identify 0-group sprat in summer and autumn catches from bottom trawl surveys, respectively. The habitat proxy approach also allowed identification of habitats that may potentially be used by the juveniles of the species, with better coverage of inshore coastal areas.
Almost all variables accounting for geomorphological, energy and water quality characteristics (except for NPPV) were selected by the model as predictors (Figure 58). Water depth, salinity (SSS), water column mixing (MLT), temperature (SST) and wave energy at the seabed were the most important predictors of sprat juvenile aggregations. Despite sprat being a pelagic species, substratum type was also identified as model predictor, although this had lower importance compared to the variables mentioned above. This does not necessarily imply a cause-effect relationship with aggregation distribution. The inclusion of substratum type as predictor could be ascribed to its correlation to another variable (not accounted for by the model) which has a more direct causative effect on the distribution of sprat juvenile aggregations.
Juvenile aggregations were predicted to occur at various combinations of these variables (Figure 58). Aggregations were predicted with higher probability (>0.85) in shallower habitats (Depth <26.4 m) with moderate-low mixing of the water column (MLT <40.8 m) and salinity <34.8, either in warmer waters (SST ≥17.3°C) (0.87 probability), or, in cooler conditions (<17.3°C), on fine mud, sandy mud, muddy sand or sand seabed with low wave energy (<19.6 N m2/s) (0.89 probability).
The model prediction applied to the mean environmental conditions of the period 2010 - 2020 (summer - autumn) allowed mapping of the potential distribution of juvenile aggregations as an indication of potential location of higher value juvenile habitats functioning as nursery for sprat (Figure 59).
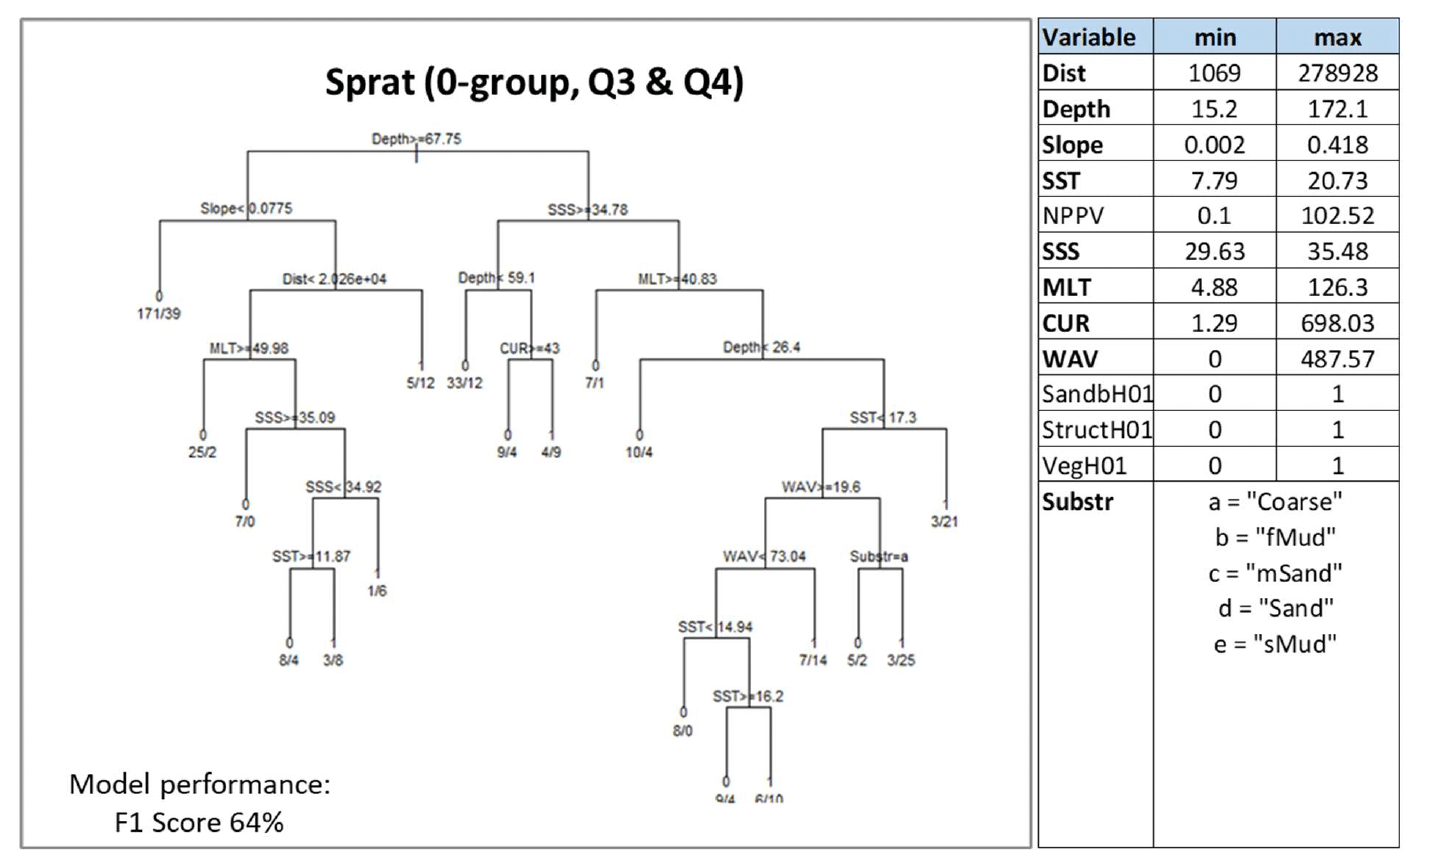
The predicted map confirms the predominant presence of aggregations of juvenile sprat in inshore coastal areas around the UK, with particularly higher confidence in the Clyde and Forth, confirming survey data, as well in the Moray Firth area (Figure 59). The importance of the latter two areas (Firth of Forth and Moray Firth) for sprat is also confirmed by seasonal management measures (fishery closure) that are in place there to protect juvenile sprat and herring (European Council Regulation No 850/98 of 30 March 1998). Habitats potentially suitable for juvenile aggregations of sprat are also predicted in more offshore waters in the northern North Sea, north and west of Scotland, despite not being supported by survey observations, although a low confidence is associated with these predictions of presence.
This mismatch has likely contributed to the moderate confidence (51%) associated with the model predictions overall, in addition to the lower efficiency of bottom trawl surveys in sampling pelagic juvenile sprat.
The model seems to fail to correctly predict the occurrence of juvenile aggregations particularly in southern inshore areas, as indicated by survey data (south-west coast of Ireland) and by stakeholder feedback (e.g. Thames, English Channel, Bristol Channel, Severn estuary) (Figure 59). This is also influenced by the poor coverage of most inshore areas by the predicted map, which reflects the distribution of the data that have been used to calibrate the model (see results of the habitat proxy approach below for a better assessment of more inshore habitats). Such limitation is also apparent when comparing the model prediction with additional survey data from demersal fish surveys on the west coast of Scotland (Appendix C, Figure C32). Although several of the locations of juvenile aggregations found during this survey are confirmed by the model predictions of presence (albeit at lower confidence), additional aggregations were found in some areas located further inshore waters, where there is poor coverage by the model (Figure 59).
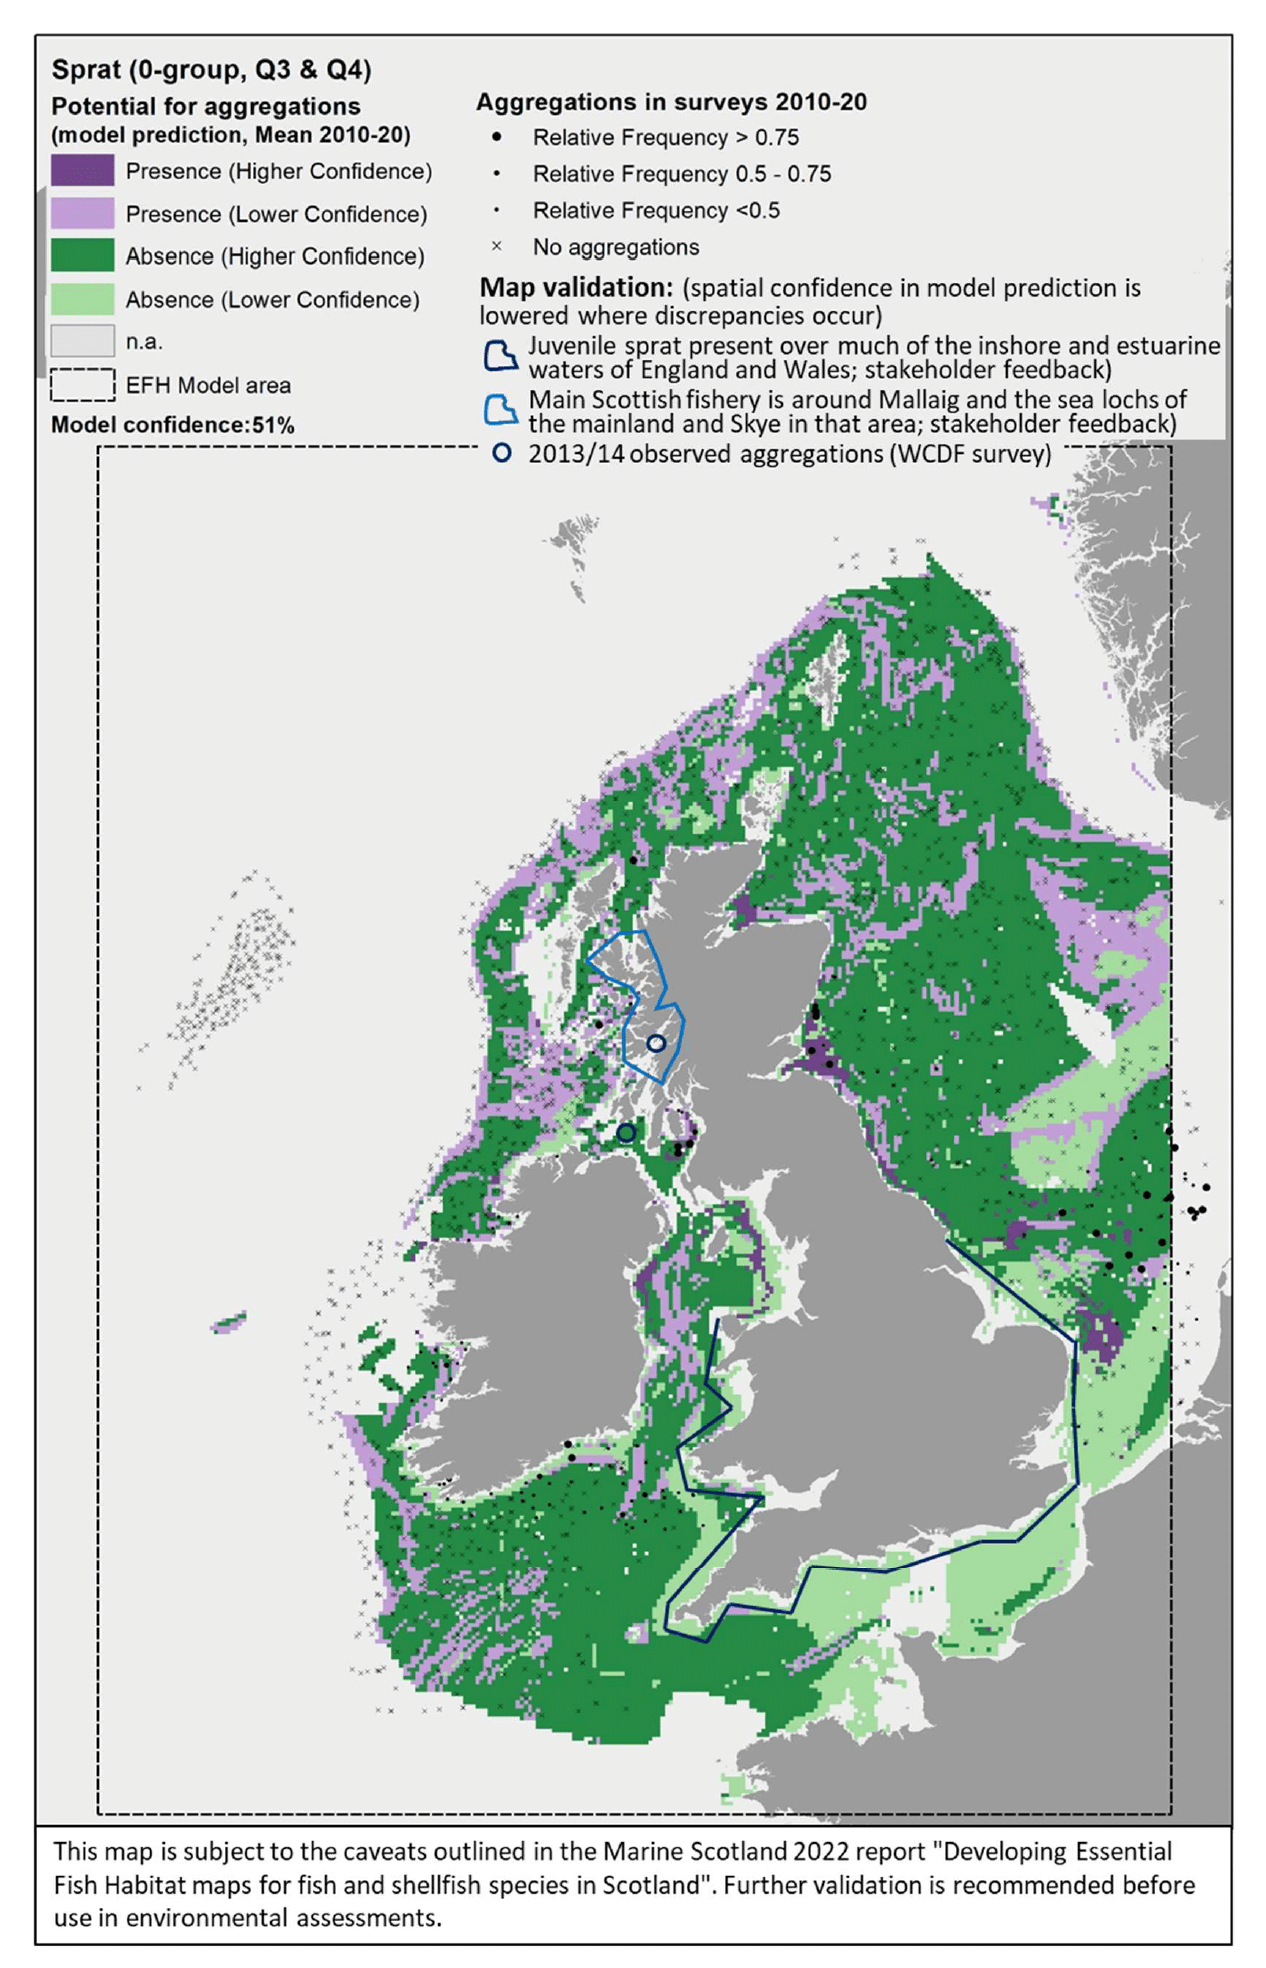
For the assessment of habitat proxies for sprat juveniles inshore, nine publications were reviewed. The specific information on juvenile habitat associations and environmental preferences was scarce and not detailed enough to discriminate suitable habitats at the higher resolution (see Annex 1). This, along with expert input obtained with the stakeholder validation, led to a moderate confidence in the overall assessment of habitat proxies for juvenile sprat.
The habitat proxy assessment indicated full salinity water column habitats as the most suitable habitats potentially functioning as nursery for this small pelagic fish, with a high confidence associated (Table 17). Other possible habitats, though scored with medium to low suitability and medium to low confidence (not shown in Table 17) were relatively wide- ranging benthic habitats, including saltmarshes, seagrass beds, sublittoral sediments and littoral sediments.
The distribution of the inshore habitat proxies for sprat juveniles in the case study area is mapped in Figure 60, compared with the overall distribution of juveniles from bottom trawl surveys in the area (including IBTS undertaken between 2010 and 2020, and the WCDF 2013/14 survey). Both the habitat map and the survey data confirm that sprat juveniles aggregate in the Firth of Clyde, suggesting this site as nursery area for the species. Juvenile aggregations are also found on suitable habitats close to the shore along the west coast (Inner Hebrides), with more frequent observations northwest of Coll and northeast of Lewis, where potentially suitable habitats were identified. No stakeholder feedback was received on this map following consultation.
| Sprat (juvenile)– Habitat proxies for nursery function (Moderate confidenceoverall) |
|---|
| EUNIS Habitat type (score /confidence) |
| A7.3 Completelymixedwatercolumnwithfullsalinity(3/H) A7.33Completelymixedwatercolumnwithfullsalinity&longresidencetime(3/H) A7.8 Unstratifiedwatercolumnwithfullsalinity(3/H) A7.81 Euphotic (epipelagic) zone in unstratified full salinity water (3/H) |
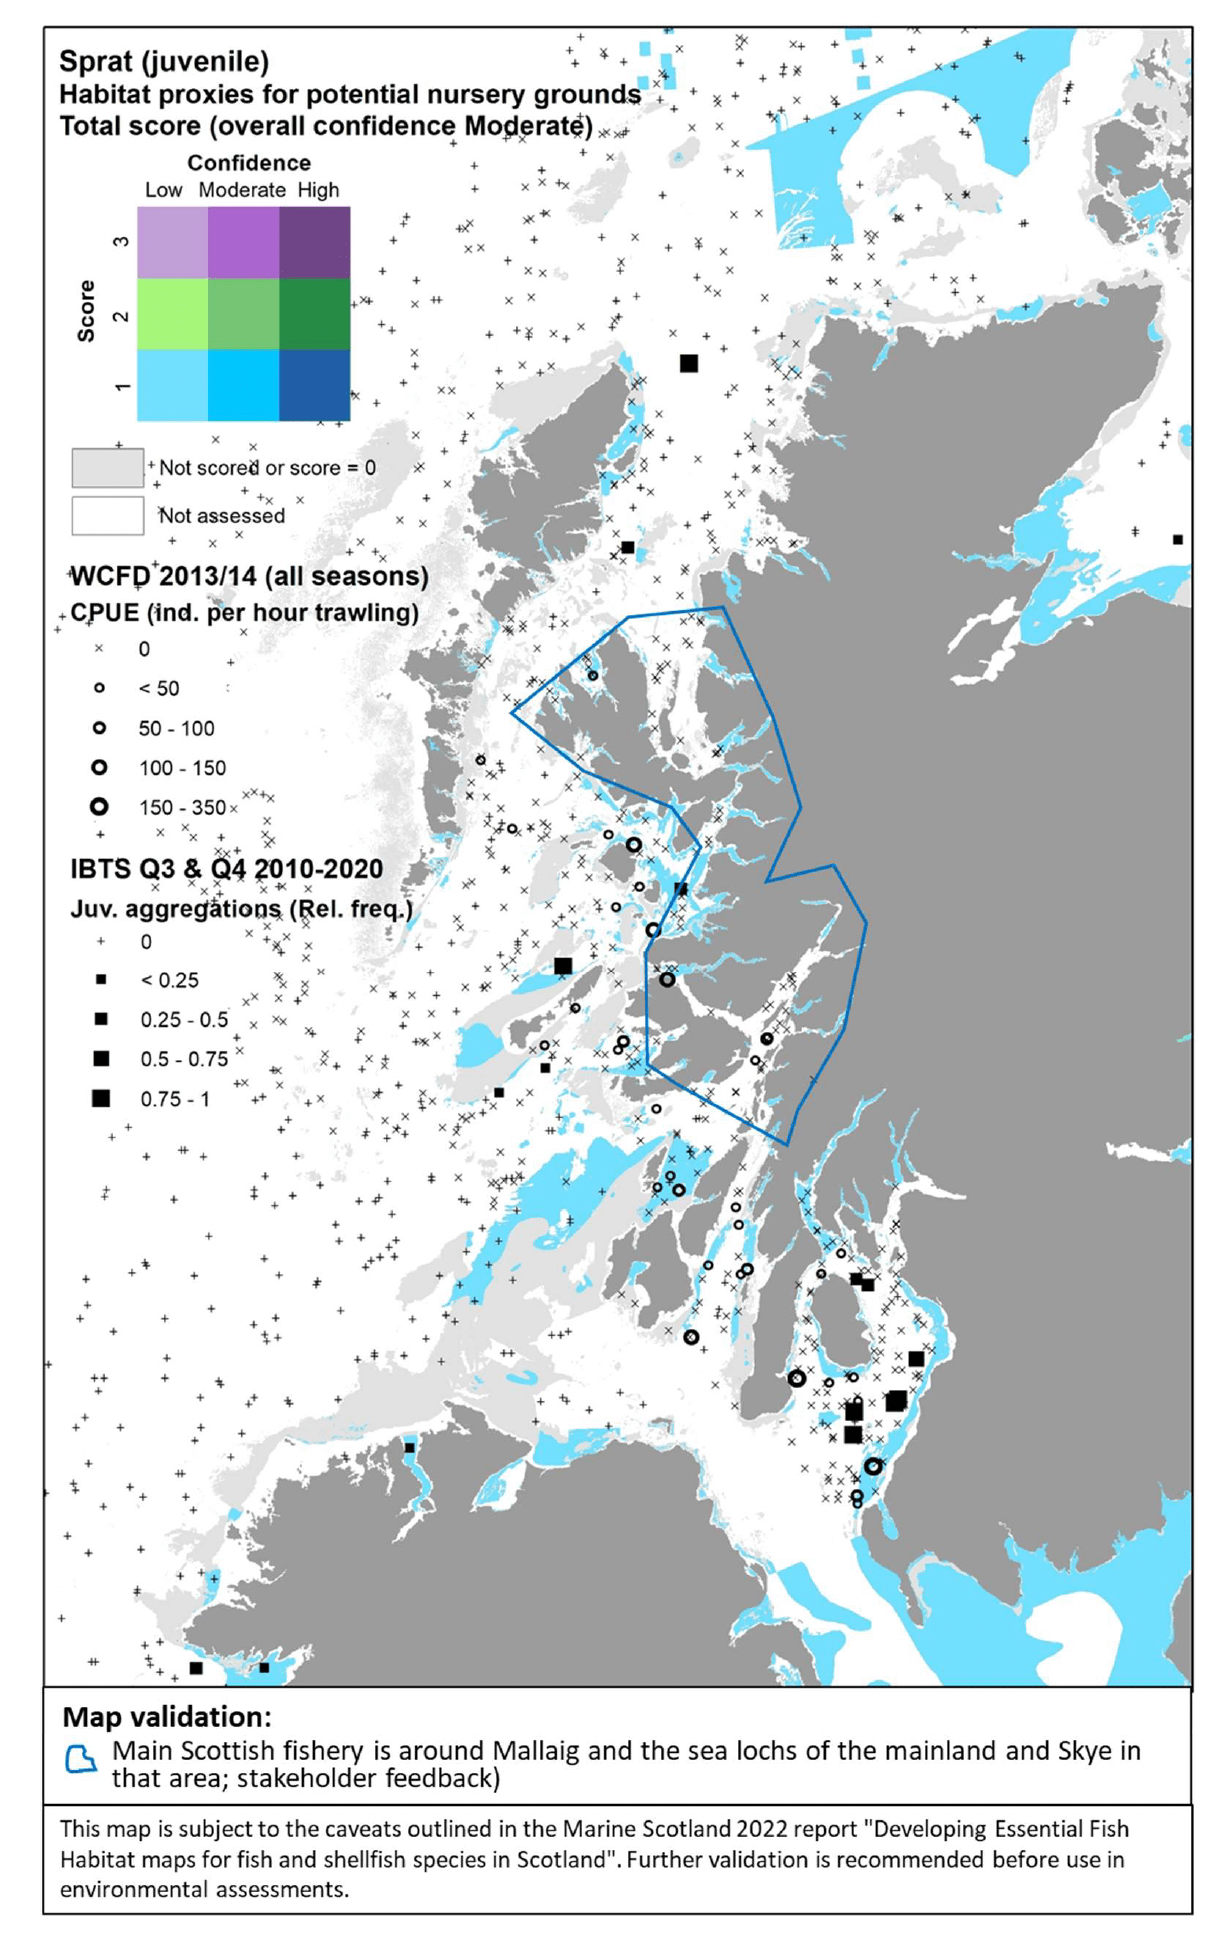
3.1.17 Mackerel, Scomberscombrus
Atlantic mackerel (Scomber scombrus Linnaeus 1758), hereafter referred to as "mackerel",) is a pelagic shoaling species widely distributed in the continental shelf seas around the British Isles and Ireland. It is notably the highest value species landed in Scotland. Mackerel is a highly mobile top predator that makes extensive migrations, its distribution being mainly affected by a variety of hydrographical features and prey distribution. Pelagic spawning occurs mainly in the spring-summer (North Sea) and in the spring (west coast, Atlantic) offshore, while juveniles also occupying shallower inshore areas (Annex 1).
Mackerel was assessed by using the data-based model approach. Autumn-winter bottom trawl survey data were used to model aggregations of juveniles as an indicator of potential higher value habitats used as nurseries. Individuals of body length <22 and 24 cm were considered to identify 0-group mackerel in autumn and winter, respectively. Spring-summer catches from mackerel egg surveys were also used to model aggregations of early-stage eggs as an indicator of potential spawning areas.
Juveniles
All variables accounting for geomorphological, energy and water quality characteristics were selected as predictors by the model for mackerel juvenile aggregations (Figure 61). Water column mixing (MLT), current and wave energy at the seabed (CUR, WAV), depth, distance from the shore (Dist) and water temperature (SST) were the most important predictors.
Substratum type was also identified as a model predictor of this pelagic species, albeit with the lowest importance. As observed for sprat, substratum type could have been included as predictor due to its correlation to another variable (not accounted for by the model) which has a more direct causative effect on the distribution of mackerel juvenile aggregations.
Areas where mackerel juvenile aggregations were predicted to occur had generally very low current energy (<20.1 N m2/s) and some degree of wave energy at the seabed (≥0.07 N m2/s), as well as higher mean salinity (≥34.9). Under these conditions, juvenile aggregations were predicted to occur with the highest probability (0.79-0.8) in areas with some mixing of the water column (MLT ≥50.4 m) either located farther offshore (Dist ≥268 km), or, if within 268 km from the shore, on fine mud or sand substrata shallower than 139 m, with negligible slope (<0.02 degrees) and mean autumn-winter water temperature between 6.4 and 7°C.
The model prediction applied to the mean environmental conditions of the period 2010 - 2020 (autumn - winter) allowed mapping of the potential distribution of juvenile aggregations as an indication of potential location of higher value juvenile habitats functioning as nursery for mackerel (Figure 62).
Comparison with available survey data (both bottom trawl surveys considered for the model calibration and additional inshore and offshore demersal surveys on the west coast of Scotland; Appendix C, Figure C34 and Figure C35) and feedback from the stakeholders have highlighted some limitations of the map (Figure 62).
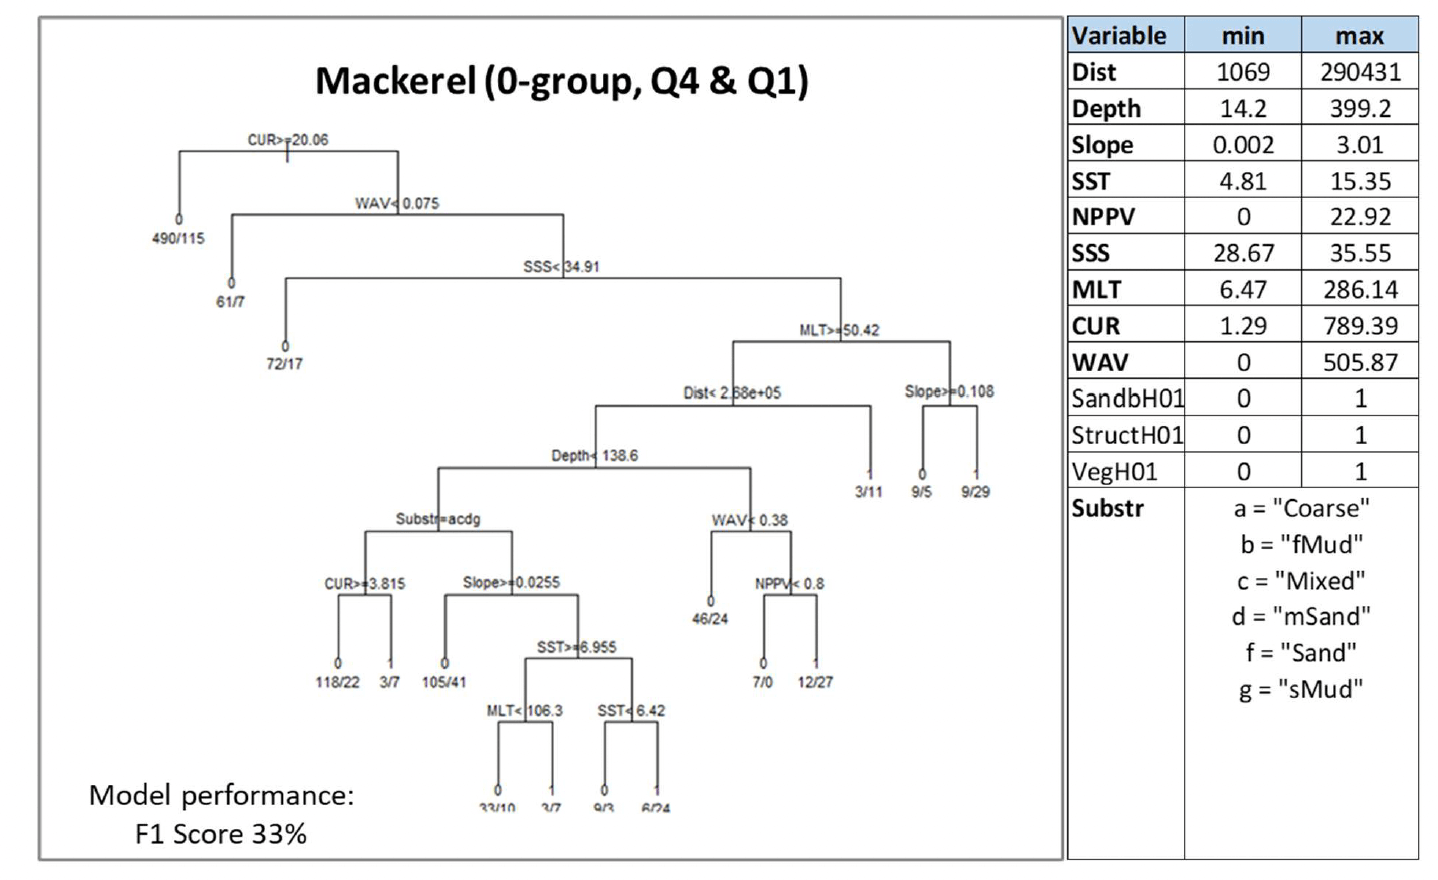
While the model predictions confirmed observed juvenile aggregations occurring off the west coast of Scotland and along the continental shelf edge north of Scotland, predictions were less accurate in the norther North Sea and in the Celtic Seas. The latter notably include the South West Mackerel Box (Appendix C, Figure C29), a fishery management area that was introduced in 1986 by Council Regulation (EEC) No. 3094/86 in order to protect juvenile mackerel in this area, thus suggesting that juvenile aggregations are possibly more widespread in this area than what predicted by the model. A lower confidence should therefore be ascribed to the predictions of absence in these areas (see orange boxed area in Figure 62).
The additional survey data from demersal fish surveys confirmed the presence of aggregations of mackerel juveniles in areas off the west of Scotland as predicted by the map and/or already indicated by the survey data shown in the map (Figure 62).
It should be noted that the overall confidence associated with the model predictions is low (26%), due to a poor model performance (Figure 61) combined with the lower efficiency of bottom trawl surveys in sampling pelagic juvenile mackerel.
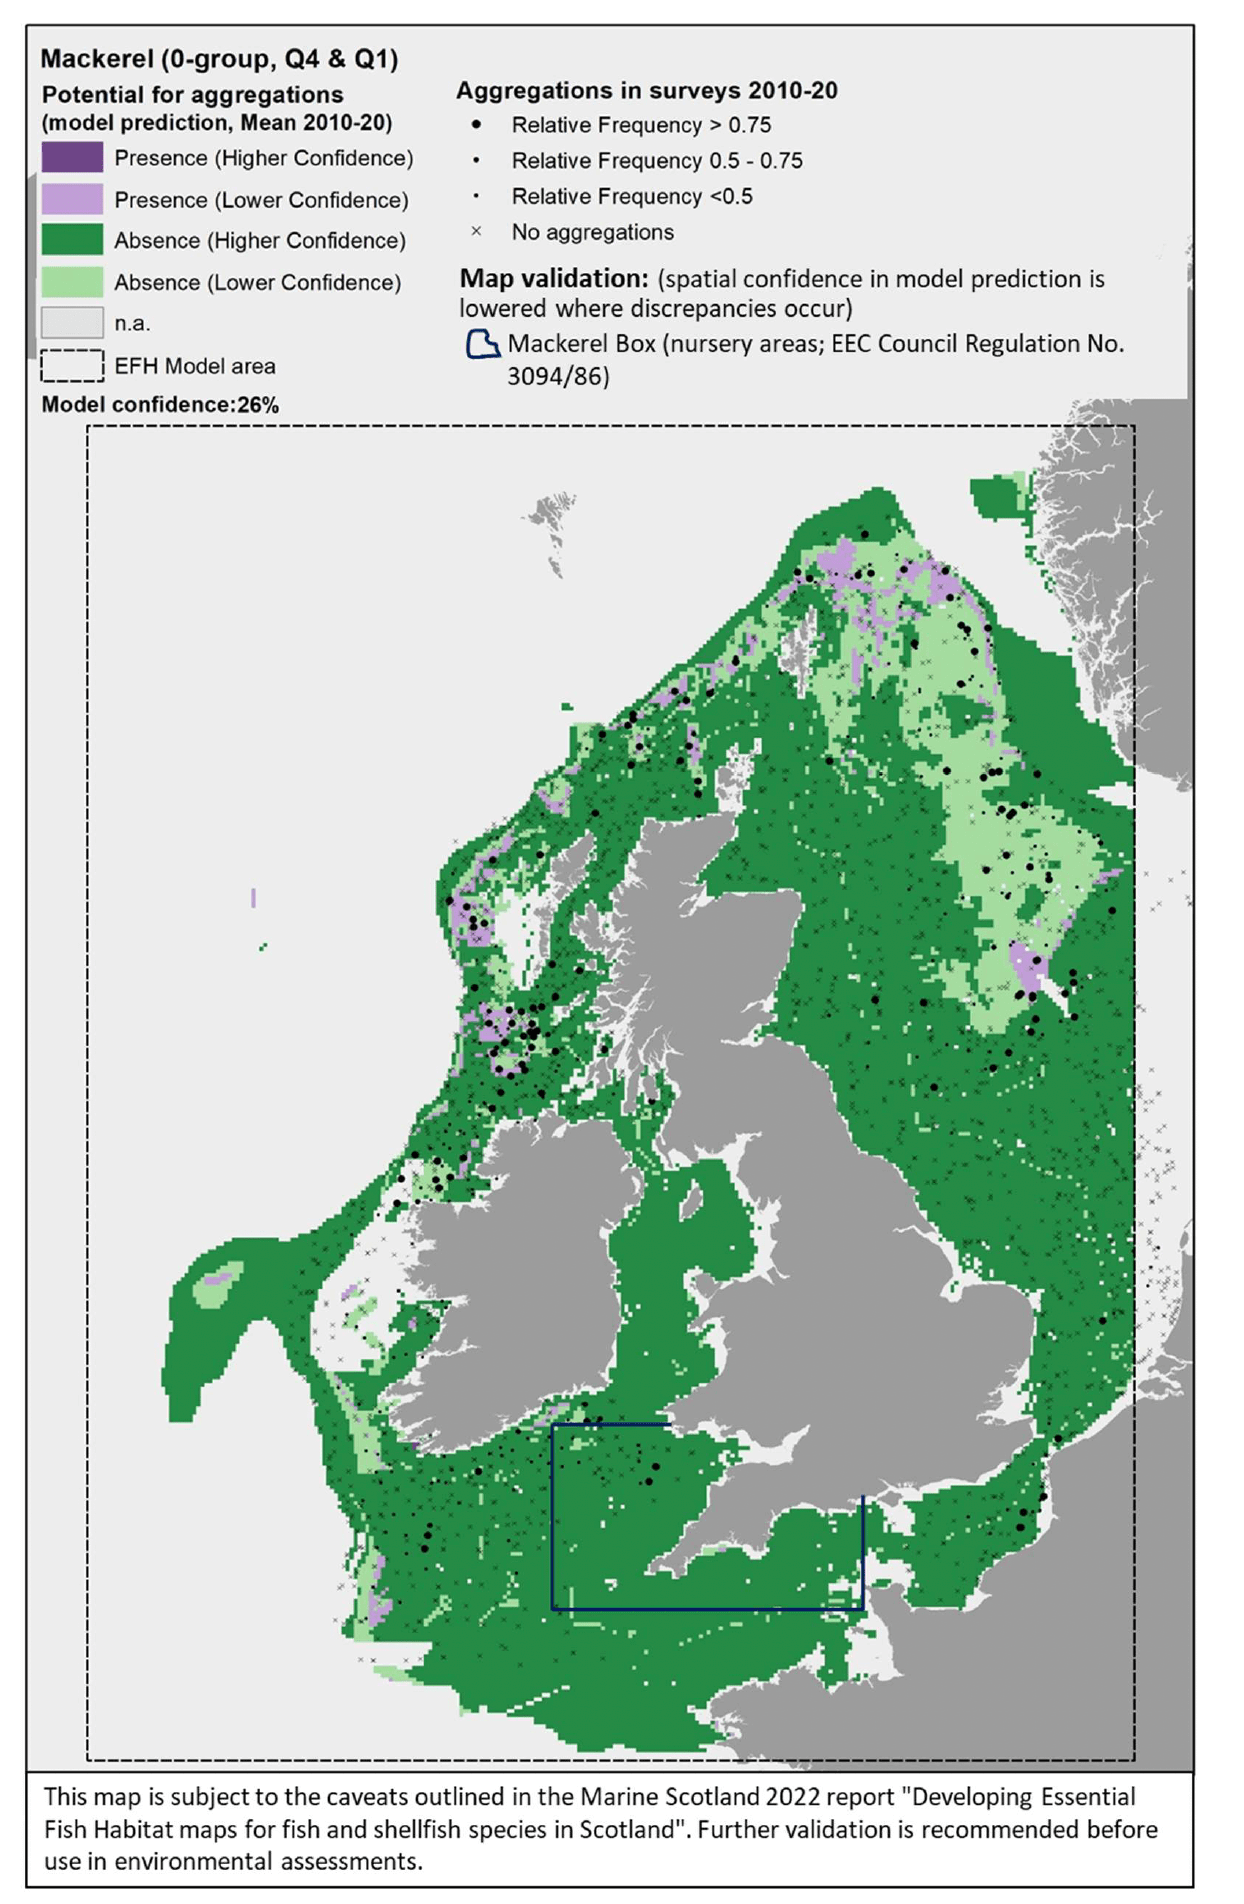
Eggs
As for mackerel egg aggregations, depth and wave energy at the seabed (WAV) were the most important predictors identified in the model, followed by distance from the shore (Dist), salinity (SSS), substratum type (Substr) and primary production (NPPV). Egg aggregations were only predicted (with 0.64 probability) in areas at depth <378 m, within 113 km distance from the shore, with negligible wave energy (<0.6 N m2/s) on muddy sand, sand, coarse sediment, or rock or other hard substrata, higher salinity (≥35.2) and primary production (≥2.8 mg C m-3 day-1) (Figure 63).
The model prediction applied to the mean environmental conditions of the period 2010 - 2020 (spring-summer) allowed mapping of the potential distribution of mackerel egg aggregations as an indication of potential location of higher value spawning habitats (Figure 64).
Despite the survey data on which the model was calibrated did not show clear spatial patterns in the egg distributions (Figure 64, and Appendix C, Figure C36), the model predicted suitable environmental conditions for the occurrence of egg aggregations mostly along continental shelf edge to the west and north of the British Isles. This mismatch contributed to the overall low confidence (32%) associated with the model and the low confidence of the spatial predictions of presence of mackerel egg aggregations (Figure 64). Despite this, the mapped prediction of egg aggregations (and potential associated spawning grounds) appeared to be in line with the knowledge available to stakeholders.
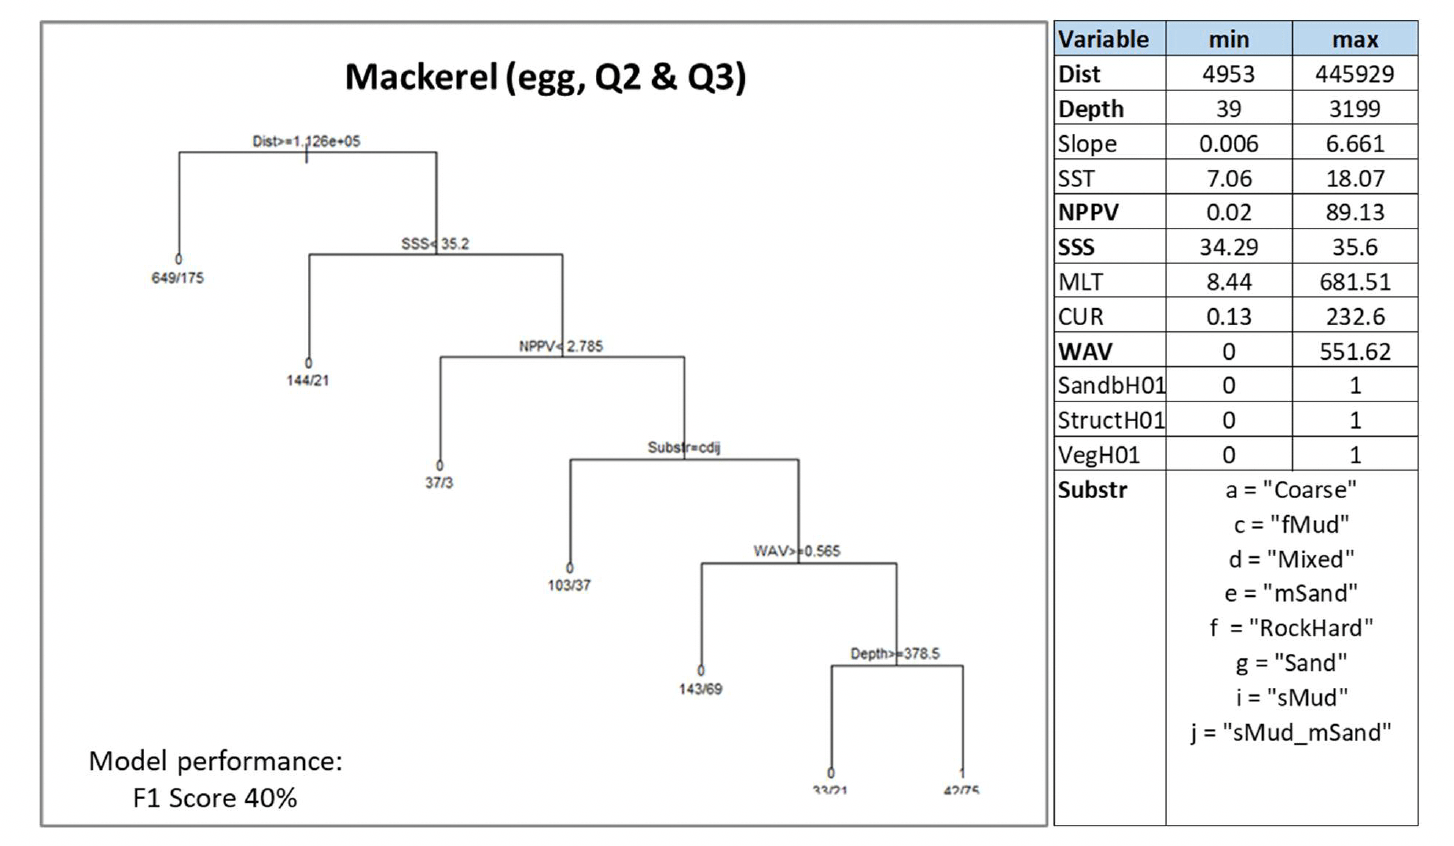
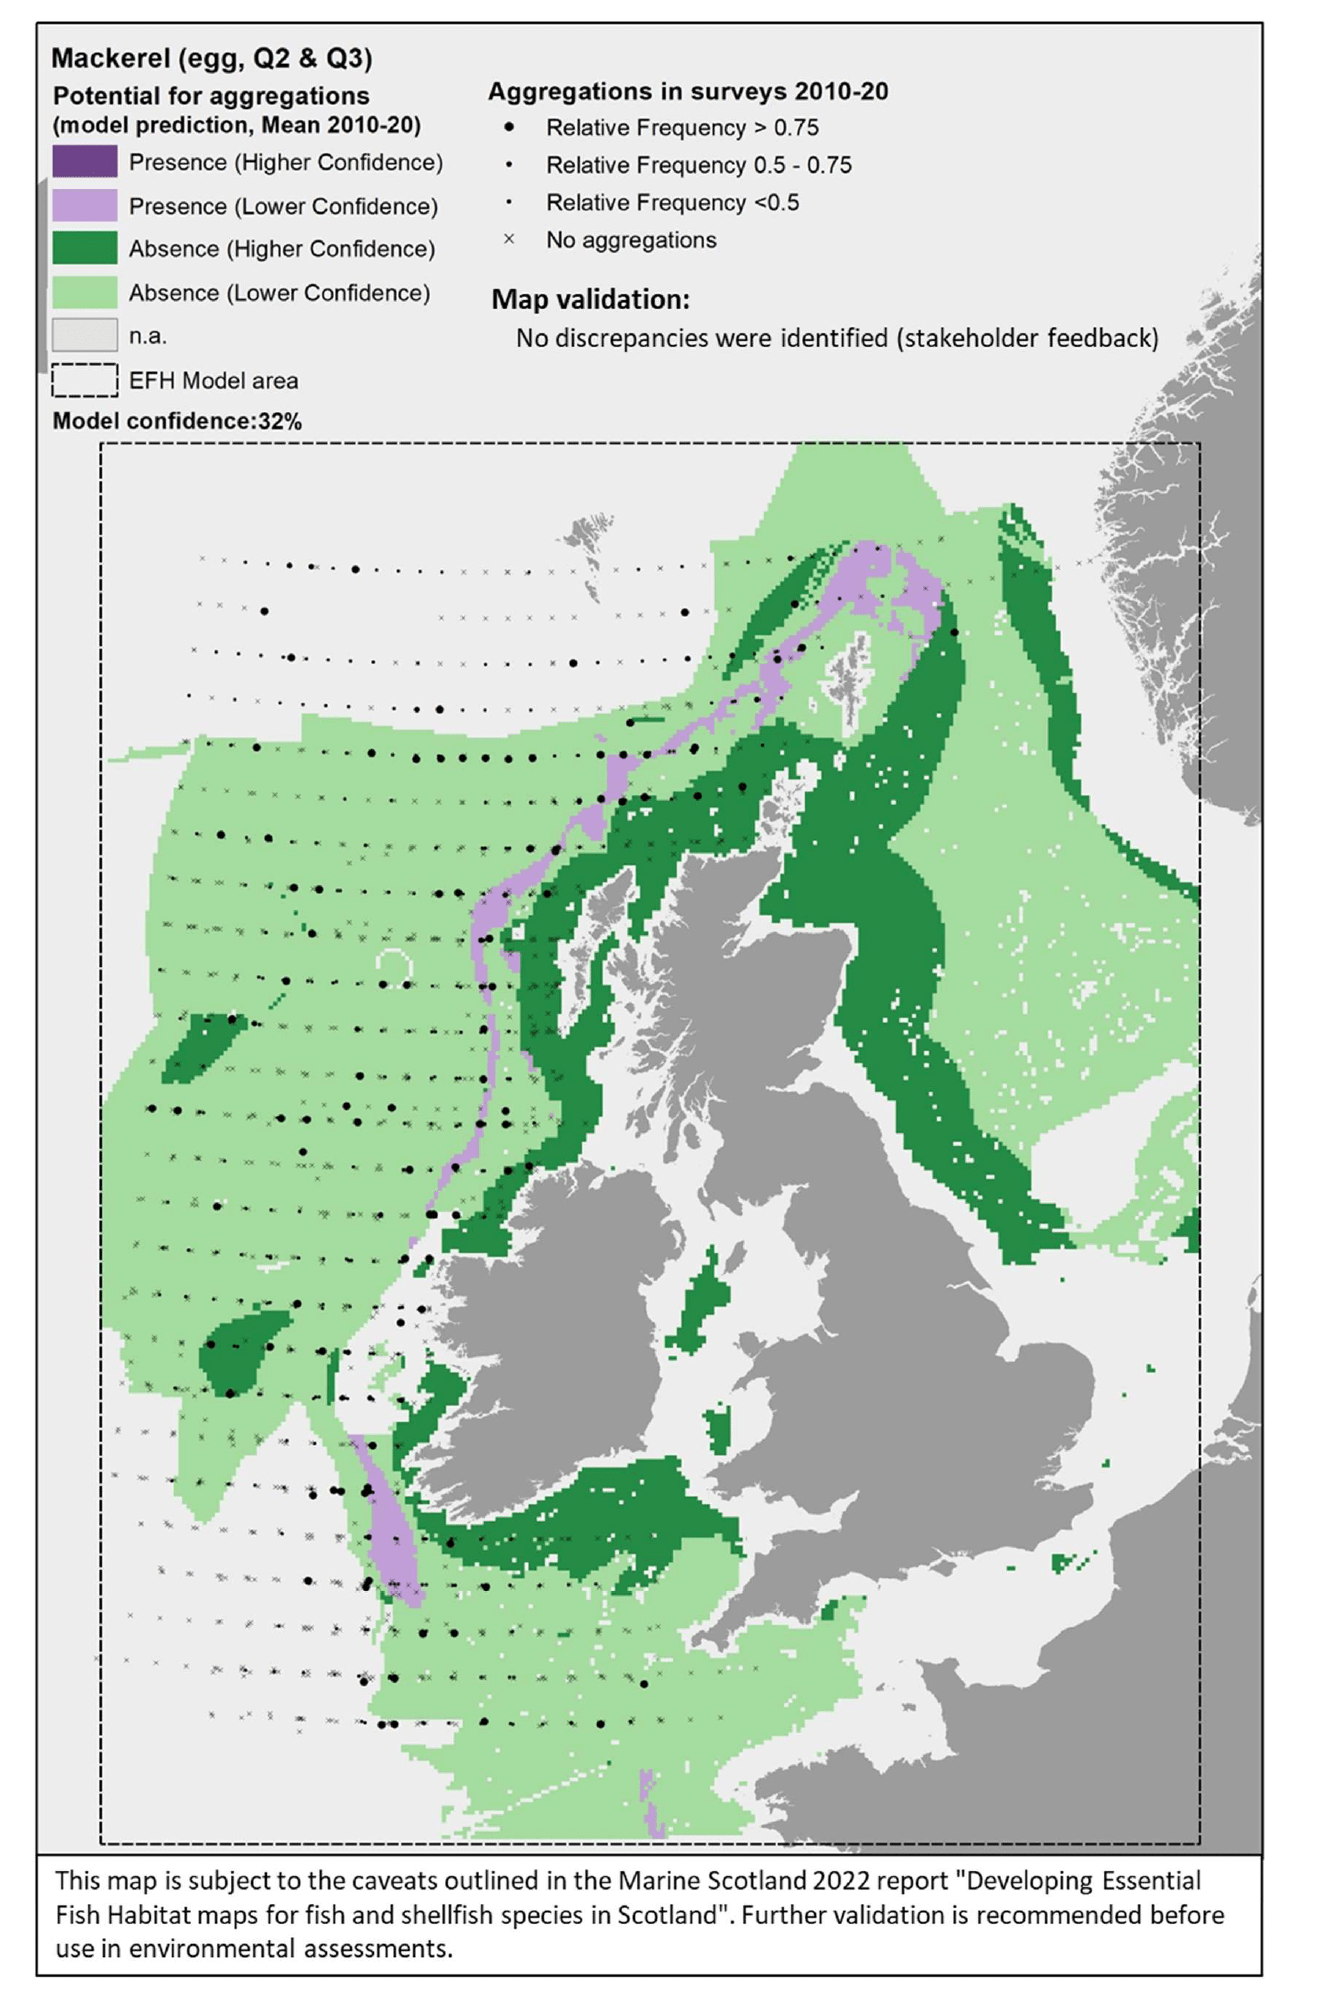
3.1.18 Thornback ray, Rajaclavata
Thornback ray (Raja clavata Linnaeus 1758) is an elasmobranch fish (skate) widespread around the British Isles. It inhabits shelf and upper slope waters (down to 190 m depth), and is most common in inshore coastal waters, also occasionally occurring in estuaries. An oviparous fish with internal fertilisation, it anchors demersal egg capsules on shallow sediments inshore, and juvenile nursery grounds are thought to overlap with these spawning/egg-laying grounds (also referred to as 'egg nursery'), although little evidence is available about specific locations of these habitats (Annex 1).
Thornback ray were assessed by using the habitat proxy approach to identify inshore habitats that may potentially be used by the species for the laying of eggs (egg-nurseries, potentially overlapping with juvenile nursery grounds). Fourteen publications were reviewed but these showed that there is little knowledge of specific environmental preferences associated with egg-nurseries (see Annex 1). Furthermore, no feedback was received from stakeholders. As such, a low confidence was associated with the overall assessment of habitat proxies for egg-nursery grounds of thornback ray.
Habitats high scoring for suitability could not be identified and, at best, habitats with moderate suitability (score 2) were identified, but with low confidence. These were sublittoral and infralittoral coarse sediments, sublittoral sand, infralittoral fine sand and infralittoral muddy sand (Table 18).
The distribution of the inshore habitat proxies for thornback ray egg-nursery in the case study area is mapped in Figure 65. It has been reported in the literature (Annex 1) that egg- nurseries potentially overlap with juvenile nursery grounds. Therefore, the habitat proxy distribution was compared with the overall distribution of juveniles of thornback ray from the West Coast of Scotland Demersal Fish Survey (WCDF, 2013/14) in the study area (no data on egg distribution were available).
The occurrence of juveniles in the survey was sparse, possibly due to limitations in the survey ability to catch these fish. Therefore, the survey data offer limited validation of the habitat map. Where observed, thornback ray juveniles appeared to overlap with suitable habitat patches identified in the northern Minch and in the Clyde. The survey data also suggested that thornback ray juvenile distribution into Loch Linnhe, an area for which there was no EUNIS habitat data coverage and therefore not assessed for habitat proxies. The habitat proxy map also identified a broad extent of potentially suitable habitat to the west of Islay and along the coast of Northern Ireland, west of Tiree and in the North Atlantic west of Orkney, although no survey data were available for most of these areas to confirm habitat use. No stakeholder feedback was received on this map following consultation.
| Thornback ray (eggs)–Habitat proxies for egg - nursery function (Low confidenceoverall) |
|---|
| EUNIS Habitat type (score /confidence) |
| A5.1 Sublittoral coarse sediment (2/L) A5.13 Infralittoral coarse sediment (2/L) A5.2 Sublittoral sand (2/L) A5.23 Infralittoral fine sand (2/L) A5.24 Infralittoral muddy sand (2/L) |
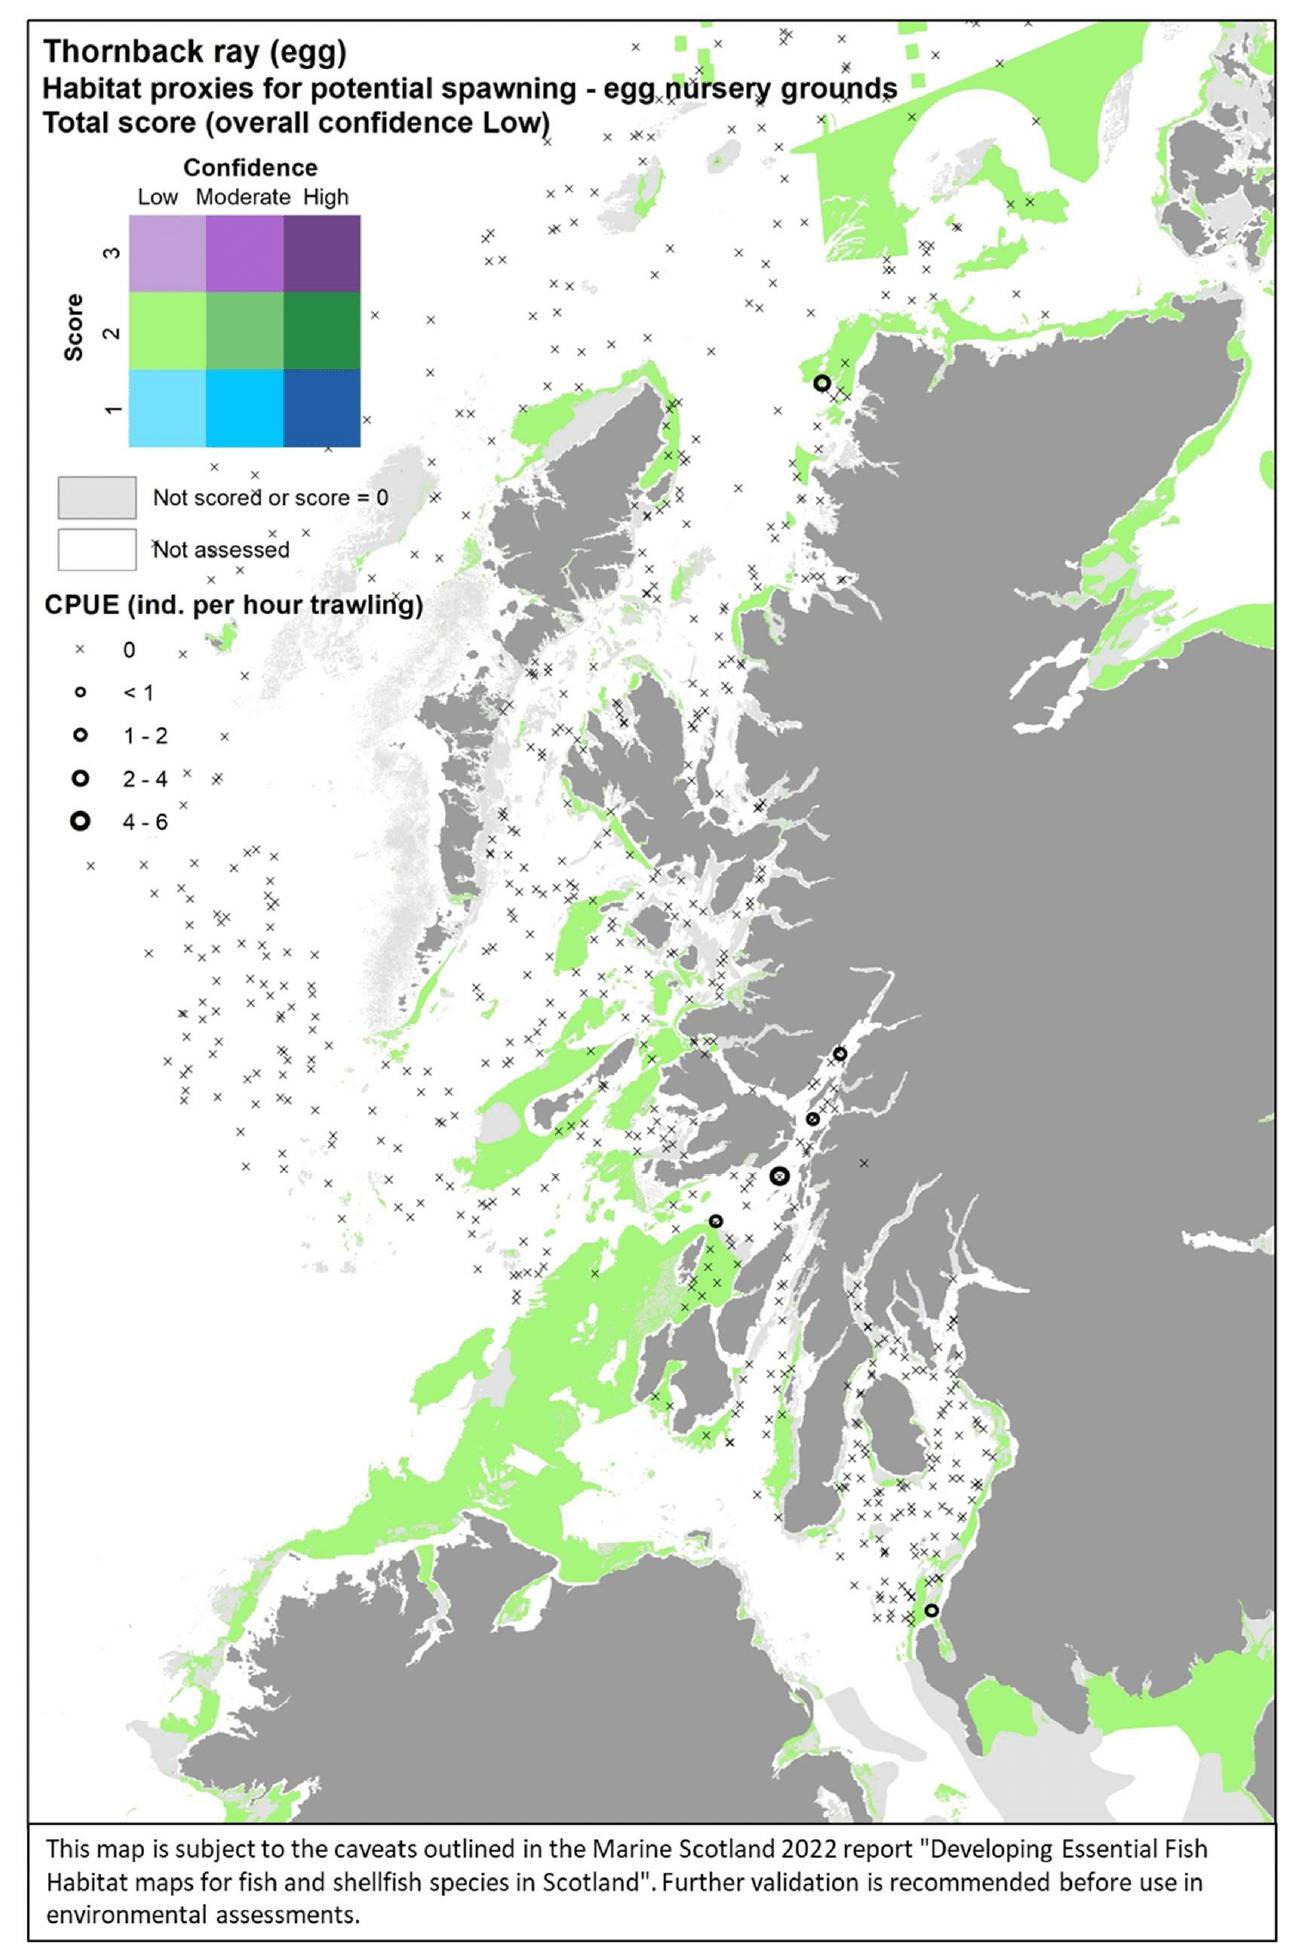
3.1.19 Spotted ray, Rajamontagui
Spotted ray (Raja montagui Fowler 1910) is an elasmobranch fish (skate) widespread around the British Isles. Its distribution normally overlaps with that of thornback ray, inhabiting offshore shelf and upper slope waters (down to 280 m depth), and being also common (mostly as juveniles) in inshore coastal waters. It may also occasionally occur in estuaries.
This species also anchors demersal egg capsules on shallow substrata inshore, although little is known about habitat preferences and site locations for these spawning grounds (also referred to as 'egg nursery'). Coastal areas with rocks and sand seabed are considered potential nursery areas, possibly overlapping with these spawning/egg-laying grounds (Annex 1).
Spotted ray was assessed by using the habitat proxy approach to identify habitats that may potentially be used by the juveniles of the species. Nine publications were reviewed but the information on juvenile habitat preferences was limited and not detailed enough to discriminate suitable habitats at the higher resolution (see Annex 1). Furthermore, no feedback was received from stakeholders. As such, a low confidence was associated with the overall assessment of habitat proxies for juvenile spotted ray.
Habitats high scoring for suitability could not be identified and, at best, habitats with moderate suitability (score 2) were identified, but with low confidence. These were sublittoral sands and infralittoral fine sands (Table 19).
The distribution of the inshore habitat proxies for spotted ray juveniles in the case study area is mapped in Figure 66, compared with the overall juvenile distribution from the West Coast of Scotland Demersal Fish Survey (WCDF, 2013/14) data in the study area. Juveniles were most frequently found in the southern surveyed areas, locally overlapping with suitable habitat identified (sometimes as small patches) in the map, e.g. north and west of Islay, west of Coll, south of Tiree, in the northern Minch. Juveniles were also found at the entrance of the Clyde (albeit in lower numbers) near areas where potentially suitable habitat was identified. No stakeholder feedback was received on this map following consultation.
| Spotted ray(juvenile)– Habitat proxies for nursery function(Low confidenceoverall) |
|---|
| EUNIS Habitat type (score /confidence) |
| A5.2 Sublittoral sand (2/L) A5.23 Infralittoral fine sand (2/L) |
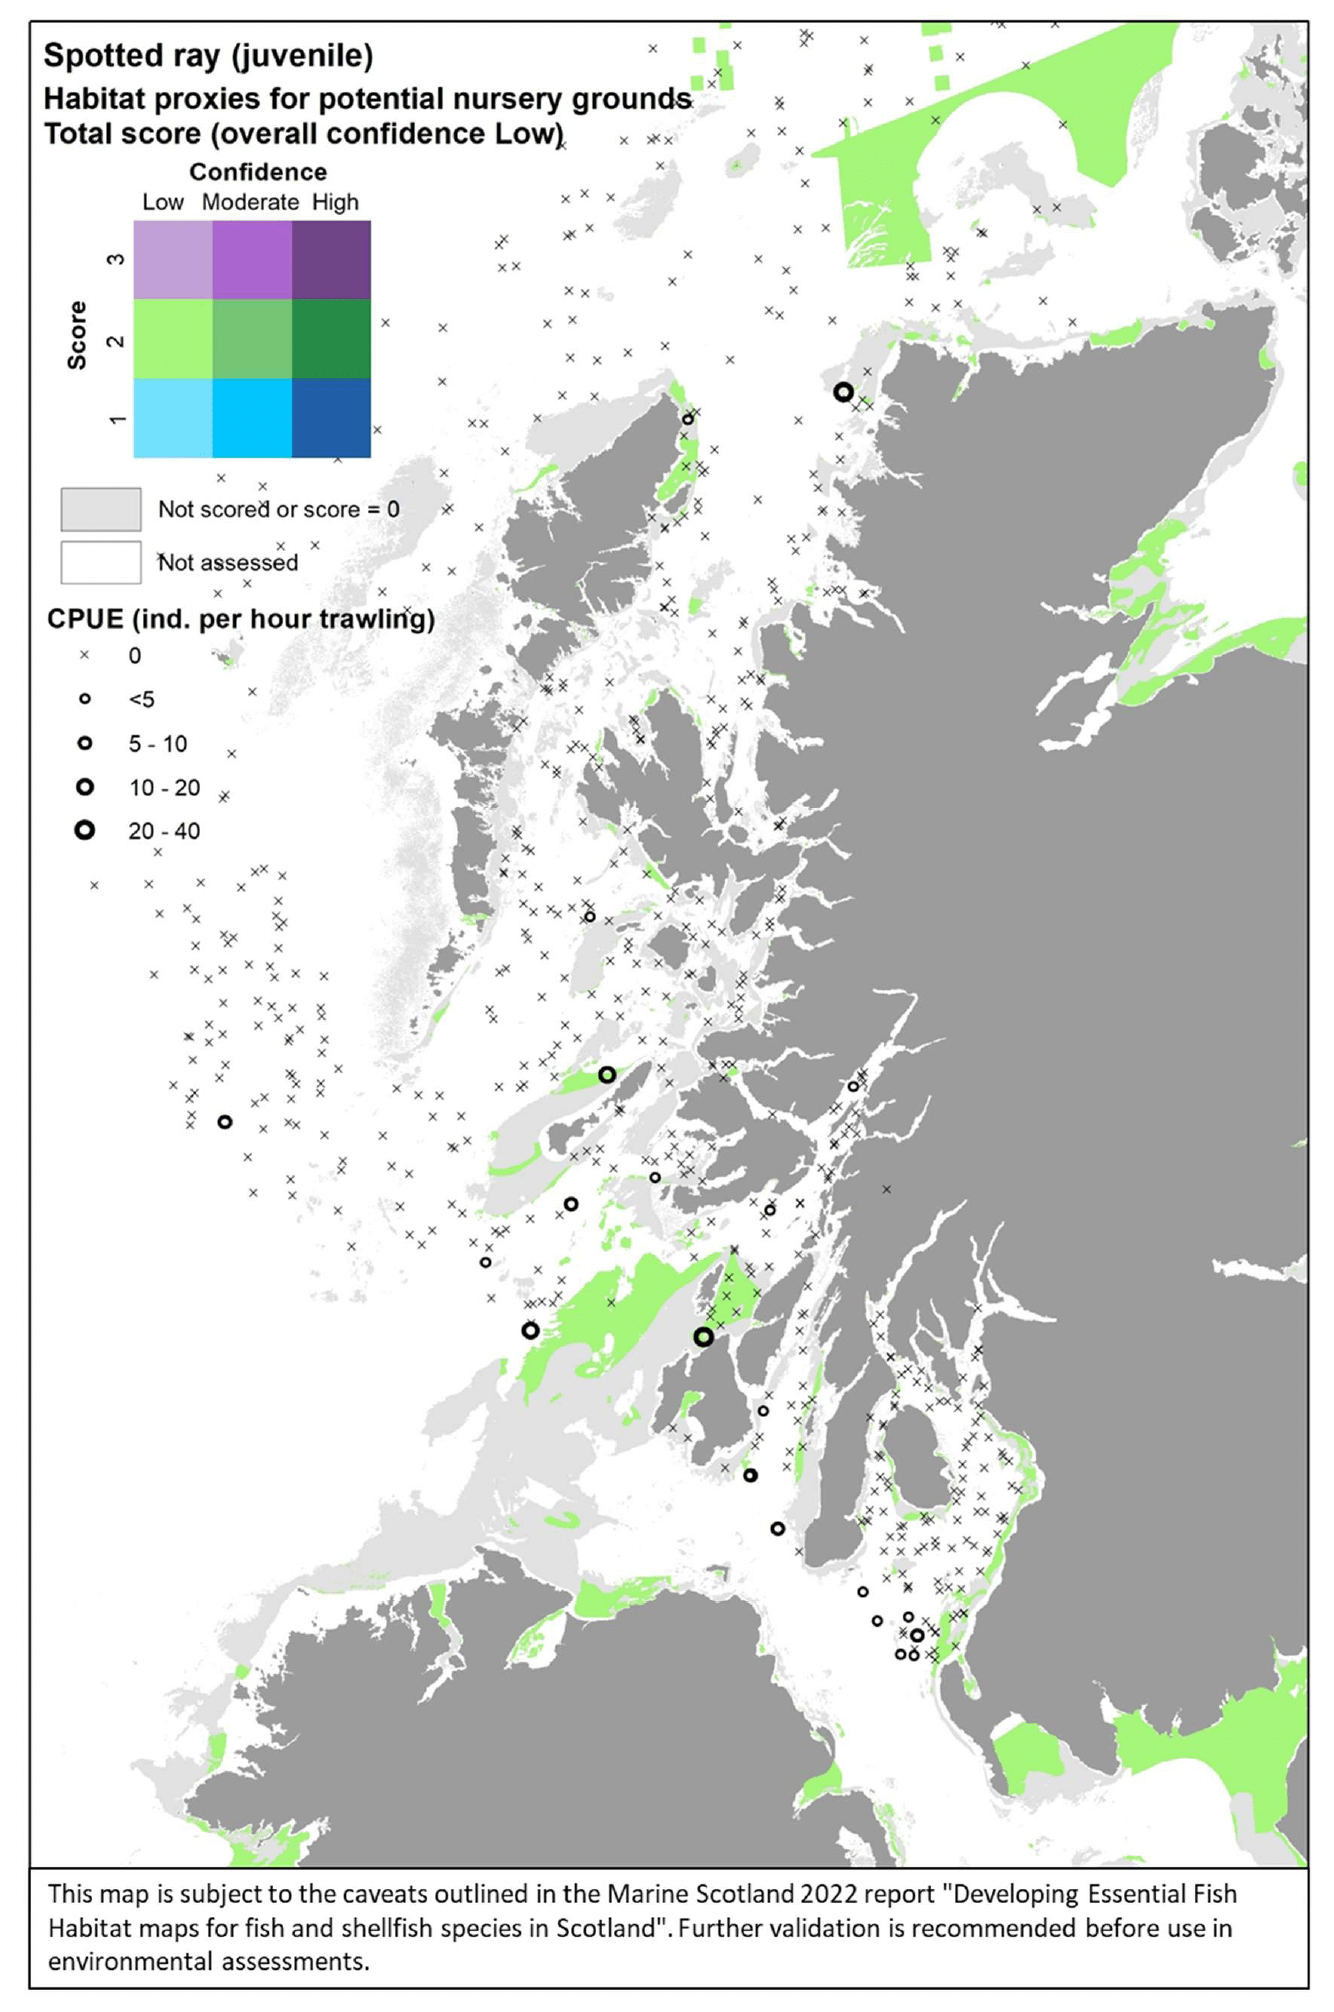
3.1.20 Spurdog, Squalusacanthias
Spurdog (Squalus acanthias Linnaeus 1758) is an elasmobranch fish (dogfish) widespread around the British Isles. It is a marine species commonly inhabiting the continental shelf (at depth between 15 and 528 m), although it also tolerates brackish water conditions and is often found in enclosed bays and estuaries (including sea lochs). It is designated as a Priority Marine Feature in Scotland seas. It is an ovoviviparous species, with gravid females carrying pups for almost two years before parturition. It is not known whether or not there are discrete parturition and nursery areas, although, historically, large numbers of new-born and pregnant spurdog have been found in relatively shallow waters and it has been hypothesised that young moved away from shallow waters after parturition (Annex 1).
Spurdog was assessed by using the habitat proxy approach to identify habitats that may potentially be used by neonates of the species, hence indicating possible parturition and nursery areas. Ten publications were reviewed but the information on juvenile/parturition habitat preferences was limited and not detailed enough to discriminate suitable habitats at the higher resolution (see Annex 1). Furthermore, no feedback was received from stakeholders. As such, a low confidence was associated with the overall assessment of habitat proxies for juvenile spurdog.
Habitats high scoring for suitability could not be identified and, at best, habitats with moderate suitability (score 2) were identified, but with low confidence. These were sublittoral sands and infralittoral fine sands (Table 20).
The distribution of the inshore habitat proxies for spurdog juveniles in the case study area is mapped in Figure 67, compared with the distribution of juveniles from the West Coast of Scotland Demersal Fish Survey (WCDF, 2013/14) data in the study area. The catches of spurdog juveniles in the survey highlight in particular the use of Loch Linnhe and the approaching areas (south of Mull). The coverage of the EUNIS habitat layer is limited in this area, but, where habitat proxies could be assessed, the location of suitable habitats in the area (south of Coull and upstream of Loch Linnhe, into Loch Eil) seems to support the survey observations. No stakeholder feedback was received on this map following consultation.
| Spurdog (juvenile) – Habitat proxies for nursery function (Low confidence overall) |
|---|
| EUNIS Habitat type (score /confidence) |
| A5.3 Sublittoral mud (2/L) A5.36 Circalittoral fine mud (2/L) |
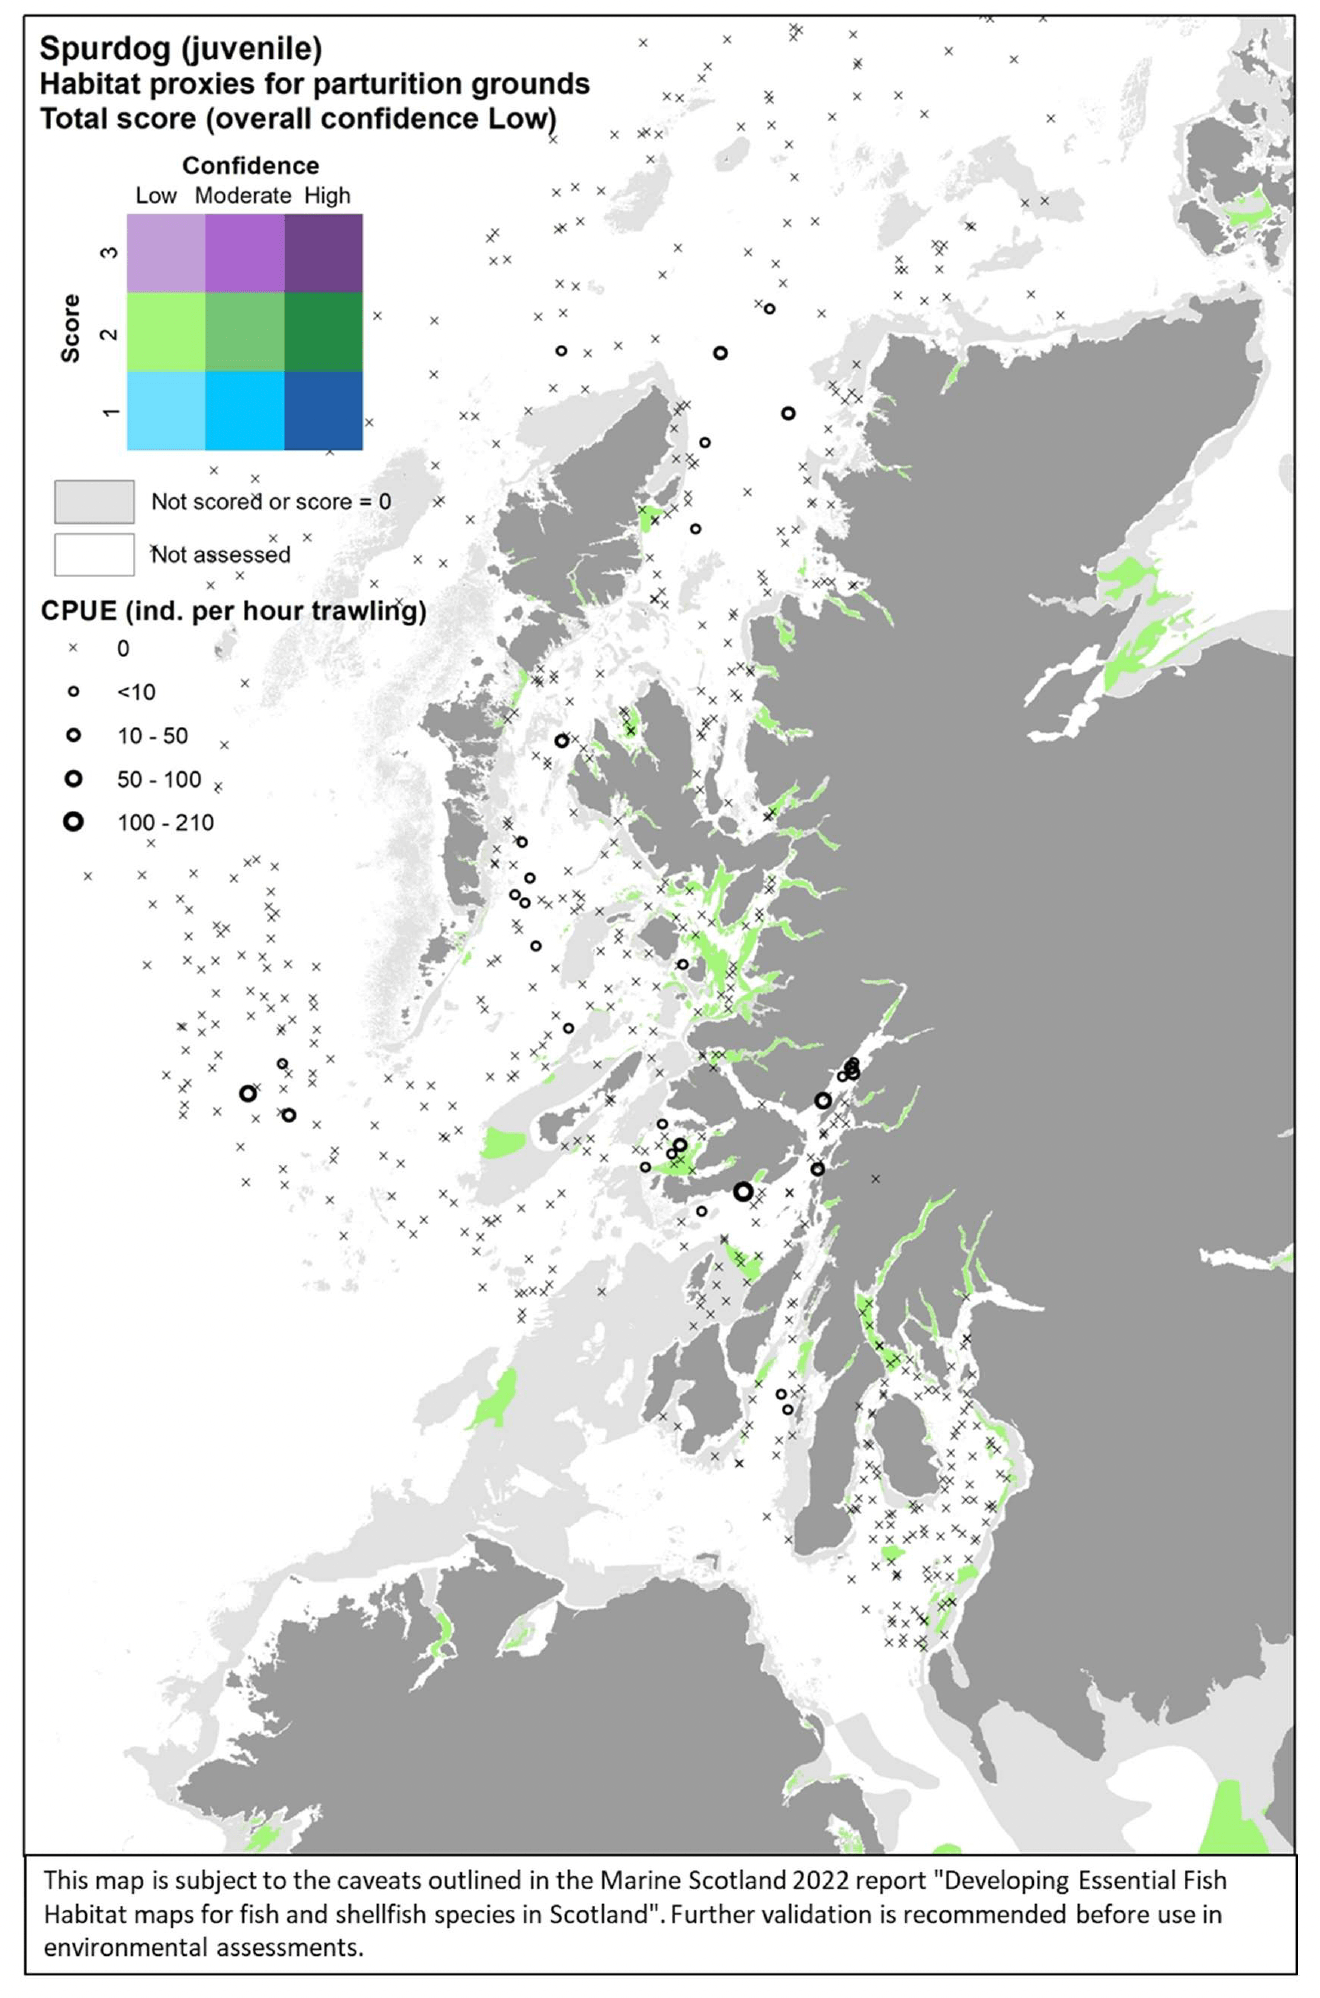
3.1.21 Long finned squid, Loligo forbesii
Long finned squid (Loligo forbesii Steenstrup 1856) is a cephalopod mollusc widely distributed around all British and Irish coasts. It is a short-lived species (1 year), characterised by rapid early growth being followed by maturation, spawning (mainly in winter in Scottish waters) and death after spawning. There is little knowledge about environmental requirements for spawning and nursery grounds, these being mainly in shallow inshore waters, with gradual migration to offshore feeding grounds as juvenile grow (Annex 1).
Long finned squid was assessed through modelling based on summer and autumn catches from bottom trawl surveys. Individuals <15 cm in mantel length were considered to identify immature recruits and their aggregations were used as indicator of potential higher value habitats used as nurseries.
Almost all variables accounting for geomorphological, energy and water quality characteristics (except for MLT) were selected by the model as predictors, as well as substratum type (Figure 68). Depth, wave energy at the seabed (WAV) and distance from the shore (Dist) were the most important predictors. Juvenile aggregations were predicted to occur at various combinations of these variables, but their highest probability of occurrence (0.87) was identified for shallower habitats (<58.2 m depth) within 21 km distance from the shore and with very low wave energy at the seabed (<3.3 N m2/s) (Figure 68).
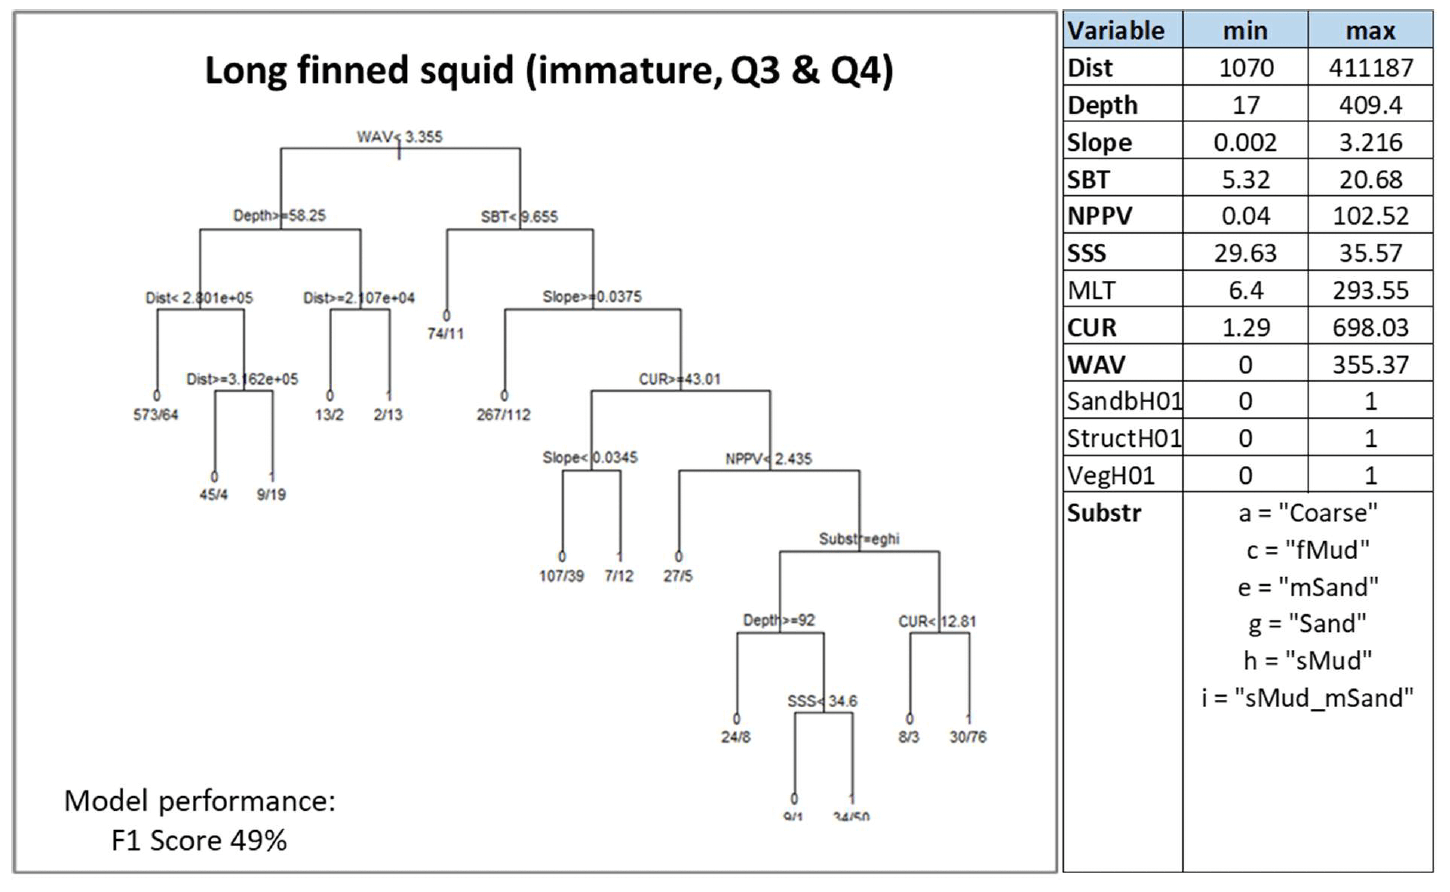
The model prediction applied to the mean environmental conditions of the period 2010 - 2020 (summer-autumn) allowed mapping of the potential distribution of juvenile aggregations as an indication of potential location of higher value juvenile habitats functioning as nursery for long finned squid (Figure 69).
The model predicted juvenile squid aggregations with moderate-low confidence (41%), and appeared to better capture the actual occurrence of juvenile aggregations offshore in the Rockall area, southern North Sea and off the south Irish coast, and in front of the Firth of Forth. In turn, comparison with the survey data showed that it failed to identify juvenile aggregations occurring off the Moray Firth, north of Scotland and Ireland (Figure 69).
Consultation with stakeholders highlighted that spawning and early nursery grounds occur further inshore than what is predicted by the model. This limitation of the model is due to the survey data used to calibrate it, both in terms of their distribution (poor coverage inshore) and seasonality. For example, in the Moray Firth fishers observe the laying of eggs in shallow areas very close to the shore in December-January, and their hatching in late May- early June, with abundant catches of smaller squids (around 4 cm in length) close to the shore, at depth <10 m. As they grow in size, juveniles gradually move farther from the shore, and by October-December they are found further offshore. This is a common pattern also observed by squid fishers elsewhere. Therefore, it is likely that the model (based on summer-autumn catch data further from the shore) only identifies secondary nursery grounds, i.e. aggregations of larger juveniles when they have already moved farther from the shore. Based on this information, additional areas were added on the map to identify primary nursery (and spawning) inshore grounds earlier in the year (Figure 69). These inshore areas were located in particular in correspondence of juvenile aggregations observed and/or predicted to occur further offshore later in the year. Occasional occurrences of juvenile aggregations recorded from the additional inshore demersal fish survey on the west coast of Scotland (Appendix C, Figure C41) locally confirmed the use of inshore habitats as nursery grounds (Figure 69).
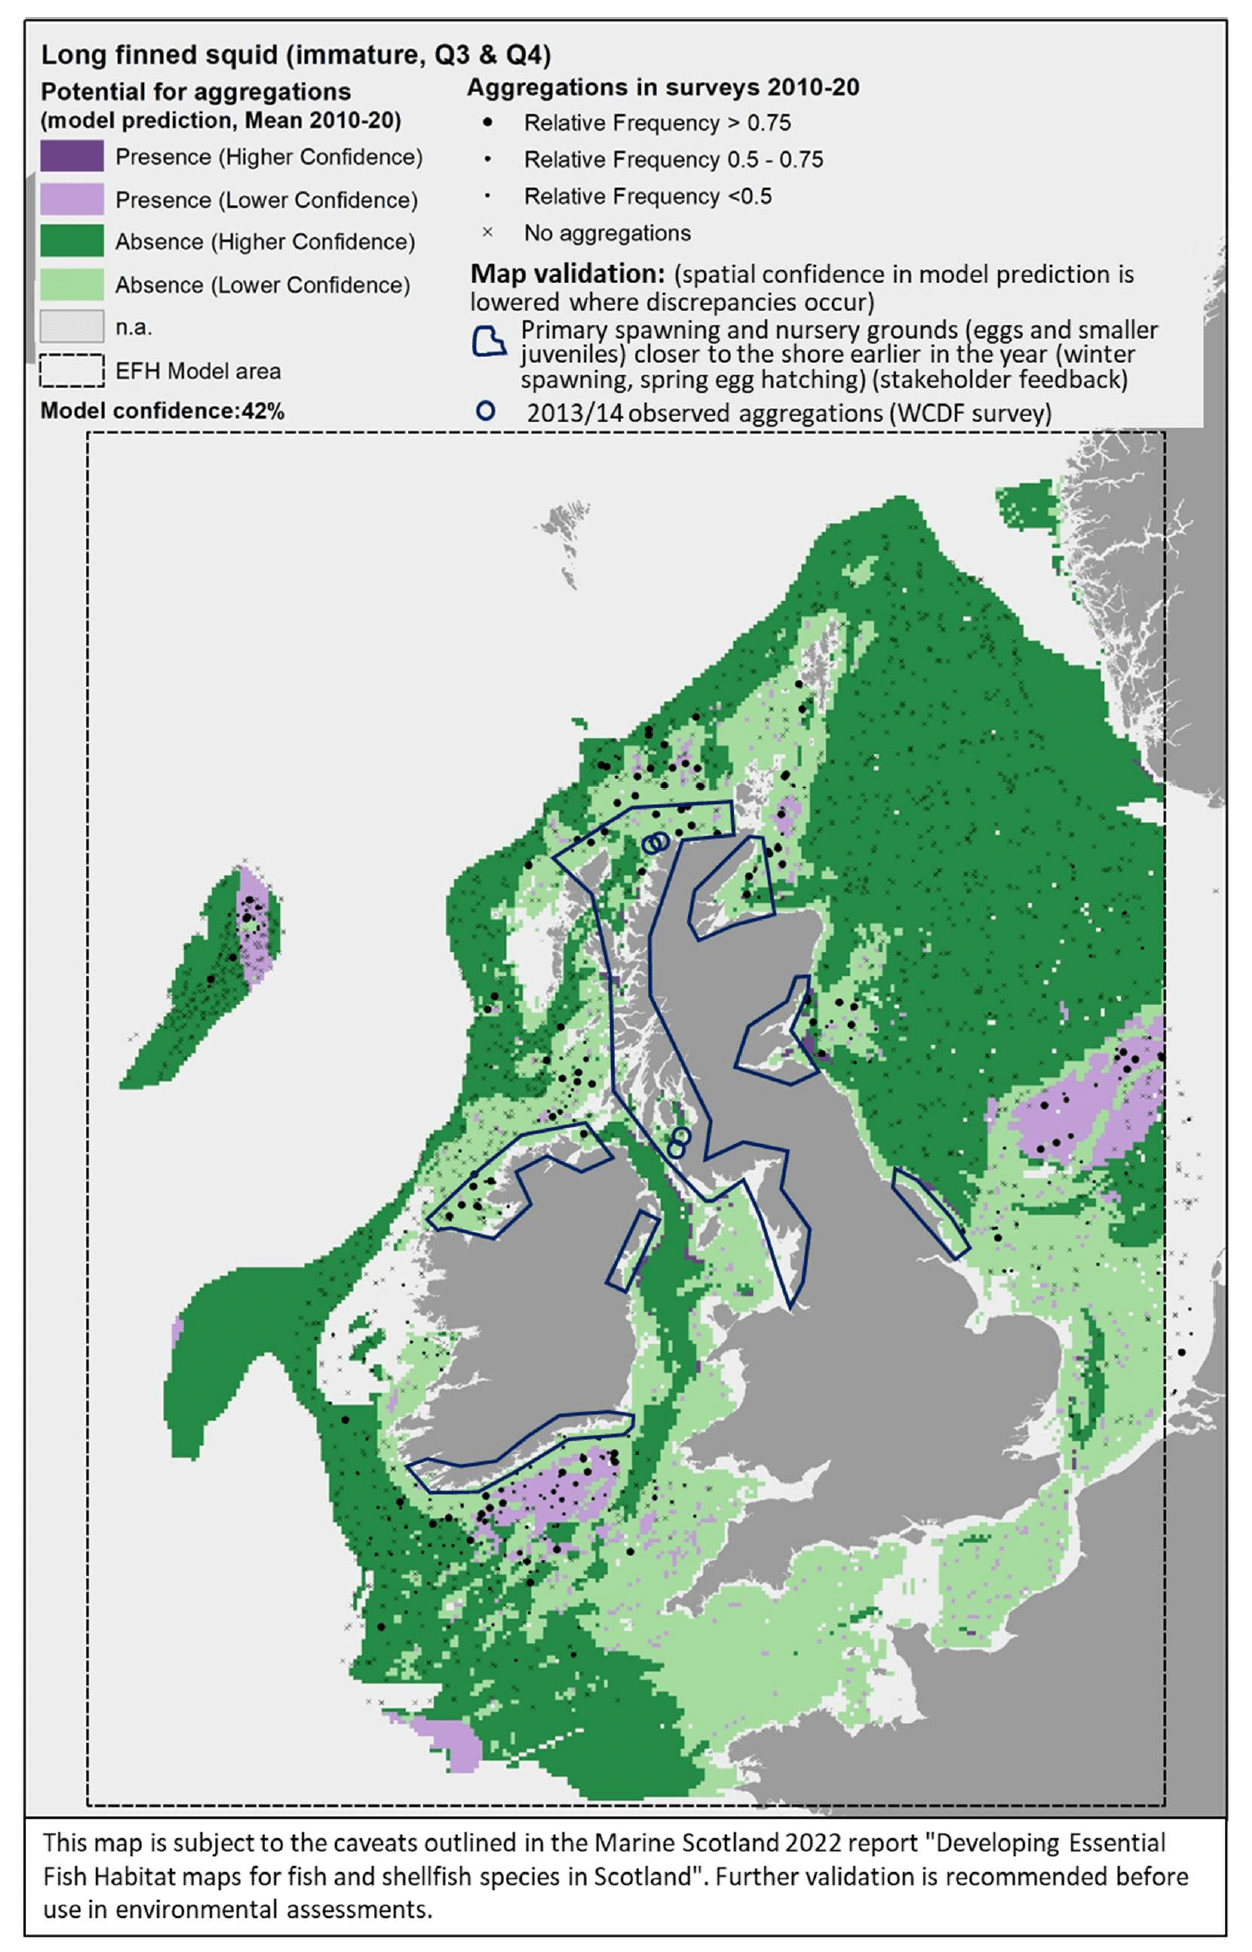
3.1.22 European lobster, Homarusgammarus
European lobster (Homarus gammarus, Linnaeus 1758) is a common benthic crustacean of high commercial importance which occurs around all British and Irish coasts. It is mostly found on rocky substrata, living in holes and excavated tunnels from the lower shore to about 60 m depth. Juveniles are thought to inhabit different habitats than adults and to have wide habitat tolerances enabling them to inhabit a variety of habitats, although most of the evidence comes from laboratory studies than from studies in the wild (Annex 1).
European lobster was assessed by using the habitat proxy approach to identify habitats that may potentially be used by the juveniles of the species. Nineteen publications were reviewed, but in most cases the information on specific habitat preferences of juveniles was not detailed enough to discriminate suitable habitats at the higher resolution (see Annex 1). In addition, no feedback was received from stakeholders. Therefore, a low confidence was associated with the overall assessment of habitat proxies for juvenile European lobster.
Habitats scoring high for suitability could not be identified and, at best, habitats with moderate suitability (score 2) were identified, but with low confidence. These were infralittoral rock, kelp and algal communities, infralittoral and circalittoral coarse sediments and fine muds (Table 21). Further possible habitats, scored with low suitability and low confidence (not shown in Table 21), included high and moderate energy littoral rock, exposed and tide swept shores, muddy sands and the neuston layer[19].
The distribution of the inshore habitat proxies for juveniles of European lobster in the case study area is mapped in Figure 70. No survey data were available for the map validation, nor stakeholder feedback was received on this map following consultation.
19 Neuston layer is the pelagic (water column) habitat at the interface between air and sea waters.
| European lobster(juvenile)–Habitat proxies for nursery function(Low confidence overall) |
|---|
| EUNIS Habitat type (score /confidence) |
| A3.1 Atlantic and Mediterranean high energy infralittoral rock (2/L) A3.11 Kelp with cushion fauna and/or foliose red seaweeds (2/L) A3.15 Frondose algal communities (other than kelp) (2/L) A3.2 Atlantic and Mediterranean moderate energy infralittoral rock(2/L) A3.21 Kelp and red seaweeds (moderate energy infralittoral rock) (2/L) A3.3 Atlantic and Mediterranean low energy infralittoral rock (2/L) A5.1 Sublittoral coarse sediment (2/L) A5.13 Infralittoral coarse sediment (2/L) A5.14 Circalittoral coarse sediment (2/L) A5.3 Sublittoral mud (2/L) A5.34 Infralittoral fine mud (2/L) A5.36 Circalittoral fine mud (2/L) |
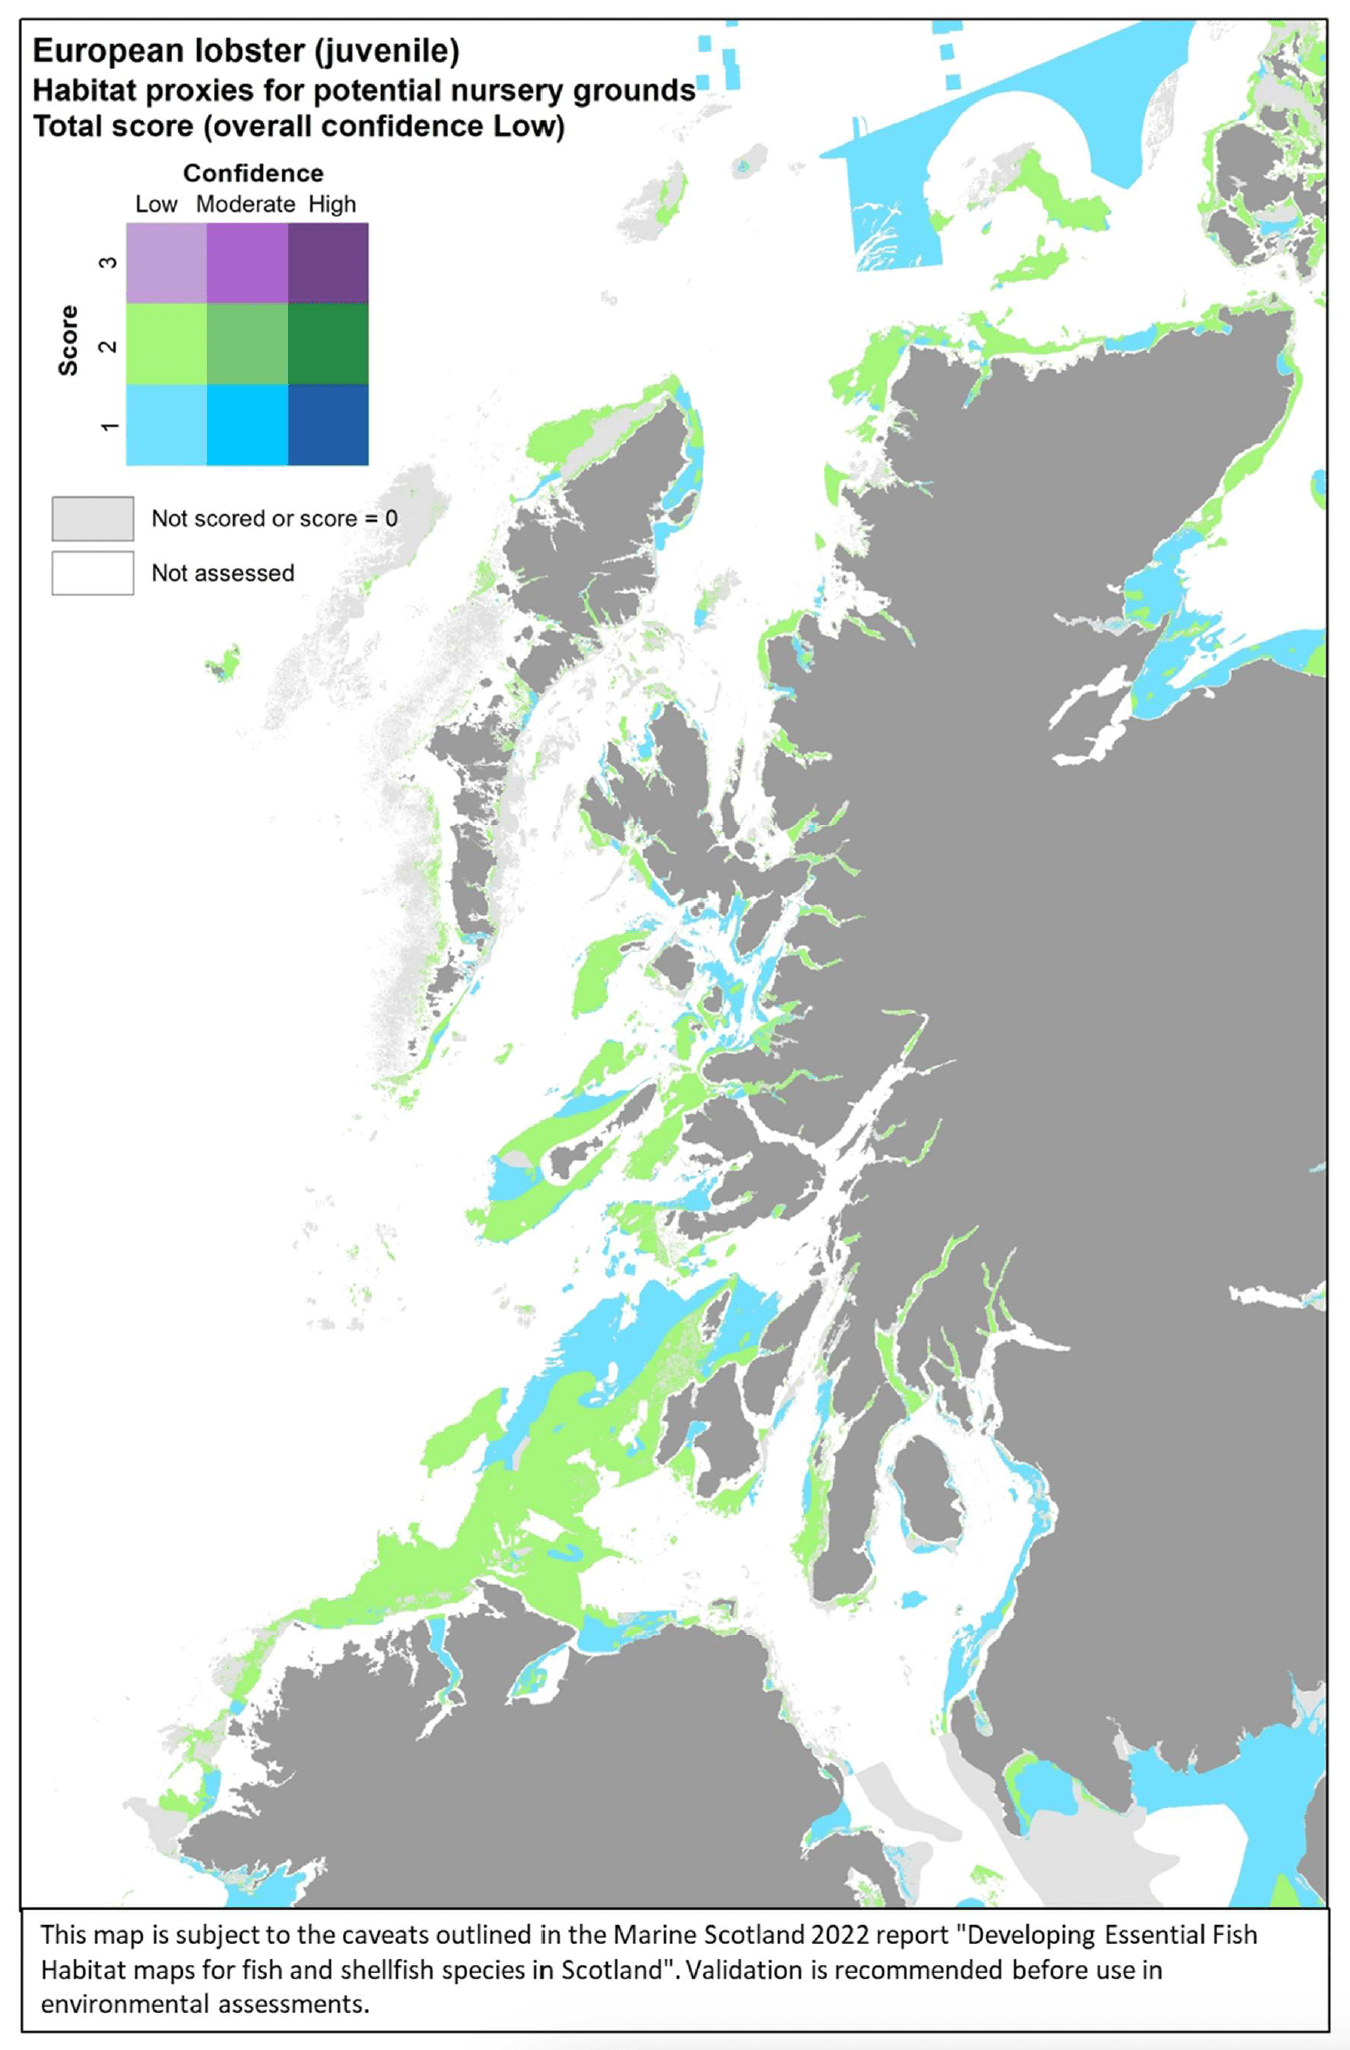
3.1.23 Brown crab, Cancerpagurus
Brown crab (Cancer pagurus Linnaeus 1758), also known as edible crab, is a common benthic crustacean of high commercial importance which occurs around all British and Irish coasts, with its distribution extending both further north and south. It is mostly found on bedrock including under boulders, mixed coarse grounds, and offshore in muddy sand, down to about 100 m depth. Ovigerous females find shelter in pits dug in sandy, gravelly sediment or under rocks, while juvenile habitat preference is for structurally complex biotopes (e.g. maerl beds, boulders, seagrass and rock formations, kelp forests or macroalgae), which provide shelter from predation (Annex 1).
Brown crab was assessed by using the habitat proxy approach to identify habitats that may potentially be used by the juveniles of the species. Fourteen publications were reviewed, but often the available evidence for juvenile habitat preferences was not detailed enough (e.g. mostly accounting for depth) to discriminate suitable habitats at the higher resolution (see Annex 1). In addition, no feedback was received from stakeholders. Therefore, a low- moderate confidence was assigned to the overall assessment of habitat proxies for juvenile brown crab.
The most suitable habitats for juveniles of brown crab were rocky habitats in the littoral and circalittoral zones, with higher scores allocated with high confidence to the littoral zones (A1.4, A1.41, A1.44) (Table 22). Other possible habitats, scored with medium to low suitability and medium to low confidence (not shown in Table 22) included kelp and seaweed habitats, maerl beds and seagrass beds.
The distribution of the inshore habitat proxies for juveniles of brown crab in the case study area is mapped in Figure 71. No survey data were available for the map validation, nor stakeholder feedback was received on this map following consultation.
| Brown crab(juvenile)–Habitat proxies for nursery function(Low-Moderate confidence overall) |
|---|
| EUNIS Habitat type (score /confidence) |
| A1.4 Featuresoflittoralrock(3/H) A1.41 Communities of littoral rockpools (3/H) A1.44 Communities of littoral caves and overhangs (3/H) A4.2 Atlantic & Mediterranean moderate energy circalittoral rock (2/M) A4.23 Communities on soft circalittoral rock (2/M) |
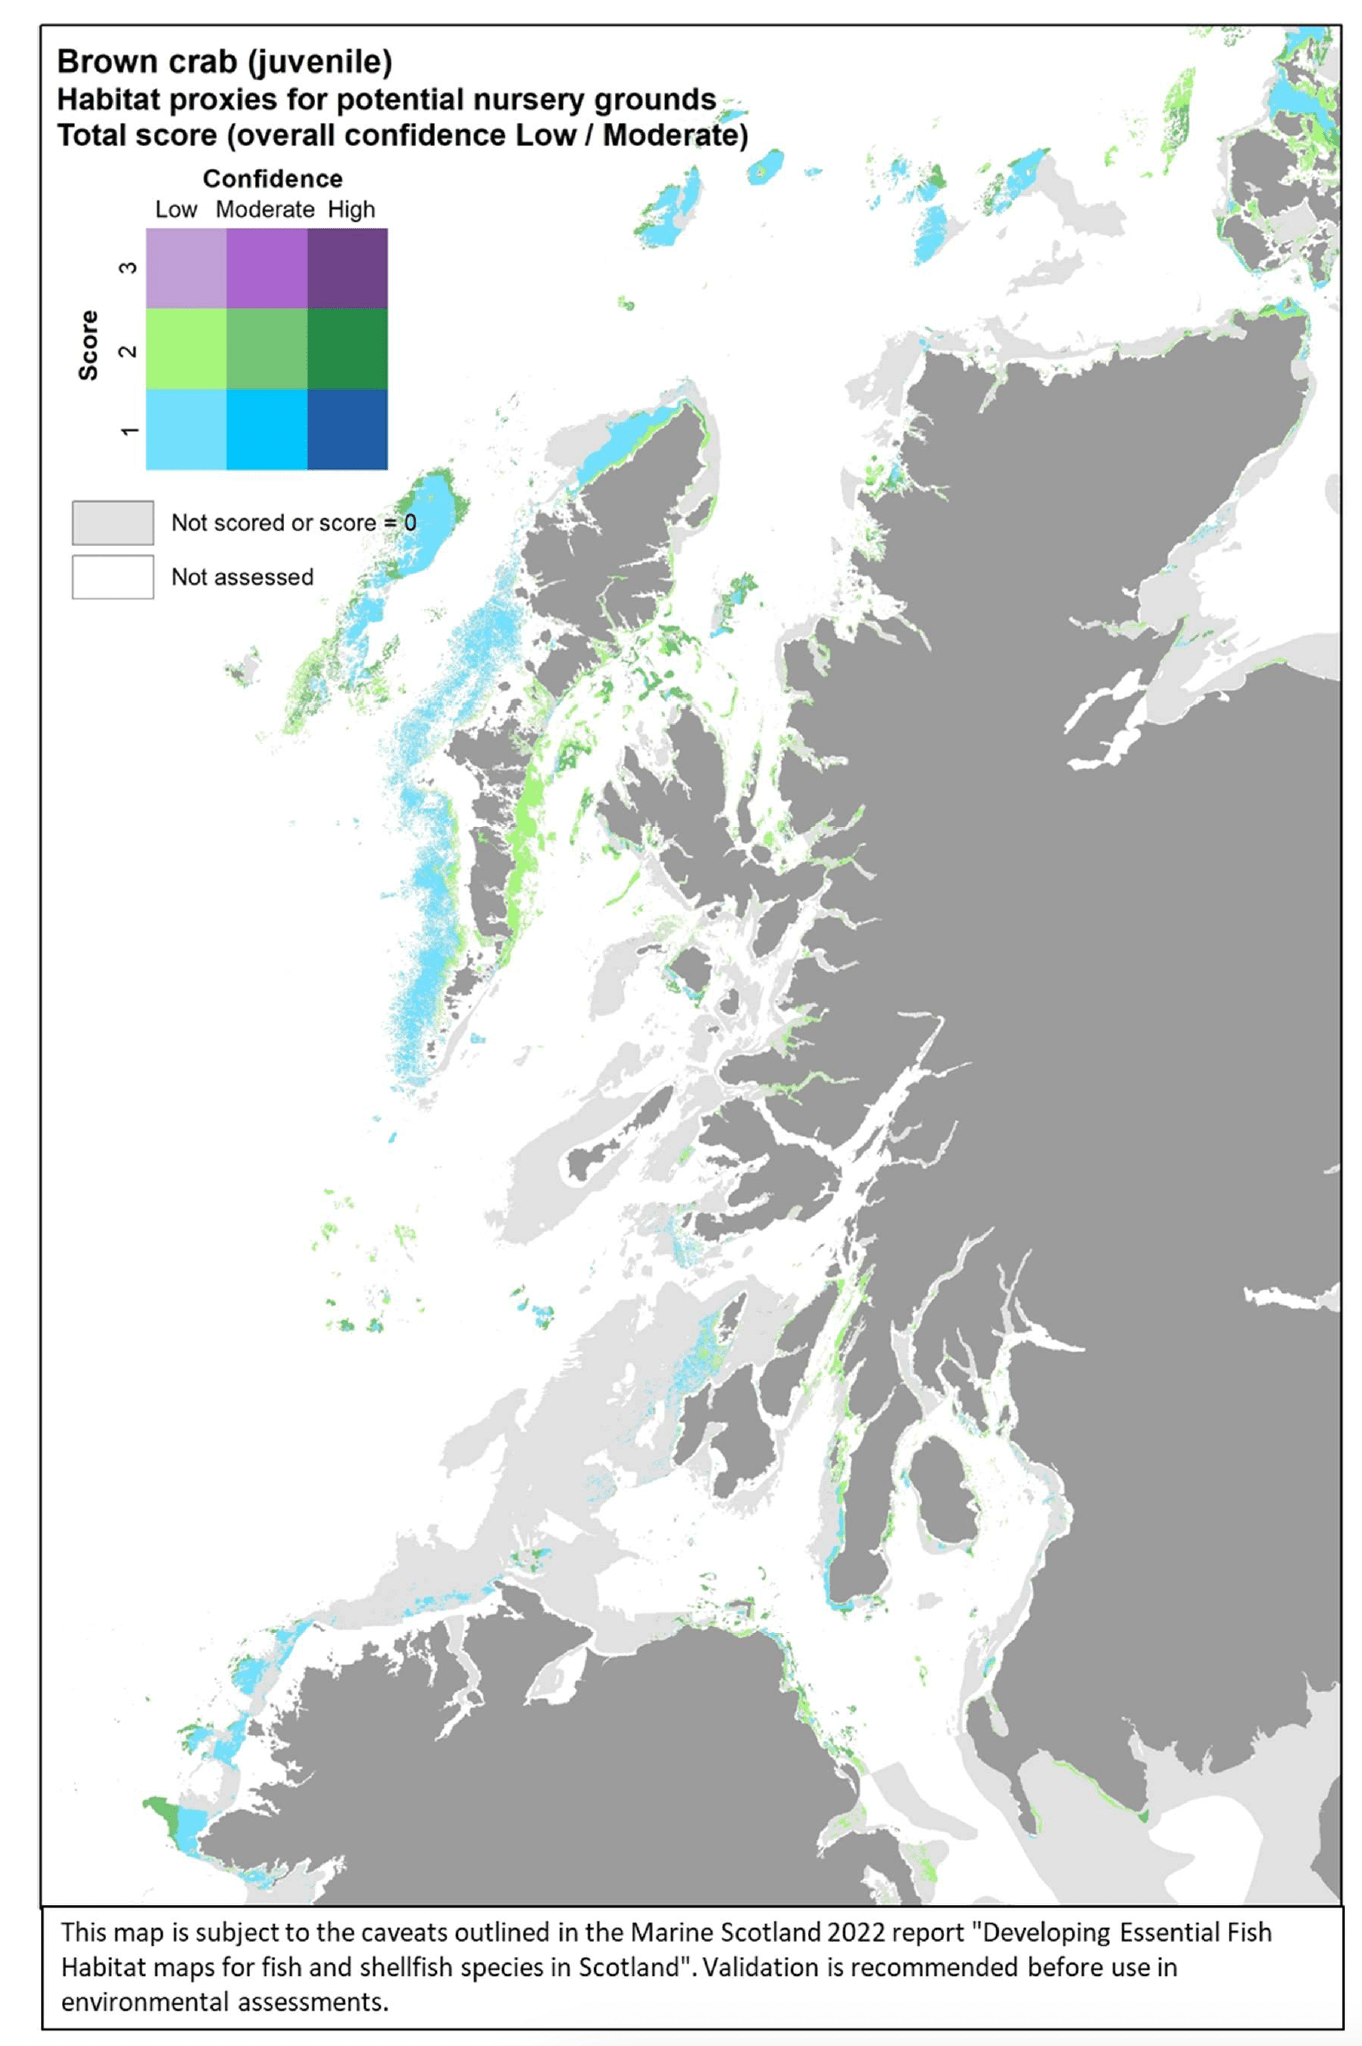
3.1.24 Velvet crab, Necorapuber
Velvet crab (Necora puber, Linnaeus 1767), also known as swimming crab, is a benthic crustacean of commercial interest which occurs around all British and Irish coasts. It is mostly found in inshore waters, on stony and rock substrata intertidally and in shallow water, most abundant on moderately sheltered shores. There is no evidence in the literature of a specific spawning or nursery habitat that is distinguished from where the species normally lives (Annex 1).
Velvet crab was assessed by using the habitat proxy approach to identify habitats that may potentially be used by the species (for different functions). Seven publications were reviewed, but the available evidence was not always detailed enough to discriminate suitable habitats at the higher resolution (see Annex 1). In addition, no feedback was received from stakeholders. Therefore, a moderate confidence was assigned to the overall assessment of habitat proxies for velvet crab.
Atlantic and Mediterranean moderate energy infralittoral rock was identified as a highly suitable habitat for velvet crab, albeit with moderate confidence, whereas moderate energy littoral rock had moderate suitability (also with associated moderate confidence) (Table 23). Further possible habitats, though scored with low suitability and low confidence included the neuston[20], rockpools and circalittoral rocks (not shown in Table 23).
The distribution of the inshore habitat proxies for velvet crab in the case study area is mapped in Figure 72. No survey data were available for the map validation, nor stakeholder feedback was received on this map following consultation.
| Velvet crab – Habitat proxies for the species' habitat (Moderate confidence overall) |
|---|
| EUNIS Habitat type (score /confidence) |
| A1.2 Moderate energy littoral rock (2/M) A3.2 Atlantic and Mediterranean moderate energy infralittoral rock (3/M) |
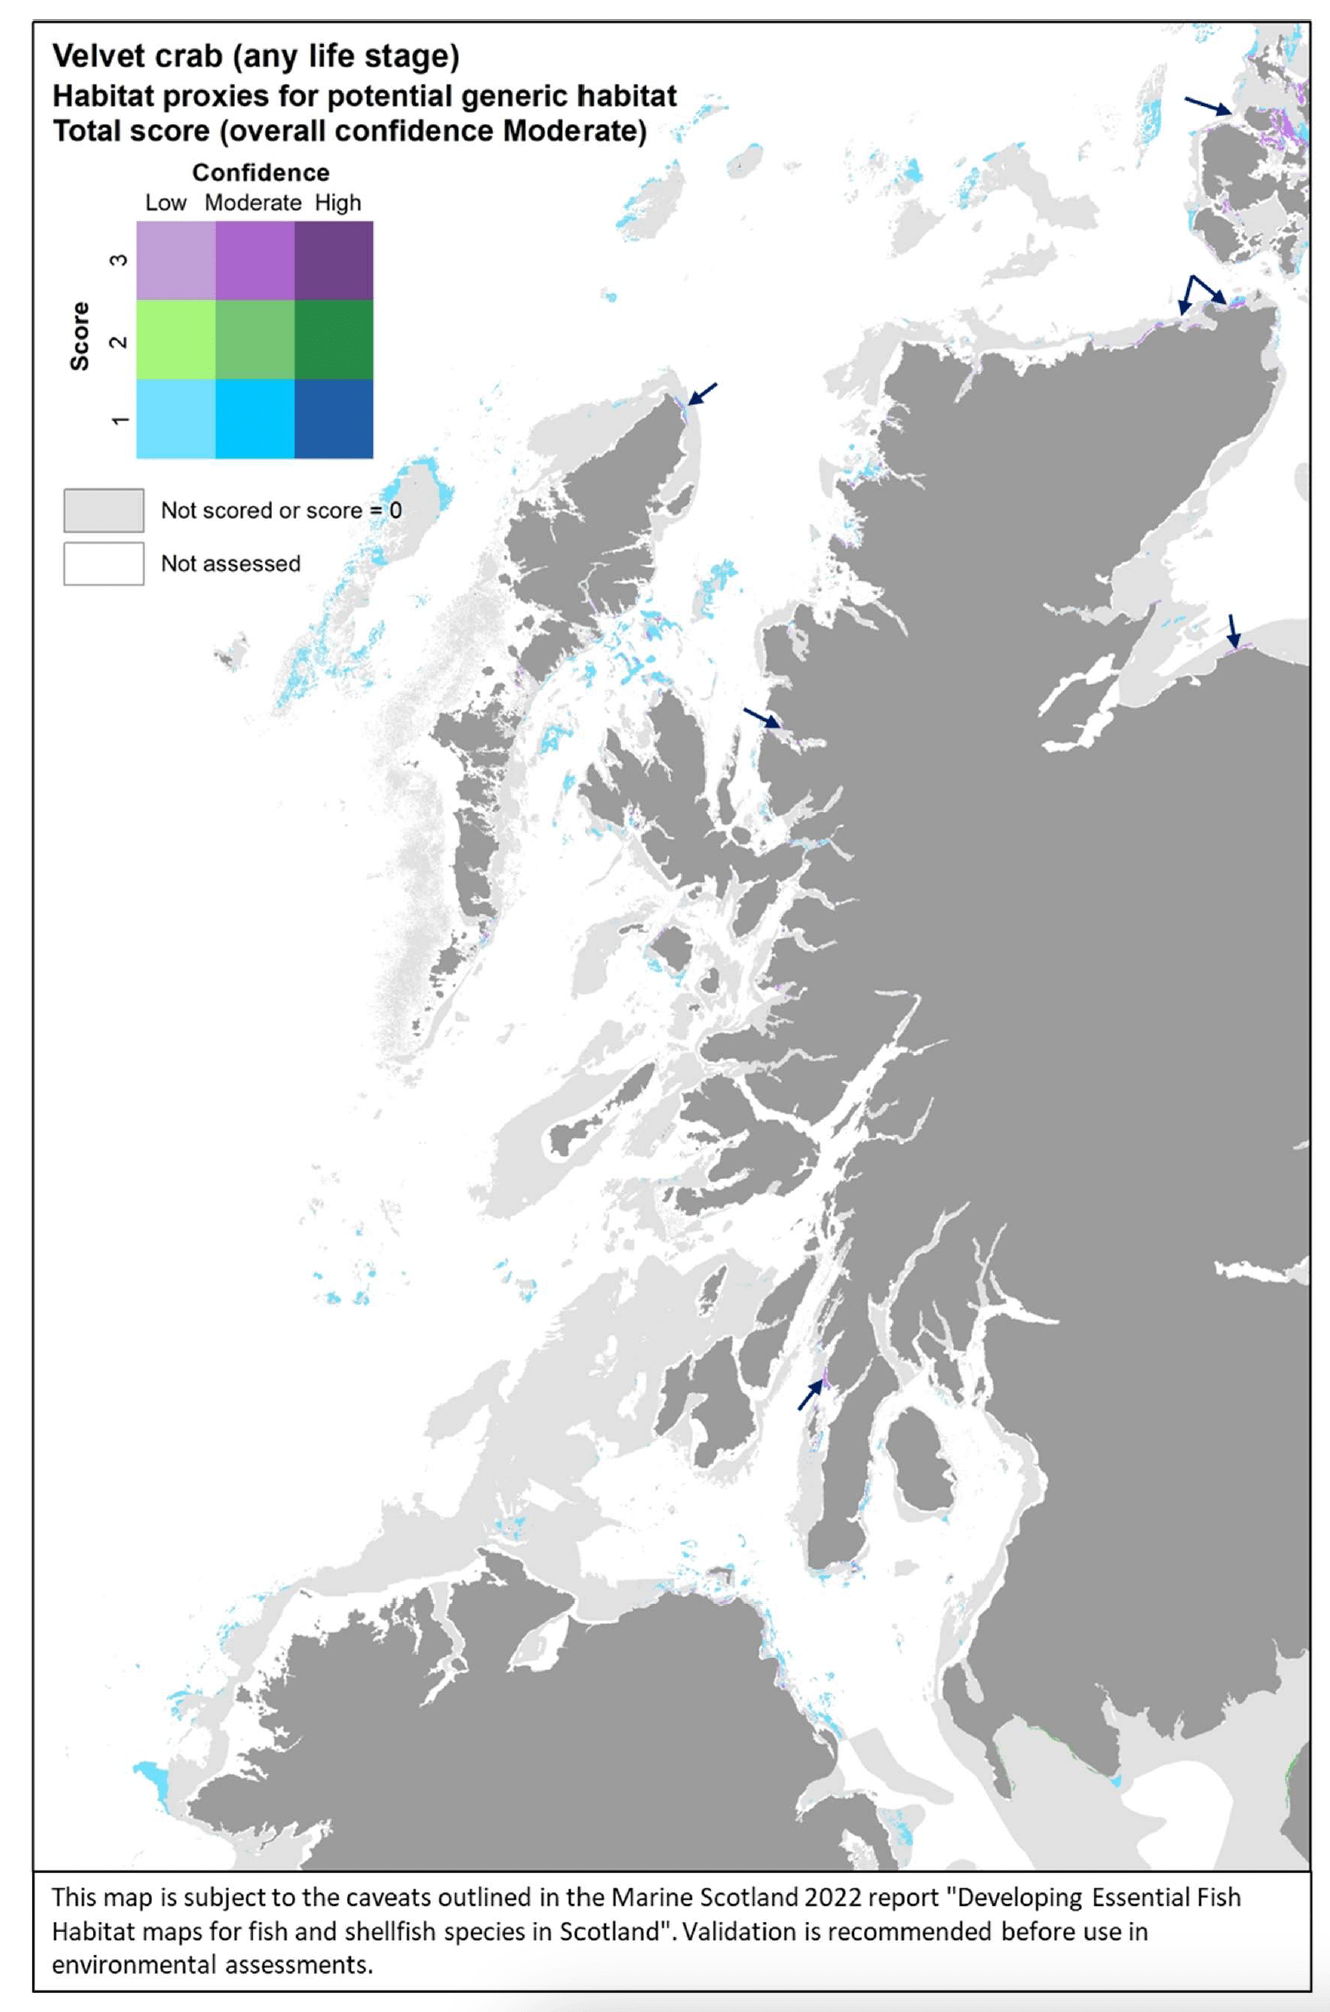
3.1.25 Common cockle, Cerastodermaedule
Common cockle (Cerastoderma edule, Linnaeus 1758) is a predominantly intertidal bivalve widely distributed in estuaries and sandy bays around the coasts of Britain and Ireland, where it inhabits the surface of sediments, burrowing to a maximum depth of 5 cm.
Gametes are released in the water column and larvae are free drifting until settlement. A sessile species, adults distribute where the juveniles settle, hence the same habitat performs multiple functions (feeding, spawning, nursery) (Annex 1).
Common cockle was assessed by using the habitat proxy approach to identify habitats that may potentially be used by the species (for different functions). Six publications were reviewed and provided extensive and detailed characterisation of the species' habitat requirements (see Annex 1). This, along with expert input obtained with the stakeholder validation, led to a high confidence in the overall assessment of habitat proxies for common cockle.
Sandy and mixed habitats in the littoral zone were identified as highly suitable habitats for common cockle, and with high confidence (Table 24). Other possible habitats (not shown in Table 24) were areas with ephemeral green or red algae with a freshwater influence and littoral sediments dominated by aquatic angiosperms, specifically seagrass, all scoring 2/M. Further possible habitats, scored with medium to low suitability and medium to low confidence, included littoral mud and strandline habitats.
The distribution of the inshore habitat proxies for common cockle in the case study area is mapped in Figure 73. No survey data were available for the map validation, nor stakeholder feedback was received on this map following consultation.
| Common cockle – Habitat proxies for the species' habitat (High confidence overall) |
|---|
| EUNIS Habitat type (score /confidence) |
A2.2 Littoral sand and muddy sand (3/H) A2.23 Polychaete/amphipod-dominatedfinesandshores(3/H) A2.24 Polychaete/bivalve-dominatedmuddysandshores(3/H) A2.4 Littoral mixed sediments(3/H) A2.42 Species-rich mixed sediment shores (3/H) |
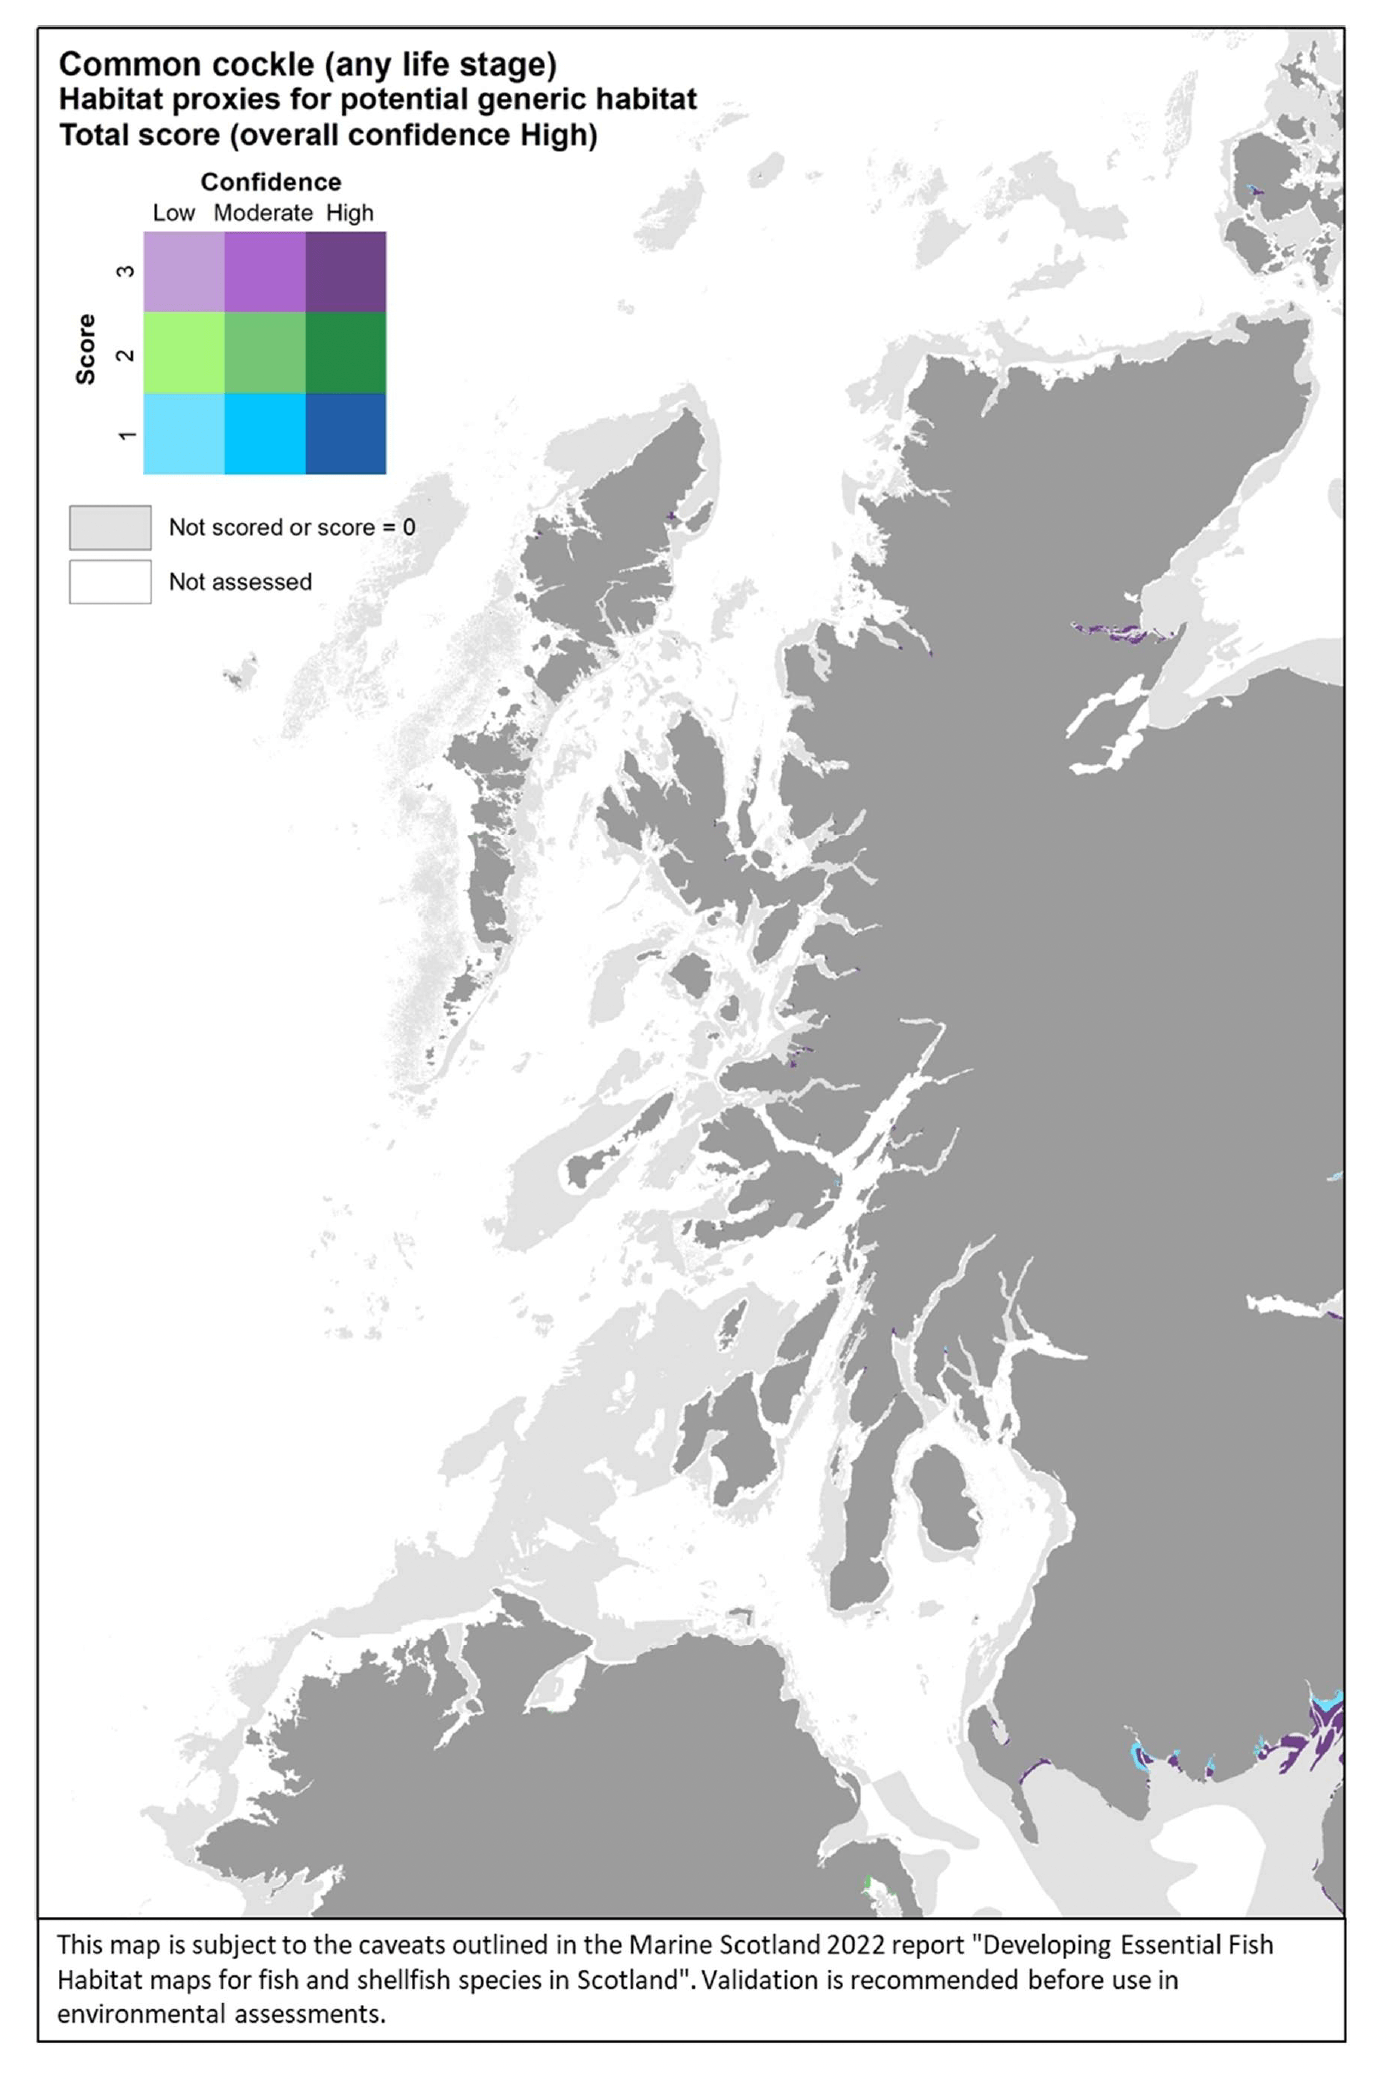
3.1.26 Dog cockle, Glycymerisglycymeris
Dog cockle (Glycymeris glycymeris, Linnaeus 1758) is a bivalve of the endofauna (i.e. living below the surface of the sediment), found in Scottish waters (around the Shetland Islands and the Orkneys), along the south and west coasts of Britain, Northern Ireland and Ireland. It is generally found in both inshore and offshore waters (to a depth of 100 m), on fine shell gravel or sandy/muddy gravel substrata. There is no information about spawning and juvenile habitat preferences, but, being a sessile species, it is expected that the same habitat performs multiple functions for different life stages (feeding, spawning, nursery) (Annex 1).
Dog cockle was assessed by using the habitat proxy approach to identify habitats that may potentially be used by the species (for different functions). Four publications were reviewed and provided information in sufficient detail to identify clearly and uniquely the habitat preference for the species (see Annex 1). No feedback was received from stakeholders for this species. A moderate-high confidence was assigned to the overall assessment of habitat proxies for dog cockle.
Subtidal coarse or mixed sediments in variable depth zones (sublittoral, infralittoral, circalittoral) were identified as a highly suitable habitats for dog cockle, and with high confidence (Table 25). This species has clear habitat preferences and no other habitat types were identified as suitable.
The distribution of the inshore habitat proxies for dog cockle in the case study area is mapped in Figure 74. No survey data were available for the map validation, nor stakeholder feedback was received on this map following consultation.
| Dog cockle–Habitat proxies for thespecies' habitat(Moderate-High confidenceoverall) |
|---|
| EUNIS Habitat type (score /confidence) |
| A5.1 Sublittoralcoarsesediment(3/H) A5.13Infralittoralcoarsesediment(3/H) A5.14 Circalittoral coarse sediment(3/H) A5.4 Sublittoral mixed sediments (3/H) A5.43 Infralittoral mixed sediments(3/H) A5.44 Circalittoral mixed sediments(3/H) |
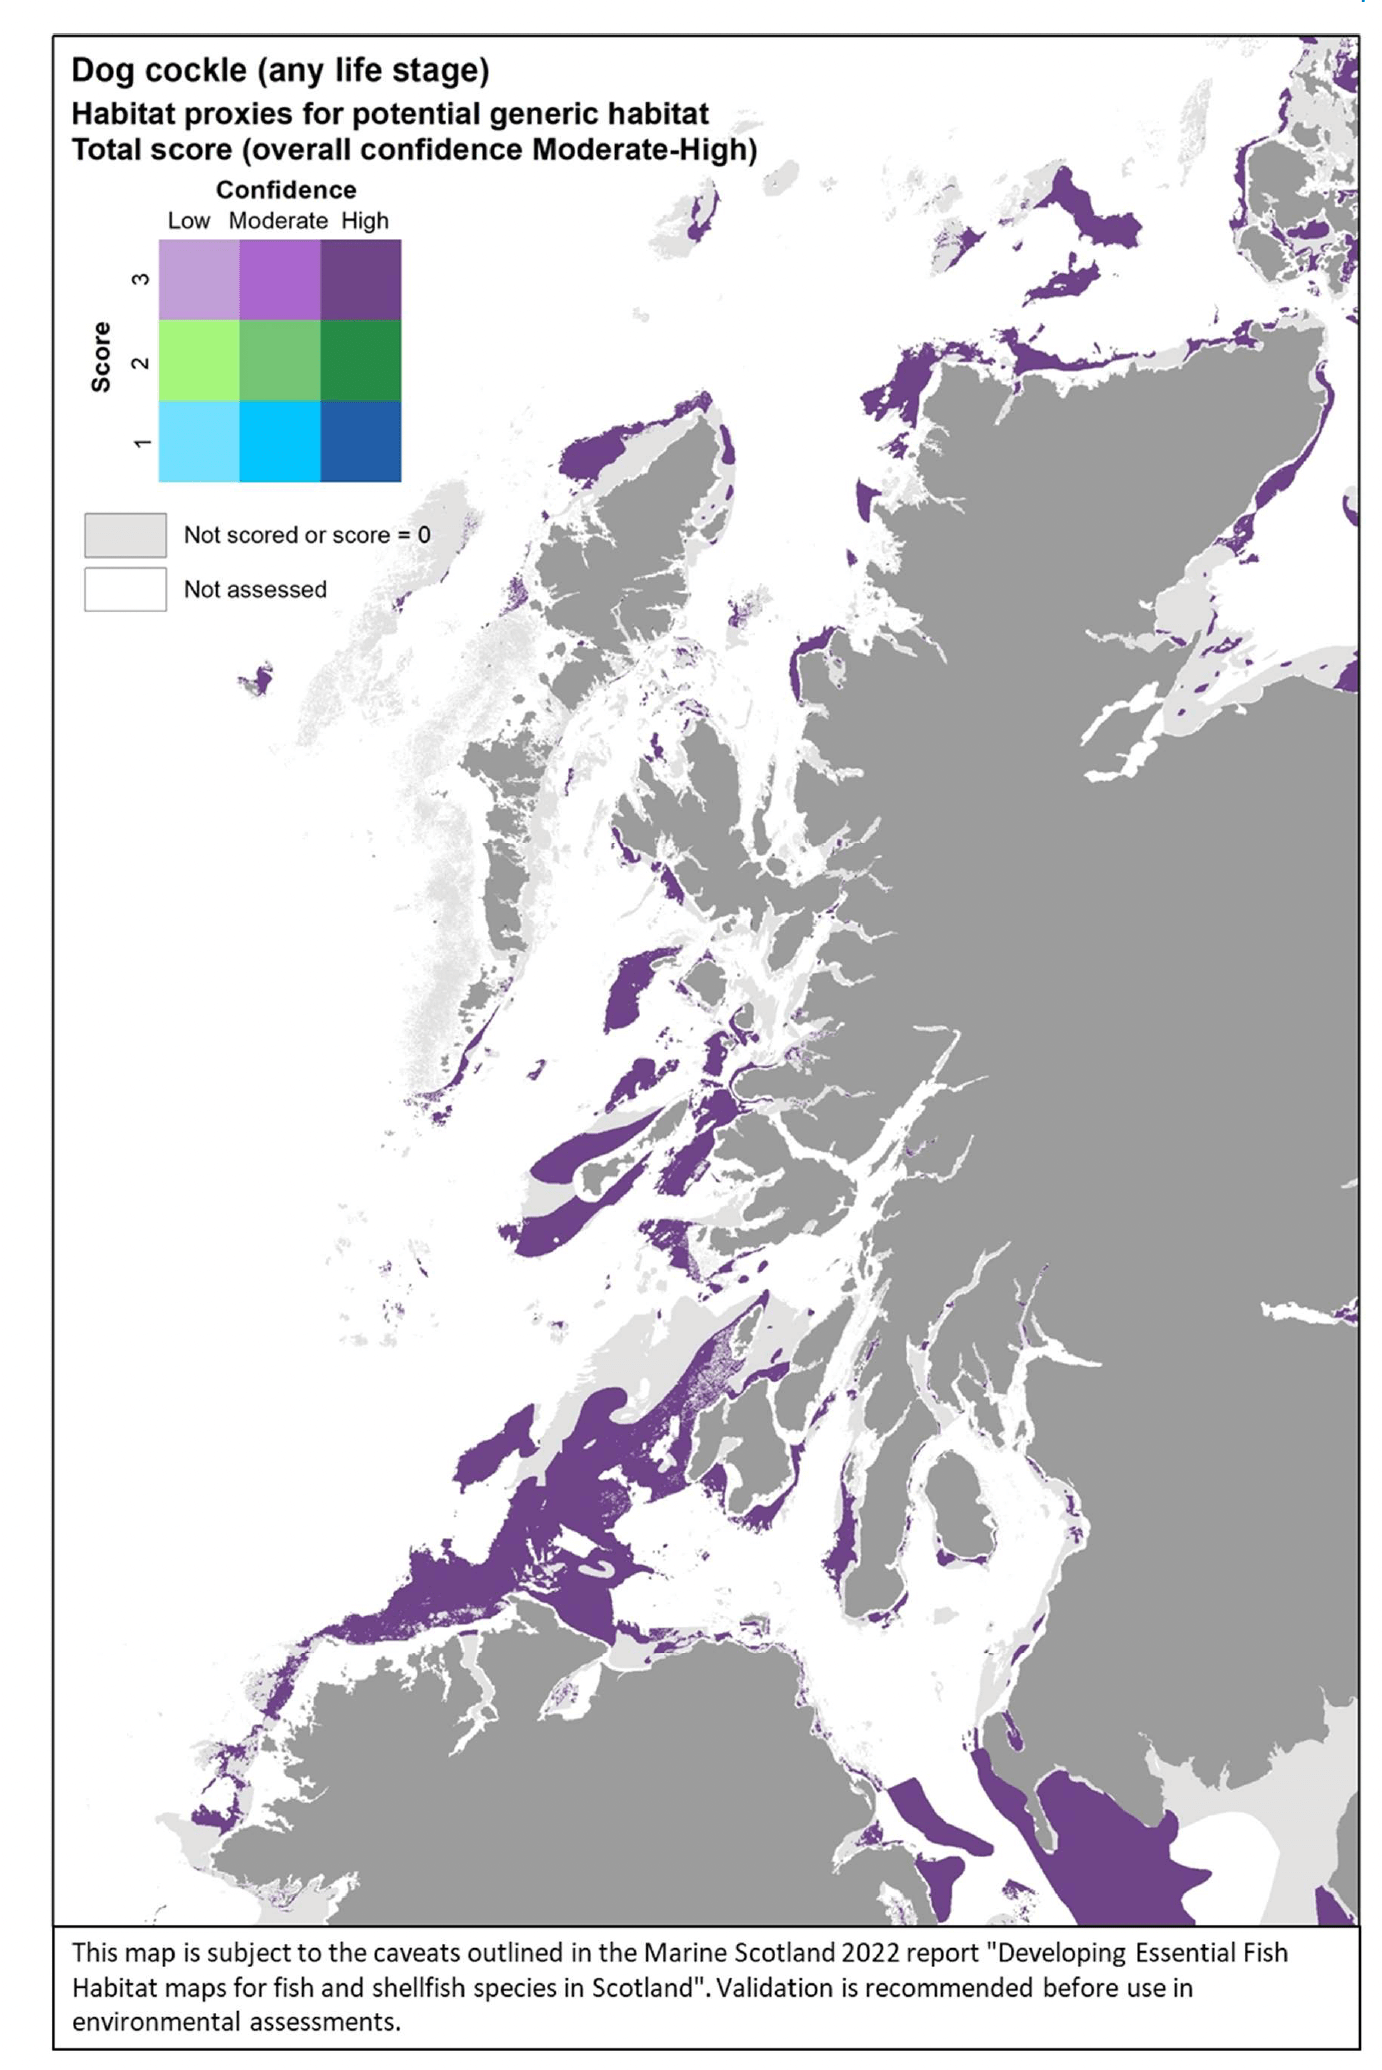
3.1.27 Razor clam, Ensisensis
Razor clam (Ensis ensis, Linnaeus 1758) is an elongated bivalve of the endofauna which lives in deep, vertical, permanent burrows. It is commonly found in inshore shallow habitats along all British coasts, on fine sand (sometimes muddy sand). There is no information about spawning and juvenile habitat preferences, but, being a sessile species, it is expected that the same habitat performs multiple functions for different life stages (feeding, spawning, nursery) (Annex 1).
Razor clam was assessed by using the habitat proxy approach to identify habitats that may potentially be used by the species (for different functions). Four publications were reviewed and provided extensive and detailed characterisation of the species' habitat requirements (see Annex 1). Despite no feedback being received from stakeholders on the scoring of this species, the available evidence was judged enough to assign a high confidence to the overall assessment of habitat proxies for razor clam.
Fine and muddy sands from the infralittoral and sublittoral zones were identified as a highly suitable habitats for razor clam, and with high confidence (Table 26). These represent optimal substrata for the species to make their burrows. Similar habitats, but at greater depth (circalittoral zone) were identified as moderately suitable, also with high confidence. Further possible habitats, though scored with medium to low suitability and medium to low confidence (not shown in Table 26), included sandy muds and mixed sediments in the sublittoral (infralittoral and circalittoral) zone.
The distribution of the inshore habitat proxies for razor clam in the case study area is mapped in Figure 75. No survey data were available for the map validation, nor stakeholder feedback was received on this map following consultation.
| Razor clam – Habitat proxies for the species' habitat (High confidence overall) |
|---|
| EUNIS Habitat type (score /confidence) |
| A5.2 Sublittoral sand(3/H) A5.2 Infralittoral fine sand (3/H) A5.24 Infralittora lmuddy sand(3/H) A5.25 Circalittoral fine sand (2/H) A5.26 Circalittoral muddy sand (2/H) |
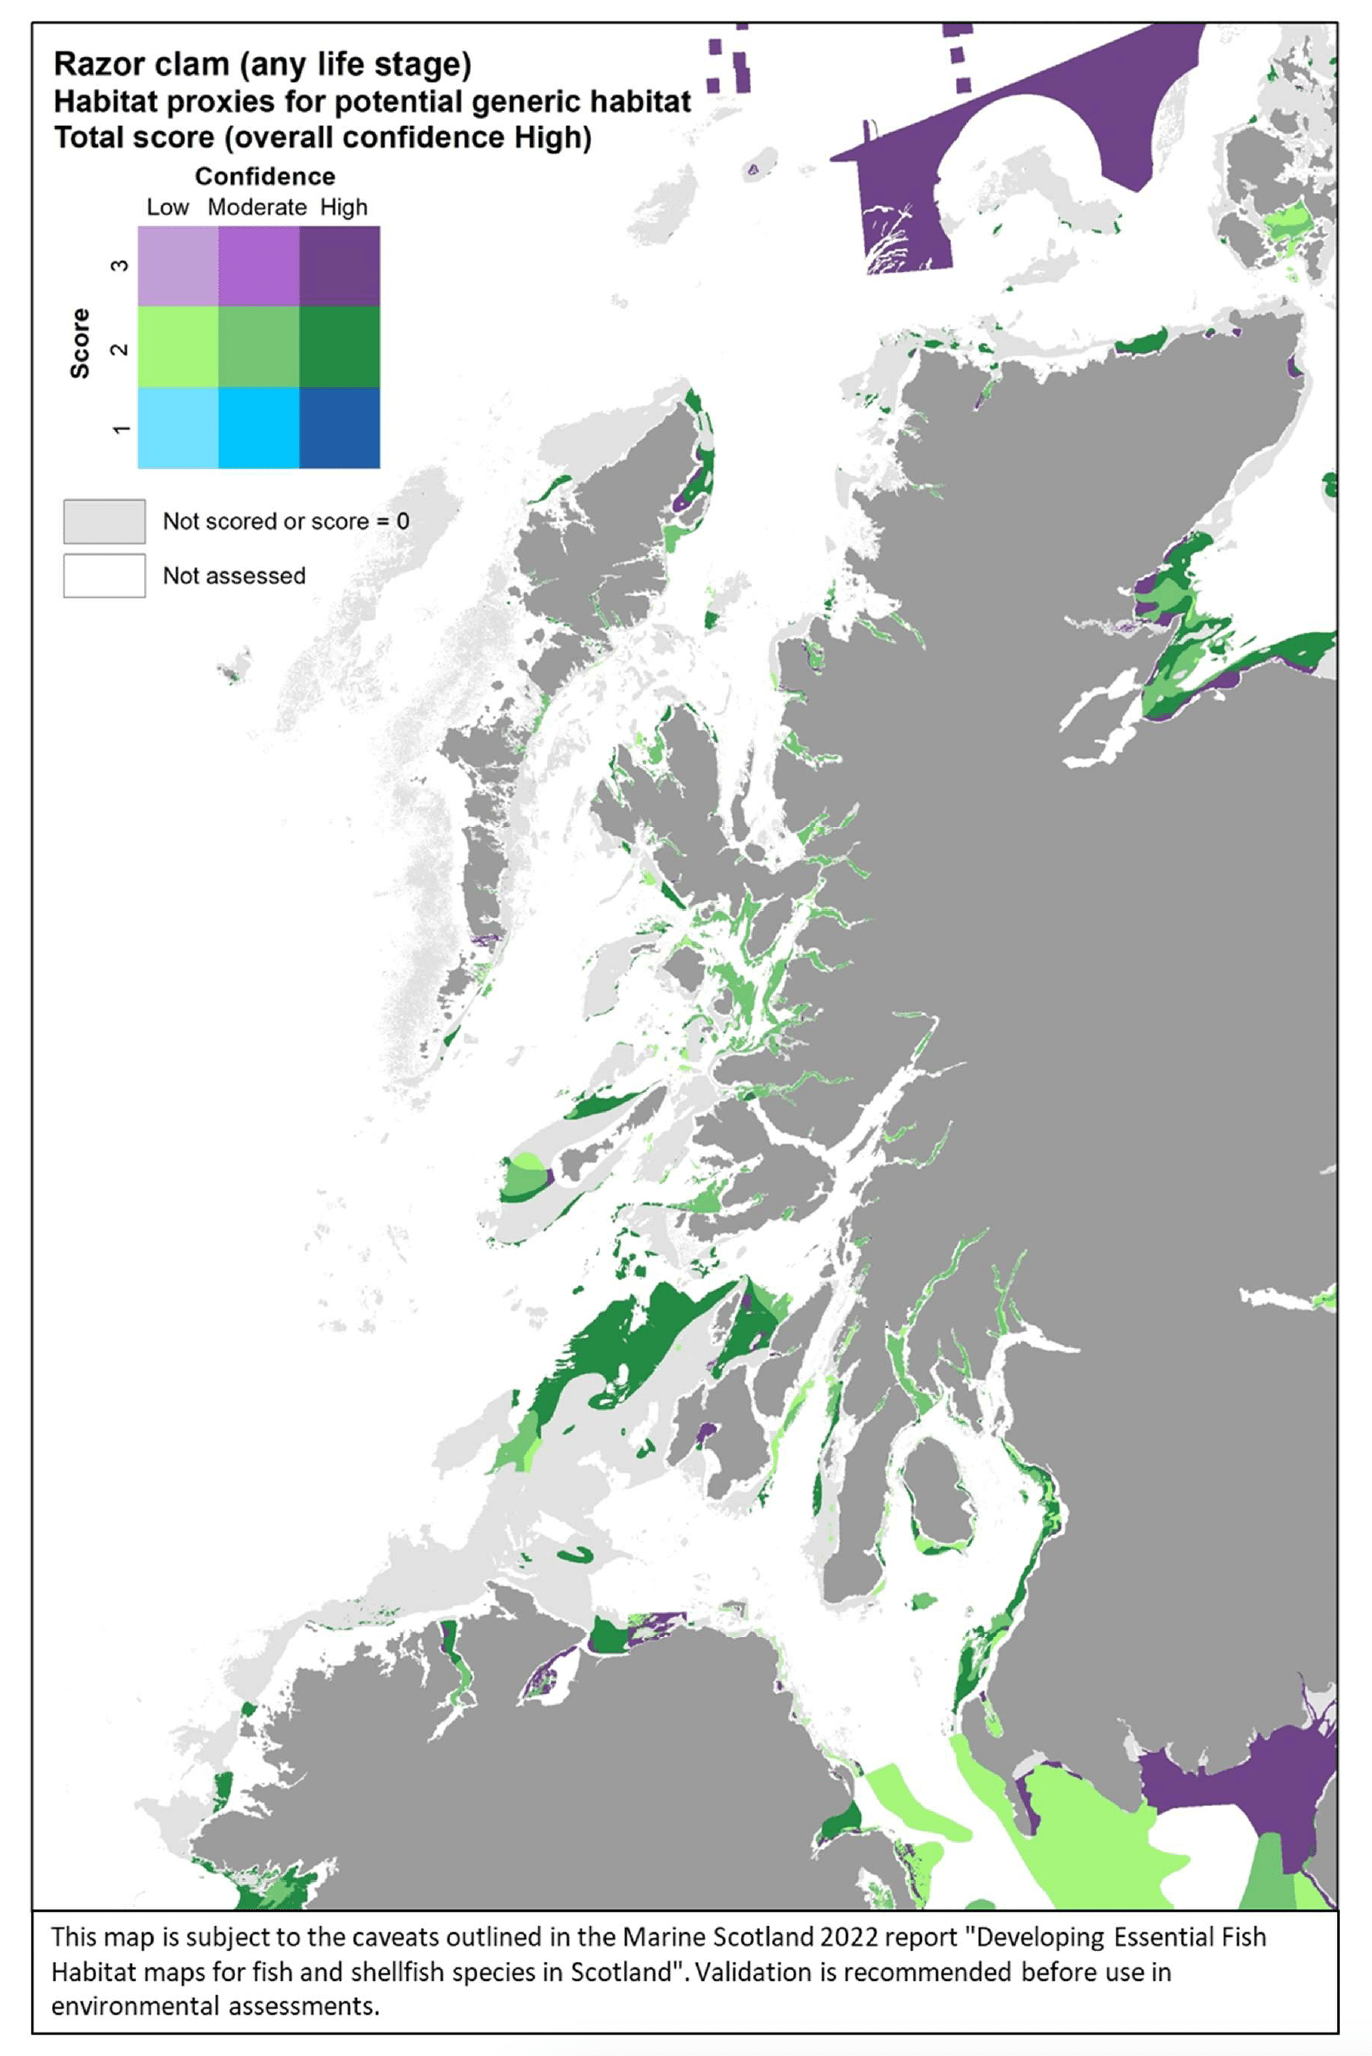
3.1.28 Common whelk, Buccinumundatum
Common whelk (Buccinum undatum Linnaeus 1758) is a gastropod mollusc of the endofauna, which lives buried in the sediment. It is commonly found subtidally (down to 1200 m depth) off all British coasts. Unlike other molluscs, all its life stages are benthic, with eggs being laid on the seabed (attached to rocks, stones, shells) and the larva developing inside the egg, from which it hatches as a fully formed benthic juvenile. It is expected that the same habitat performs multiple functions for different life stages (feeding, spawning, nursery) (Annex 1).
Common whelk was assessed by using the habitat proxy approach to identify habitats that may potentially be used by the species (for different functions). Nine publications were reviewed and provided detailed characterisation of the species' habitat requirements (see Annex 1). No feedback was received from stakeholders on the scoring of this species. A moderate confidence was assigned to the overall assessment of habitat proxies for common whelk.
Habitats scoring highly for suitability could not be identified and, at best, habitats with moderate suitability (score 2) were identified, generally with moderate confidence. These were sedimentary habitats in the sublittoral (infralittoral and circalittoral) zone, including a variety of grain sizes (mud, sand, coarse and mixed sediments) (Table 27). Further possible habitats, scored with low suitability and medium confidence (not shown in Table 27), were estuarine subtidal habitats, characterised by variable salinity and sublittoral coarse, sandy and mixed sediment substrata.
The distribution of the inshore habitat proxies for common whelk in the case study area is mapped in Figure 76. No survey data were available for the map validation, nor stakeholder feedback was received on this map following consultation.
| Common whelk – Habitat proxies for the species' habitat (Moderate confidence overall) |
|---|
| EUNIS Habitat type (score /confidence) |
| A5.1 Sublittoral coarse sediment (2/M) A5.13 Infralittoral coarse sediment (2/M) A5.14 Circalittoral coarse sediment (2/M) A5.2 Sublittoral sand (2/M) A5.23 Infralittoral fine sand (2/M) A5.24 Infralittoral muddy sand (2/M) A5.25 Circalittoral fine sand (2/M) A5.26 Circalittoral muddy sand (2/M) A5.4 Sublittoral mixed sediments (2/M) A5.43 Infralittoral mixed sediments (2/M) A5.44 Circalittoral mixed sediments (2/M) |
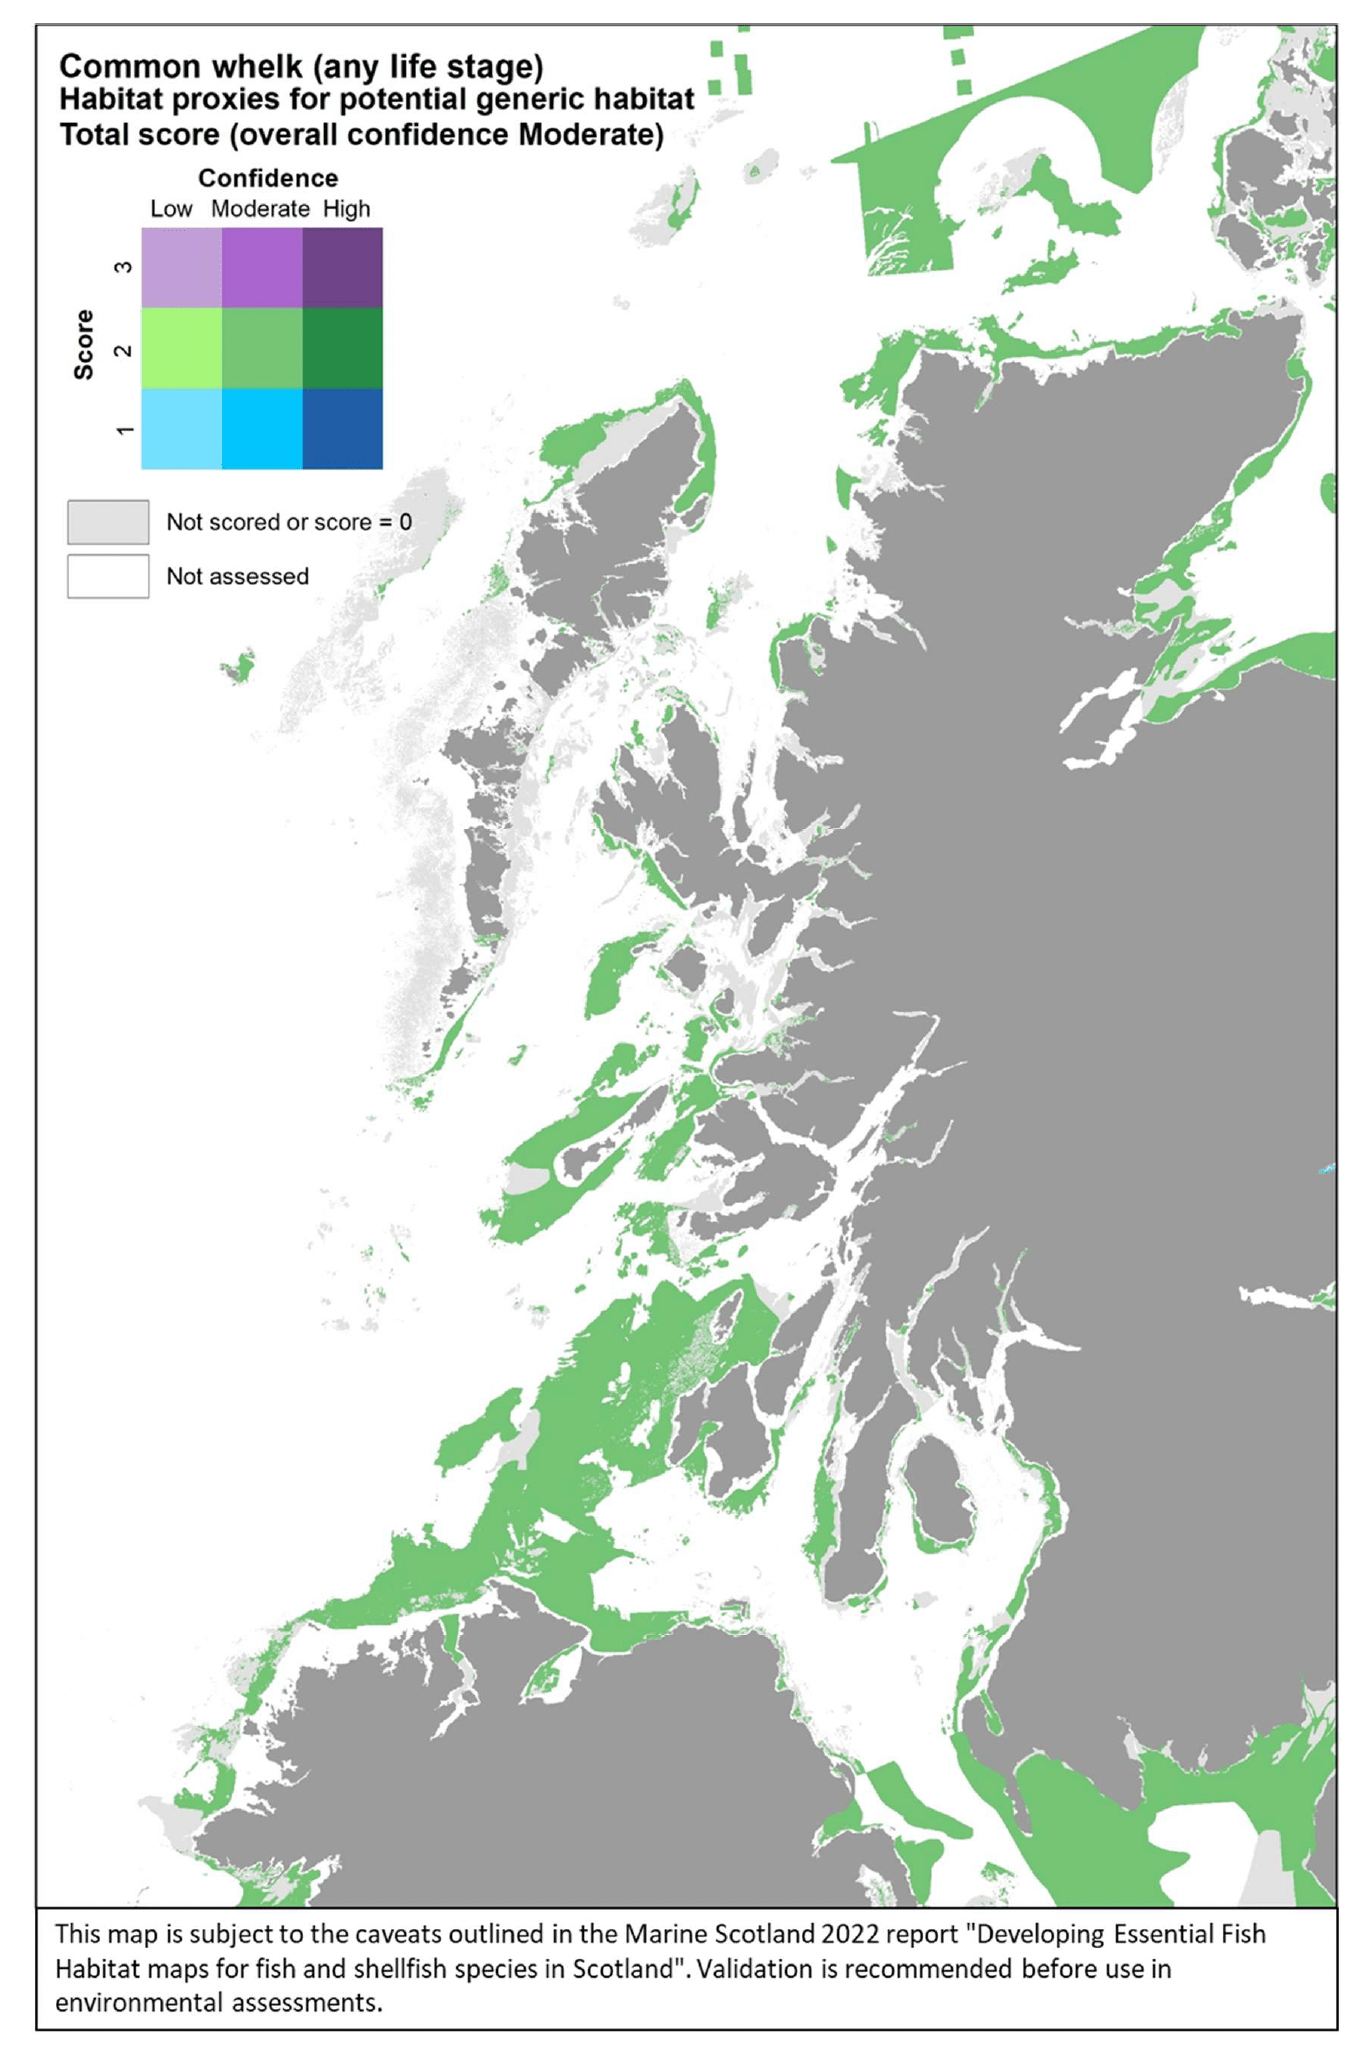
3.1.29 Dog whelk, Nucellalapillus
Dog whelk (Nucella lapillus, Linnaeus 1758) is a predominantly intertidal gastropod mollusc, common on all rocky coasts of Britain and Ireland. It is a mobile but sedentary species, with adults thought to move less than 30 m in their lifetime. As for common whelk, all its life stages are benthic, with eggs being laid on the seabed (attached to rocks) and the larva developing inside the egg, from which it hatches as a fully formed benthic juvenile. Although spawning aggregations have been observed, these are on the same rocky shores where the species lives, this habitat performing multiple functions for different life stages (feeding, spawning, nursery) (Annex 1).
Dog whelk were assessed by using the habitat proxy approach to identify habitats that may potentially be used by the species (for different functions). Four publications were reviewed and provided sufficiently detailed information to identify clearly and uniquely the habitat preference for the species (in terms of depth, substratum, salinity tolerance etc), likely aided by the highly specific habitat requirements of this species (see Annex 1). Despite no feedback being received from stakeholders on the scoring of this species, the available evidence was judged enough to assign a high confidence to the overall assessment of habitat proxies for dog whelk.
Rocky habitats in the intertidal zone, namely Fucoids in tide-swept conditions, Moderate energy littoral rock, and Barnacles and fucoids on moderately exposed shores, were identified as a highly suitable habitats for dog whelk, and with high confidence (Table 28). A variety of other rocky habitats in the littoral zone were identified as moderately or highly suitable (the latter being mussel and barnacle communities), albeit with a lower (moderate) confidence. Further possible habitats, scored with medium to low suitability and medium to low confidence (not shown in Table 28), included circalittoral rock (most likely restricted to the upper circalittoral zone, as dog whelk is primarily an intertidal species).
The distribution of the inshore habitat proxies for common whelk in the case study area is mapped in Figure 77. No survey data were available for the map validation, nor stakeholder feedback was received on this map following consultation.
| Dog whelk – Habitat proxies for the species' habitat (High confidence overall) |
|---|
| EUNIS Habitat type (score /confidence) |
| A1.1 Highenergylittoralrock(3/H) A1.11 Mussel and/or barnacle communities (3/M) A1.12 Robust fucoid and/or red seaweed communities (2/H) A1.15 Fucoids in tide-swept conditions (3/H) A1.2 Moderate energy littoral rock(3/H) A1.21Barnacles and fucoids on moderately exposed shores(3/H) A1.22 Mussels and fucoids on moderately exposed shores (2/H) A1.3 Low energy littoral rock (2/H) A1.31 Fucoids on sheltered marine shores (2/H) A1.4 Features of littoral rock (2/H) A1.44 Communities of littoral caves and overhangs (2/H) |
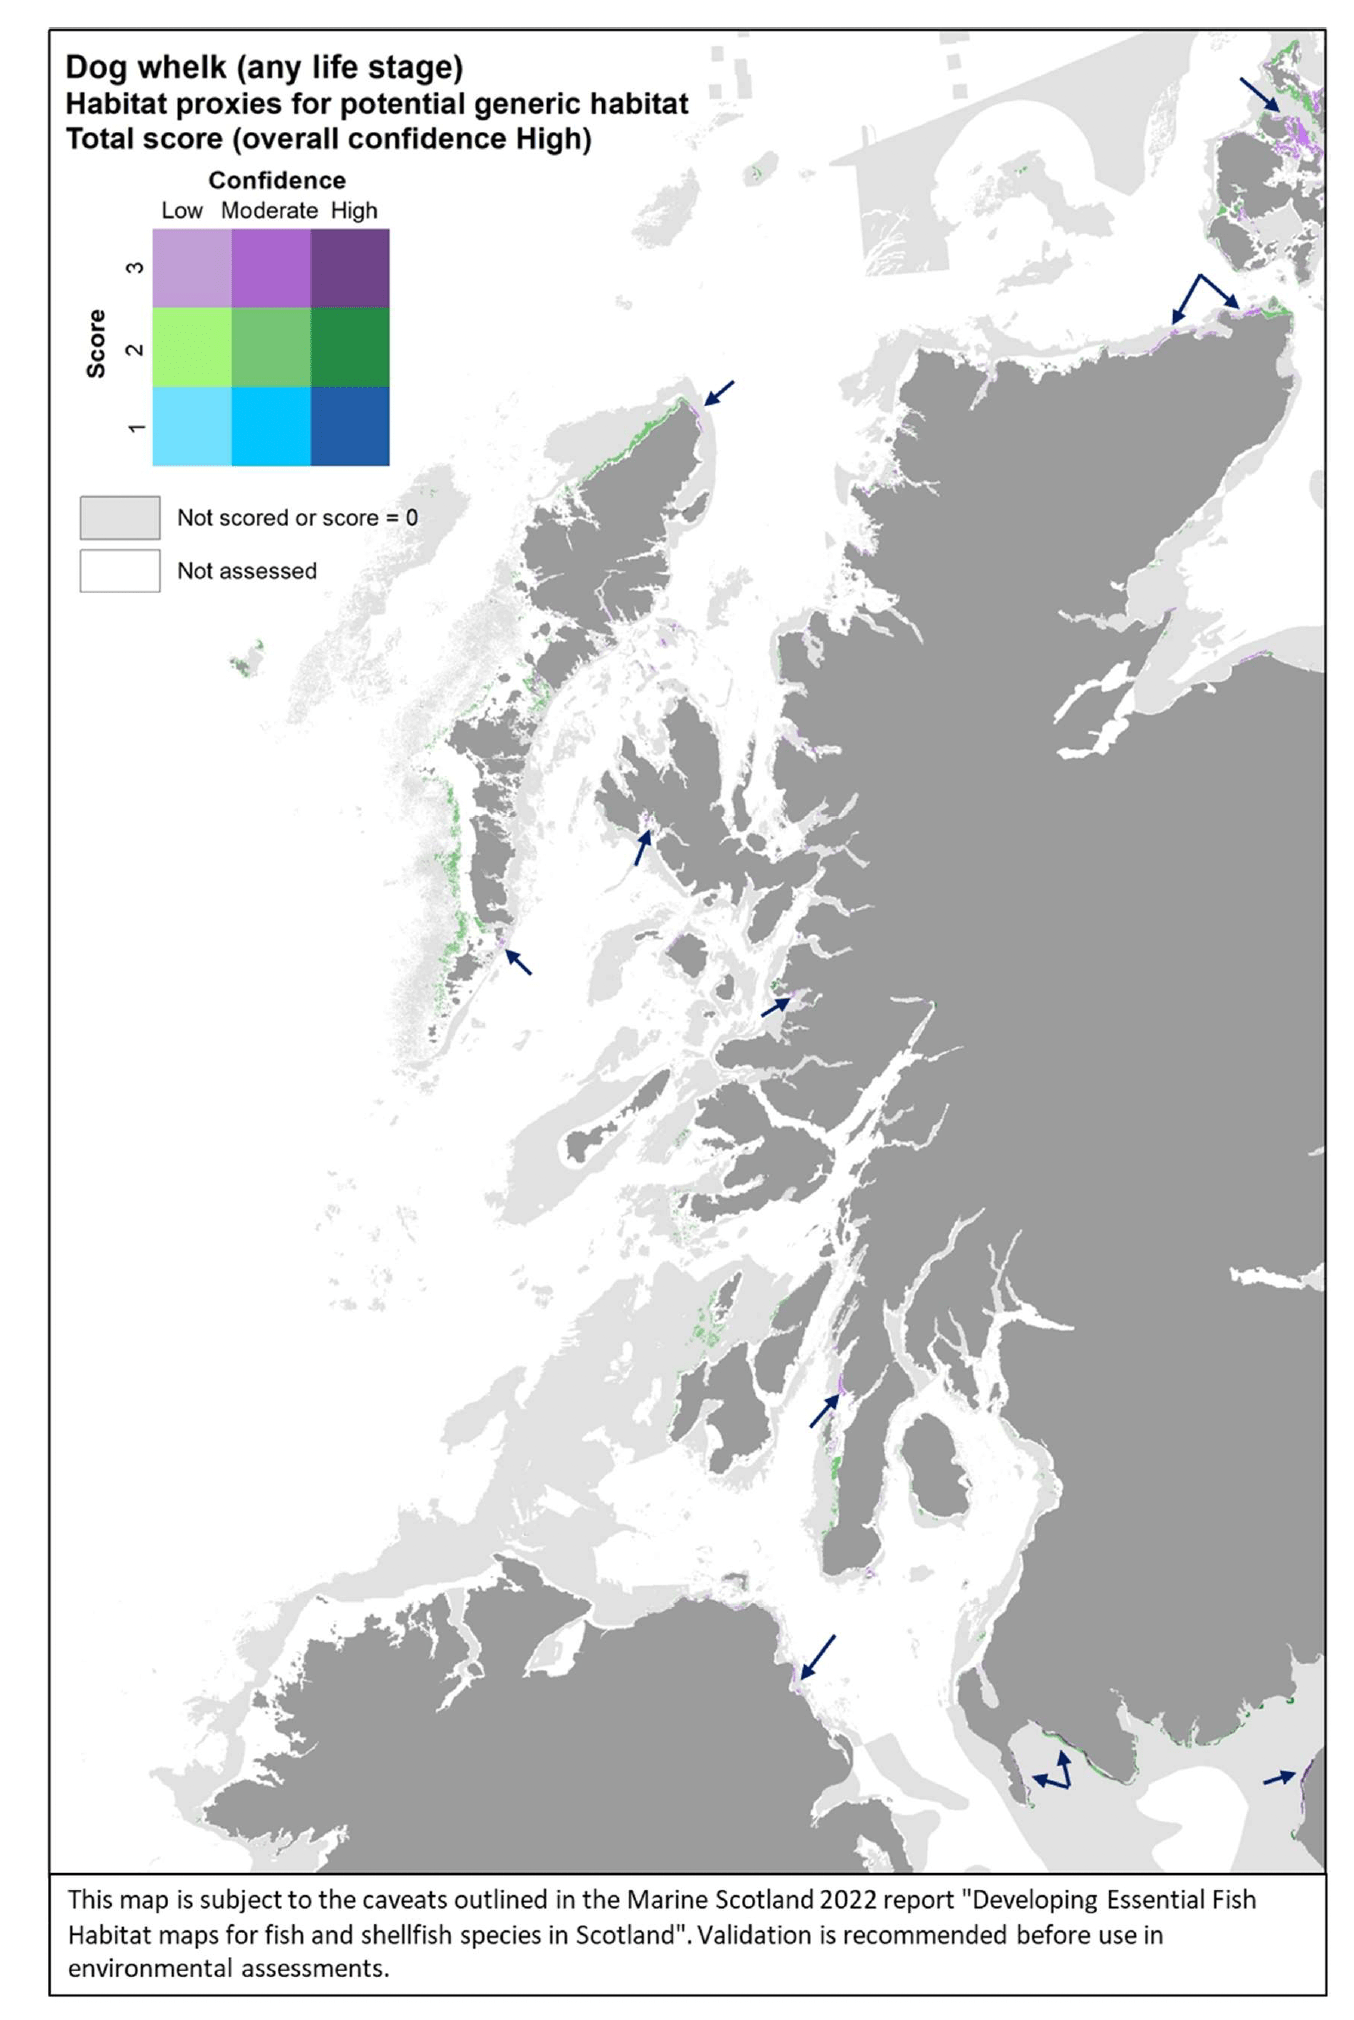
3.1.30 Summary tables
A summary of the main results of the assessments undertaken and mapped for the fish and shellfish species in this study is given in Table 29.
| Species (life stage, EFH function) | Assessment results |
|---|---|
| Lesser sandeel, Ammodytes marinus (Any life stage, Refugia) | EFH model (individuals of any size, Quarter 4 (December)): Overall confidence 61% (spatial coverage of valid predictions was restricted by limited geographical coverage hence environmental ranges of survey data used for calibrations (e.g. no surveys at >66 km from shore); this contributed to lower overall confidence). EFH predictors (decreasing importance): CUR, WAV, SSS, NPPV, SBT. Map validation via additional data & stakeholder feedback, with discrepancies highlighted in integrated spatial output (e.g. predicted absence on protected sandeel grounds in north east UK sandeel closure area, North-west Orkney NC MPA, Turbot Bank NC MPA, Mousa to Boddam NC MPA and North-east Lewis NC MPA). Discrepancies partly eliminated when model was predicted for individual years rather than for mean environmental scenario over 2010 - 2020 study period. |
| Small sandeel, Ammodytes tobianus (Any life stage, Refugia) | Habitat proxy assessment (overall confidence high): Most important EUNIS habitat types (Level 3) identified with score 3 and high confidence: A5.1 (sublittoral coarse sediment). Map validation via survey data only (no stakeholder feedback received), generally agreeing with habitat proxies where identified. |
| Norway lobster, Nephrops norvegicus (Any life stage, Refugia) | EFH model (individuals of any size, Quarters 1, 3 and 4): Overall confidence 49% (use of trawl catch data, rather than direct observations of burrow density from TV surveys, contributed to lower the overall confidence). EFH predictors (decreasing importance): Substr, Depth, SBT, WAV, SSS, MLT, NPPV, CUR. Map validation via additional data & stakeholder feedback, with discrepancies highlighted in integrated spatial output. Discrepancies likely due to density differences between stocks, accounted only in part during data modelling (model predictions confirmed in areas where burrows occur with high-density; discrepancies mainly in areas with lower-density of burrows, e.g. Fladen and western regions of the South Minch), and, in other areas, to inclusion of coarse sediment as suitable substrata by the model. |
| Herring, Clupea harengus (Spawning adult, Spawning) [Habitat proxy map] | Habitat proxy assessment (overall confidence high): Most important EUNIS habitat types (Level 3) identified with score 3 and high confidence: A2.1 (littoral coarse sediment), A5.1 (sublittoral coarse sediment), A5.5 (sublittoral macrophyte-dominated sediment), and A7.3 (completely mixed water column with full salinity). Map validation via stakeholder feedback only (based on known current and historic herring spawning grounds identified in Frost and Diele 2022), with discrepancies highlighted in integrated spatial output (e.g. observed spawning in the Firth of Clyde and Wester Ross area not captured in the habitat proxy map). |
| Plaice, Pleuronectes platessa (Juvenile, Nursery) | EFH model (0-group, 4 - 12 cm length, Quarter 3): Overall confidence 69%. EFH predictors (decreasing importance): MLT, Dist, Depth, NPPV, Substr, SSS, CUR. Map validation via additional data & stakeholder feedback, with discrepancies highlighted in integrated spatial output (model predictions of settlement habitats of juvenile plaice confirmed in Moray Firth, Firth of Forth, Firth of Clyde, but gaps in the spatial coverage of the most inshore areas (expected to be most important as nursery grounds) due to data limitations). Habitat proxy assessment (overall confidence high): Most important EUNIS habitat types (Level 3) identified with score 3 and high confidence: A5.2 (sublittoral sand). Map validation via survey data only (no stakeholder feedback received), generally agreeing with habitat proxies where identified (e.g. eastern margin of the Firth of Clyde, areas west of the Kintyre peninsula and off Jura, east and west of the Small Isles). |
| Lemon sole, Microstomus kitt (Juvenile, Nursery) | EFH model (0-group, 3 - 15 cm length, Quarter 3): Overall confidence 58%. EFH predictors (decreasing importance): Dist, CUR, Depth, SBT, MLT, WAV, Slope, SSS. Map validation via additional data & stakeholder feedback, with discrepancies highlighted in integrated spatial output (model predictions confirmed on Dogger Bank, but absence predicted where juvenile aggregations were observed southwest of the Dogger Bank, in central North Sea and more inshore areas to the south, where there are also spatial gaps in the model maps due to data limitations). |
| Common sole, Solea solea (Juvenile, Nursery) | EFH model (0- and 1-groups, 3 - 25 cm length, Quarter 3): Overall confidence 57%. EFH predictors (decreasing importance): Depth, MLT, SBT, WAV, NPPV, SSS, Slope, CUR. Map validation via stakeholder feedback only, with discrepancies highlighted in integrated spatial output (model predictions confirmed on inshore nurseries along the southeast, south and southwest coast of the UK, but absence predicted in areas of juvenile aggregation within Liverpool Bay; there are also spatial gaps in model maps in most inshore areas due to data limitations, while possible nurseries are identified in Scottish coastal waters, despite they are not currently used by the species, which has a more southern distribution in UK waters). Habitat proxy assessment (overall confidence moderate): Most important EUNIS habitat types (Level 3) identified with score 3 and high confidence: A5.2 (sublittoral sand), A5.3 (sublittoral mud) (also A2.2 and A2.3 (littoral sand and muddy sand, and littoral mud, respectively), but moderate confidence). Map validation via stakeholder feedback only, with discrepancies highlighted in integrated spatial output (habitat proxies identified along the west coast of Scotland are not currently used by the species). |
| Anglerfish, Lophius piscatorius (Juvenile, Nursery) | EFH model (0- and 1-groups, 12 - 28 cm length, Quarter 2): Overall confidence 65% (the highest across species assessed, despite confidence being lowered by the fact that trawl surveys considered did not target specifically juveniles, and other data (e.g. from scallop dredge surveys) could be better suited). EFH predictors (decreasing importance): SBT, MLT, SSS, CUR. Map validation via additional data & stakeholder feedback, with discrepancies highlighted in integrated spatial output (important anglerfish juvenile grounds in the western English Channel and in most of the Celtic Seas not identified by the model; poor predictions in Rockall area; spatial gaps in most inshore areas due to data limitations). Discrepancies partly eliminated when model was predicted for individual years rather than for mean environmental scenario over 2010 - 2020 study period. |
| Whiting, Merlangius merlangus ('Running' adult, Spawning) | EFH model (adults at spawning or spent stages, Quarter 1): Overall confidence 36%. EFH predictors (decreasing importance): Depth, CUR, SSS, Slope, Dist, SBT, Substr. Map validation via stakeholder feedback only, with discrepancies highlighted in integrated spatial output (model predictions confirmed in the central and northern North Sea, north coast of Scotland and offshore areas to the west of Scotland, but spawning aggregations in southern North Sea and spawning grounds in the English Channel and on the Trevose ground poorly predicted by the model). |
| Whiting, Merlangius merlangus (Juvenile, Nursery) | EFH model (0-group, 12 - 16 cm length in Quarter 3, up to 20 cm length in Quarter 4): Overall confidence 41%. EFH predictors (decreasing importance): Depth, Dist, WAV, Substr, Slope. Map validation via additional data & stakeholder feedback, with discrepancies highlighted in integrated spatial output (model predictions confirmed by juvenile whiting distribution along the UK coast and in the northern North Sea, but with spatial gaps in most inshore areas (due to data limitations) which are expected to be most important as nursery grounds for the species). Habitat proxy assessment (overall confidence moderate): Most important EUNIS habitat types (Level 3) identified with score 3 and high confidence: A5.5 (Sublittoral macrophyte-dominated sediment) (also A2.6 (littoral sediments dominated by aquatic angiosperms), A5.2 (sublittoral sand) and A5.4 (circalittoral mixed sediments), but moderate confidence). Map validation via survey data only (no stakeholder feedback received), generally agreeing with habitat proxies where identified (whiting juvenile habitat widely distributed in inshore waters, with higher importance of coastal habitat closer to shore, bays and sea lochs, e.g. Loch Dunvegan, west of Skye, and Loch Carron, to the east). |
| Cod, Gadus morhua ('Running' adult, Spawning) | EFH model (adults at spawning or spent stages, Quarter 1): Overall confidence 41%. EFH predictors (decreasing importance): Depth, CUR, SSS, Dist, SBT, NPPV. Map validation via stakeholder feedback only, with discrepancies highlighted in integrated spatial output (model predictions confirmed in the northern North Sea and off the north coast of Scotland, but spawning aggregations observed in other areas of the North Sea, and particularly to the south, and cod spawning grounds in the English Channel and on the Trevose ground, off the north coast of Cornwall, poorly predicted by the model). |
| Cod, Gadus morhua (Juvenile, Nursery) | Habitat proxy assessment (overall confidence moderate): Most important EUNIS habitat types (Level 3) identified with score 3 and high confidence: A2.6 (littoral sediments dominated by aquatic angiosperms) and A5.5 (sublittoral macrophyte-dominated sediment) (also A5.6 (sublittoral biogenic reefs) and 3.1 (Atlantic and Mediterranean high energy infralittoral rock), but moderate confidence). Map validation via survey data only (no stakeholder feedback received), generally agreeing with habitat proxies where identified (habitat proxies confirmed in the south of the study area, in the Firth of Clyde, and in inner reaches (e.g. Loch Long, Loch Fyne), albeit with some spatial gaps in these inner areas due to lack of coverage by the EUNIS habitat data layers). |
| Haddock, Melanogrammus aeglefinus ('Running' adult, Spawning) | EFH model (adults at spawning or spent stages, Quarter 1): Overall confidence 52%. EFH predictors (decreasing importance): Depth, Dist, WAV, CUR, SSS, NPPV. Map validation via stakeholder feedback only, generally agreeing with model predictions (spawning EFH in the central and northern North Sea and off the north coast of Scotland, and over most of the Celtic Seas). |
| Norway pout, Trisopterus esmarkii ('Running' adult, Spawning) | EFH model (adults at spawning or spent stages, Quarter 1): Overall confidence 45%. EFH predictors (decreasing importance): Depth, SBT, Substr, Dist, Slope, NPPV. Map validation via stakeholder feedback only, with discrepancies highlighted in integrated spatial output (model predictions confirmed in northern North Sea and off the north and west coast of Scotland, but aggregations in central North Sea are poorly predicted and spawning areas in the Celtic Seas are more widespread than predicted). |
| Blue whiting, Micromesistius poutassou (Juvenile, Nursery) | EFH model (0-group, 5 - 19 cm length, Quarters 3 and 4): Overall confidence 60%. EFH predictors (decreasing importance): Depth, WAV, CUR, Slope, SSS, MLT, Dist, NPPV. Map validation via additional data & stakeholder feedback, with discrepancies highlighted in integrated spatial output (model predictions of aggregations confirmed along the continental shelf edge west and north of the British Isles, with overlapping with known spawning migration routes in the northern Atlantic, but aggregations observed in areas further inshore along the west coast of Scotland poorly predicted, also because of spatial gaps inshore due to data limitations; distribution of juveniles in the area northeast of Shetland also possibly less wide than predicted). |
| Hake, Merluccius merluccius (Juvenile, Nursery) | EFH model (0-group, 4 - 19 cm length, Quarters 3 and 4): Overall confidence 41%. EFH predictors (decreasing importance): CUR, Depth, WAV, Slope, Substr, NPPV, Dist, SBT, MLT. Map validation via additional data & stakeholder feedback, with discrepancies highlighted in integrated spatial output (juvenile aggregations within the Hake Box and Celtic Seas likely more widespread than what predicted; the same applies to aggregations predicted in the northern North Sea and South Minch). |
| Saithe, Pollachius virens (Juvenile, Nursery) | Habitat proxy assessment (overall confidence low): Most important EUNIS habitat types (Level 3) identified with score 3 and high confidence: A1.1 , A1.2 and A1.3 (high, moderate and low energy littoral rock, respectively) (also A3.1 and 3.2 (Atlantic and Mediterranean high and moderate energy infralittoral rock, respectively), but moderate confidence). Map validation via survey data only (no stakeholder feedback received), generally agreeing with habitat proxies where identified (e.g. in the Clyde, north of Islay, west of Mull, with habitat proxies also identified on the littoral rocky fringes along the Scottish coastline in the northern Irish Sea). |
| Sprat, Sprattus sprattus (Juvenile, Nursery) | EFH model (0-group, 2.5 - 9 cm length in Quarter 3, up to 9.5 cm in Quarter 4): Overall confidence 51%. EFH predictors (decreasing importance): Depth, SSS, MLT, SST, WAV, Dist, CUR, Substr, Slope. Map validation via additional data & stakeholder feedback, with discrepancies highlighted in integrated spatial output (model predictions confirm the predominant distribution of sprat nursery EFH in inshore coastal areas around the UK, and also in known specific nursery areas protected by seasonal management measures (Firth of Forth and Moray Firth); juvenile aggregations in inshore areas along the south-west coast of Ireland, in the Thames, English Channel, Bristol Channel, and Severn estuary poorly predicted, also because of spatial gaps in more inshore areas due to data limitations). Habitat proxy assessment (overall confidence moderate): Most important EUNIS habitat types (Level 3) identified with score 3 and high confidence: A7.3 and A7.8 (completely mixed and unstratified water column with full salinity, respectively). Map validation via survey data only (no stakeholder feedback received), generally agreeing with habitat proxies where identified (e.g. in the Firth of Clyde, in areas close to the shore along the west coast (Inner Hebrides), northwest of Coll and northeast of Lewis). |
| Mackerel, Scomber scombrus (Juvenile, Nursery) | EFH model (0-group, 12 - 22 cm length in Quarter 4, up to 24 cm in Quarter 1): Overall confidence 29% (the lowest across species assessed, mainly due to poor model performance combined with the lower efficiency of bottom trawl surveys in sampling pelagic juvenile mackerel). EFH predictors (decreasing importance): MLT, CUR, WAV, Depth, Dist, SST, Slope, NPPV, SSS, Substr. Map validation via additional data & stakeholder feedback, with discrepancies highlighted in integrated spatial output (model predictions of aggregations confirmed off the west coast of Scotland and along the continental shelf edge north of Scotland; less accurate predictions in the norther North Sea and in the Celtic Seas, e.g. in the South West Mackerel Box). |
| Mackerel, Scomber scombrus (Egg, Spawning) | EFH model (eggs at early development stage (EG1), Quarters 2 and 3): Overall confidence 32% (mainly due to poor model performance). EFH predictors (decreasing importance): Depth, WAV, Dist, SSS, Substr, NPPV. Map validation via stakeholder feedback only, generally agreeing with model predictions (potential spawning EFH mostly along continental shelf edge to the west and north of the British Isles). |
| Thornback ray, Raja clavata (Spawning adult/Egg, Spawning) | Habitat proxy assessment (overall confidence low): Most important EUNIS habitat types (Level 3) identified with score 2 and low confidence: A5.1 and A5.2 (sublittoral coarse sediment and sand, respectively) . Map validation via survey data only (no stakeholder feedback received), generally agreeing with habitat proxies where identified (e.g. suitable habitat patches in the northern Minch and in the Clyde), although sparse occurrence of the species in the survey catches and limited spatial coverage of the surveys did not allow validation of all areas predicted by habitat proxies (e.g. west of Islay and along the coast of Northern Ireland, west of Tiree and in the North Atlantic west of Orkney). |
| Spotted ray, Raja montagui (Spawning adult/Egg, Spawning) | Habitat proxy assessment (overall confidence low): Most important EUNIS habitat types (Level 3) identified with score 2 and low confidence: A5.2 (sublittoral sand). Map validation via survey data only (no stakeholder feedback received), generally agreeing with habitat proxies where identified (e.g. north and west of Islay, west of Coll, south of Tiree, in the northern Minch, and at the entrance of the Clyde). |
| Spurdog, Squalus acanthias (Neonate juvenile, Spawning) | Habitat proxy assessment (overall confidence low): Most important EUNIS habitat types (Level 3) identified with score 2 and low confidence: A5.3 (sublittoral mud). Map validation via survey data only (no stakeholder feedback received), generally agreeing with habitat proxies where identified (e.g. Loch Linnhe and the approaching areas south of Mull, south of Coull and upstream of Loch Linnhe, into Loch Eil). |
| Long finned squid, Loligo forbesii (Juvenile, Nursery) | EFH model (immature/recruits, 1 - 15 cm length, Quarters 3 and 4): Overall confidence 42%. EFH predictors (decreasing importance): Depth, WAV, Dist, SBT, SBT, CUR, Substr, SSS, Slope, NPPV. Map validation via additional data & stakeholder feedback, with discrepancies highlighted in integrated spatial output (model prediction of aggregations confirmed in Rockall area, southern North Sea and off the south Irish coast, and in front of the Firth of Forth, but aggregations off the Moray Firth, north of Scotland and Ireland, and generally in areas closer to the shore were poorly predicted, also because of spatial gaps in most inshore areas due to data limitations). |
| European lobster, Homarus gammarus (Juvenile, Nursery) Brown crab, Cancer pagurus (Juvenile, Nursery) | Habitat proxy assessment (overall confidence low): Most important EUNIS habitat types (Level 3) identified with score 2 and low confidence: A3.1, A3.2 and A3.3 (Atlantic and Mediterranean high, moderate and low energy infralittoral rock, respectively), and A5.1 and A5.3 (sublittoral coarse sediment and mud, respectively). No map validation (no survey data, nor stakeholder feedback received). Habitat proxy assessment (overall confidence low-moderate): Most important EUNIS habitat types (Level 3) identified with score 3 and high confidence: A1.4 (features of littoral rock, including rockpools, caves and overhangs) (also A4.2 (Atlantic & Mediterranean moderate energy circalittoral rock), but score 2 and moderate confidence). No map validation (no survey data, nor stakeholder feedback received). |
| Velvet crab, Necora puber (Any life stage, generic species' habitat) | Habitat proxy assessment (overall confidence moderate): Most important EUNIS habitat types (Level 3) identified with score 3 and moderate confidence: A3.2 (Atlantic and Mediterranean moderate energy infralittoral rock) (also A1.2 (Moderate energy littoral rock), but score 2 and moderate confidence). No map validation (no survey data, nor stakeholder feedback received). Most important habitat proxies occurred as small habitat patches along the coastal fringe. |
| Common cockle, Cerastoderma edule (Any life stage, generic species' habitat) | Habitat proxy assessment (overall confidence high): Most important EUNIS habitat types (Level 3) identified with score 3 and high confidence: A2.2 and A2.4 (littoral sand and muddy sand, and littoral mixed sediments, respectively). No map validation (no survey data, nor stakeholder feedback received). Most important habitat proxies occurred as small habitat patches, mainly in the intertidal zone in more internal areas. |
| Dog cockle, Glycymeris glycymeris (Any life stage, generic species' habitat) | Habitat proxy assessment (overall confidence moderate-high): Most important EUNIS habitat types (Level 3) identified with score 3 and high confidence: A5.1 and A5.4 (sublittoral coarse sediment and sublittoral mixed sediments, respectively). No map validation (no survey data, nor stakeholder feedback received). |
| Razor clam, Ensis ensis (Any life stage, generic species' habitat) | Habitat proxy assessment (overall confidence high): Most important EUNIS habitat types (Level 3) identified with score 3 and high confidence: A5.2 (sublittoral sand). No map validation (no survey data, nor stakeholder feedback received). |
| Common whelk, Buccinum undatum (Any life stage, generic species' habitat) | Habitat proxy assessment (overall confidence moderate): Most important EUNIS habitat types (Level 3) identified with score 2 and moderate confidence: A5.1, A5.2 and A5.4 (sublittoral coarse sediment, sand, and mixed sediments, respectively). No map validation (no survey data, nor stakeholder feedback received). |
| Dog whelk, Nucella lapillus (Any life stage, generic species' habitat) | Habitat proxy assessment (overall confidence high): Most important EUNIS habitat types (Level 3) identified with score 3 and high confidence: A1.1 and A1.2 (high and moderate energy littoral rock) (and A1.3 (low energy littoral rock) and A1.4 (features of littoral rock), but with score 2 and high confidence). No map validation (no survey data, nor stakeholder feedback received). Most important habitat proxies occurred as small habitat patches along the coastal fringe. |
Table footnotes: Codes in the table for the EFH model environmental predictors are: Depth, water depth; SBT, sea bottom temperature; SST, sea surface temperature; NPPV, net primary production; SSS, sea surface salinity; MLT, mixing layer thickness; Dist, distance from coast; CUR, current energy at the seabed; WAV, wave energy at the seabed; Slope; seabed slope; Substr, substratum type.
3.2 Implications of climate change
The predictions for the baseline environmental scenario (year 2015) and the scenario accounting for environmental change (based on changes, compared to the baseline, in seasonal SBT and/or Depth of magnitude consistent with climate change predictions) are shown for the selected models in Figure 78 to Figure 81.
The comparison between the baseline map and the one accounting for environmental change shows that major changes occur in the distribution of habitats where lesser sandeel and juvenile anglerfish are expected to aggregate (potentially indicative of their refuge and nursery grounds, respectively), whereas the spatial changes for Nephrops and juvenile plaice appear to be marginal.
The predicted change for lesser sandeel, following a change in winter sea bed temperature (SBT), shows a notable contraction of the areas where environmental conditions reflect those of sandeel grounds where the species was found in the surveys (2008-2020) used to calibrate the model (Figure 78). In fact, many of the areas where sandeel aggregations were predicted to occur with high probability under the baseline scenario around the coast of Scotland (including known sandeel grounds off the Firth of Forth, on Turbot Bank, or northwest of Orkney) appear to show environmental conditions that are no longer reflecting those of surveyed sandeel grounds under the SBT change scenario, and therefore are excluded from the model prediction (as grey areas). As a result, potentially suitable habitats for sandeel appear to be "squeezed" to small patches closer to the coast under the scenario of SBT change.
The predicted change for anglerfish, following a change in spring sea bed temperature, also indicates a contraction of the areas potentially suitable for aggregating juveniles of the species, with their disappearance from Rockall and along the coastal shelf margin to the west and north of Scotland (Figure 79). In turn, an expansion of areas potentially suitable as anglerfish nursery grounds is predicted in more inshore areas in the Minch and along the north coast of Scotland, and, to the east, in the northern North Sea and east of Shetland, albeit with lower (<0.75) probability of occurrence. Very small pockets of highly suitable habitats appear to remain only in few areas along the coastal shelf margin north and west of Shetland (Figure 79).
For Nephrops, the change in mean sea bed temperature across the summer, autumn and winter seasons, combined with the depth change inshore, only appear to lead to a marginal expansion of the areas potentially suitable for aggregations of the species, specifically resulting in additional small patches of habitat off the Moray Firth to become highly suitable under the changed conditions (Figure 80). A similar result is observed for juvenile plaice habitats in the same inshore area, as effected by depth change (Figure 81).
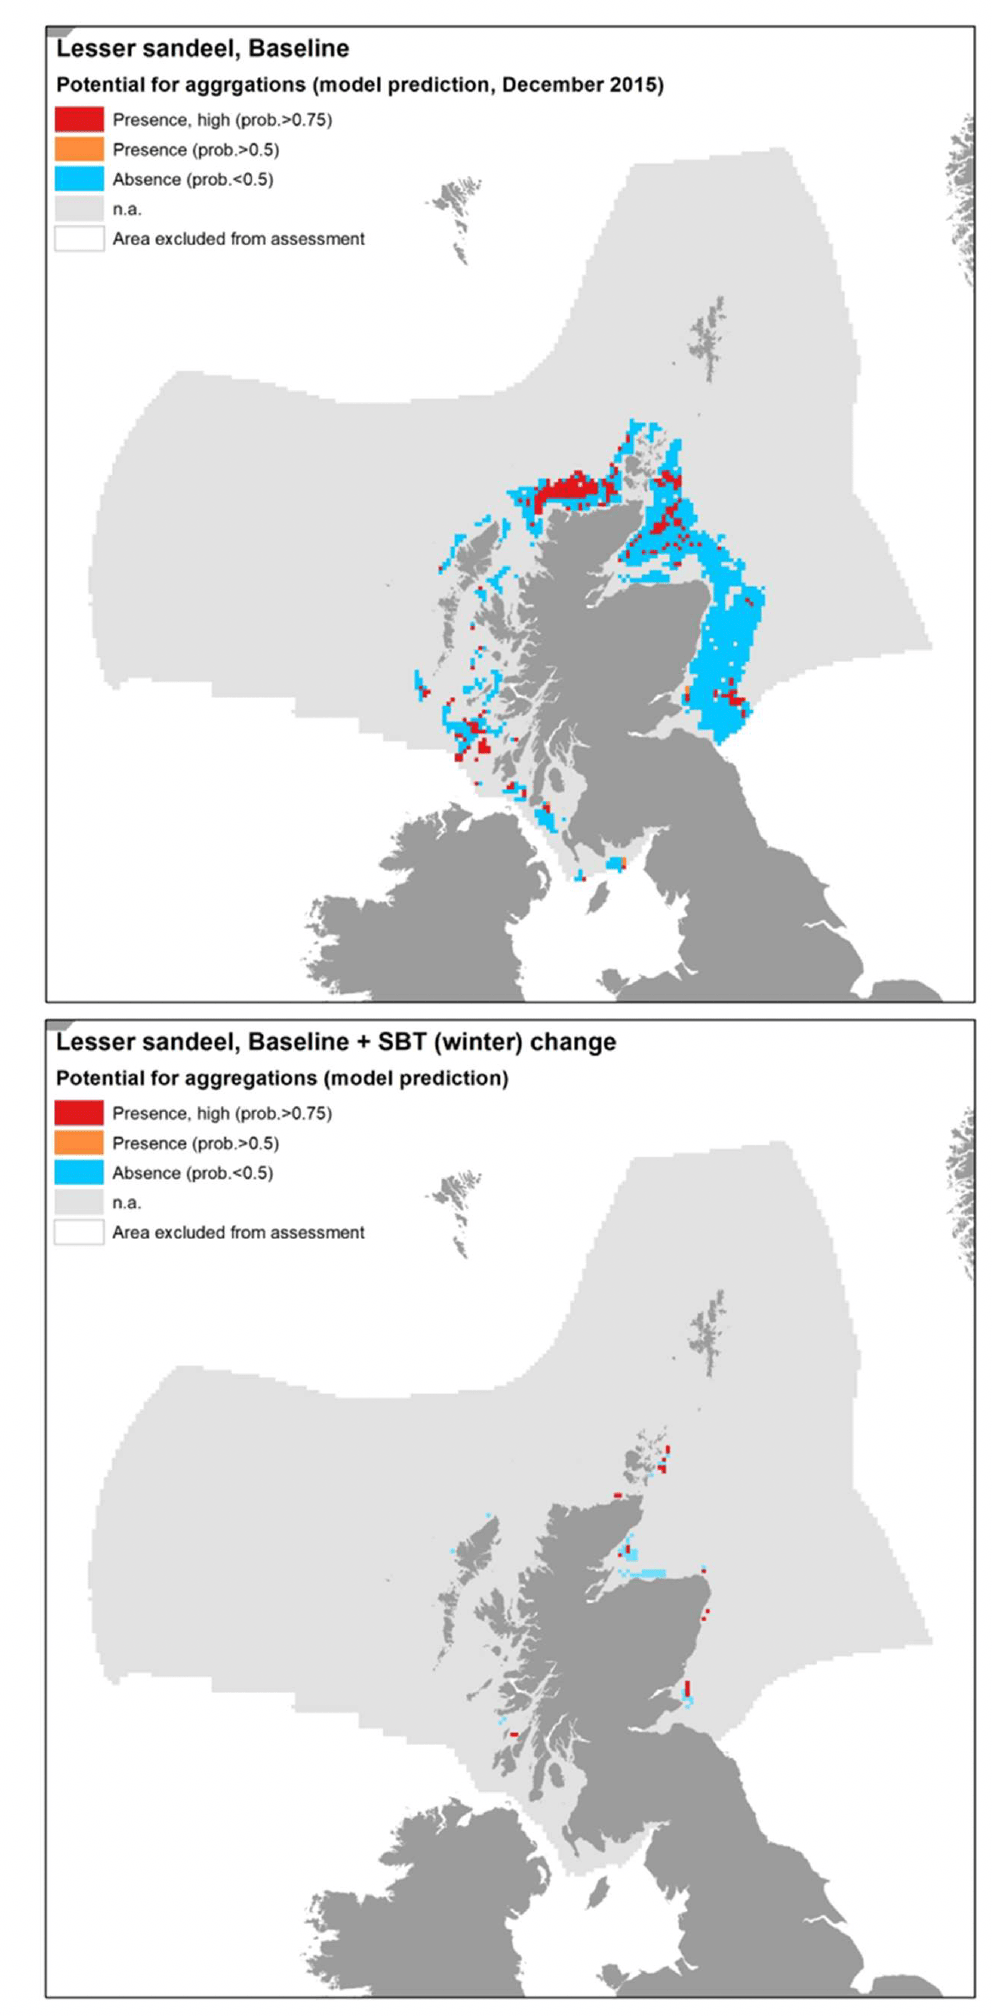
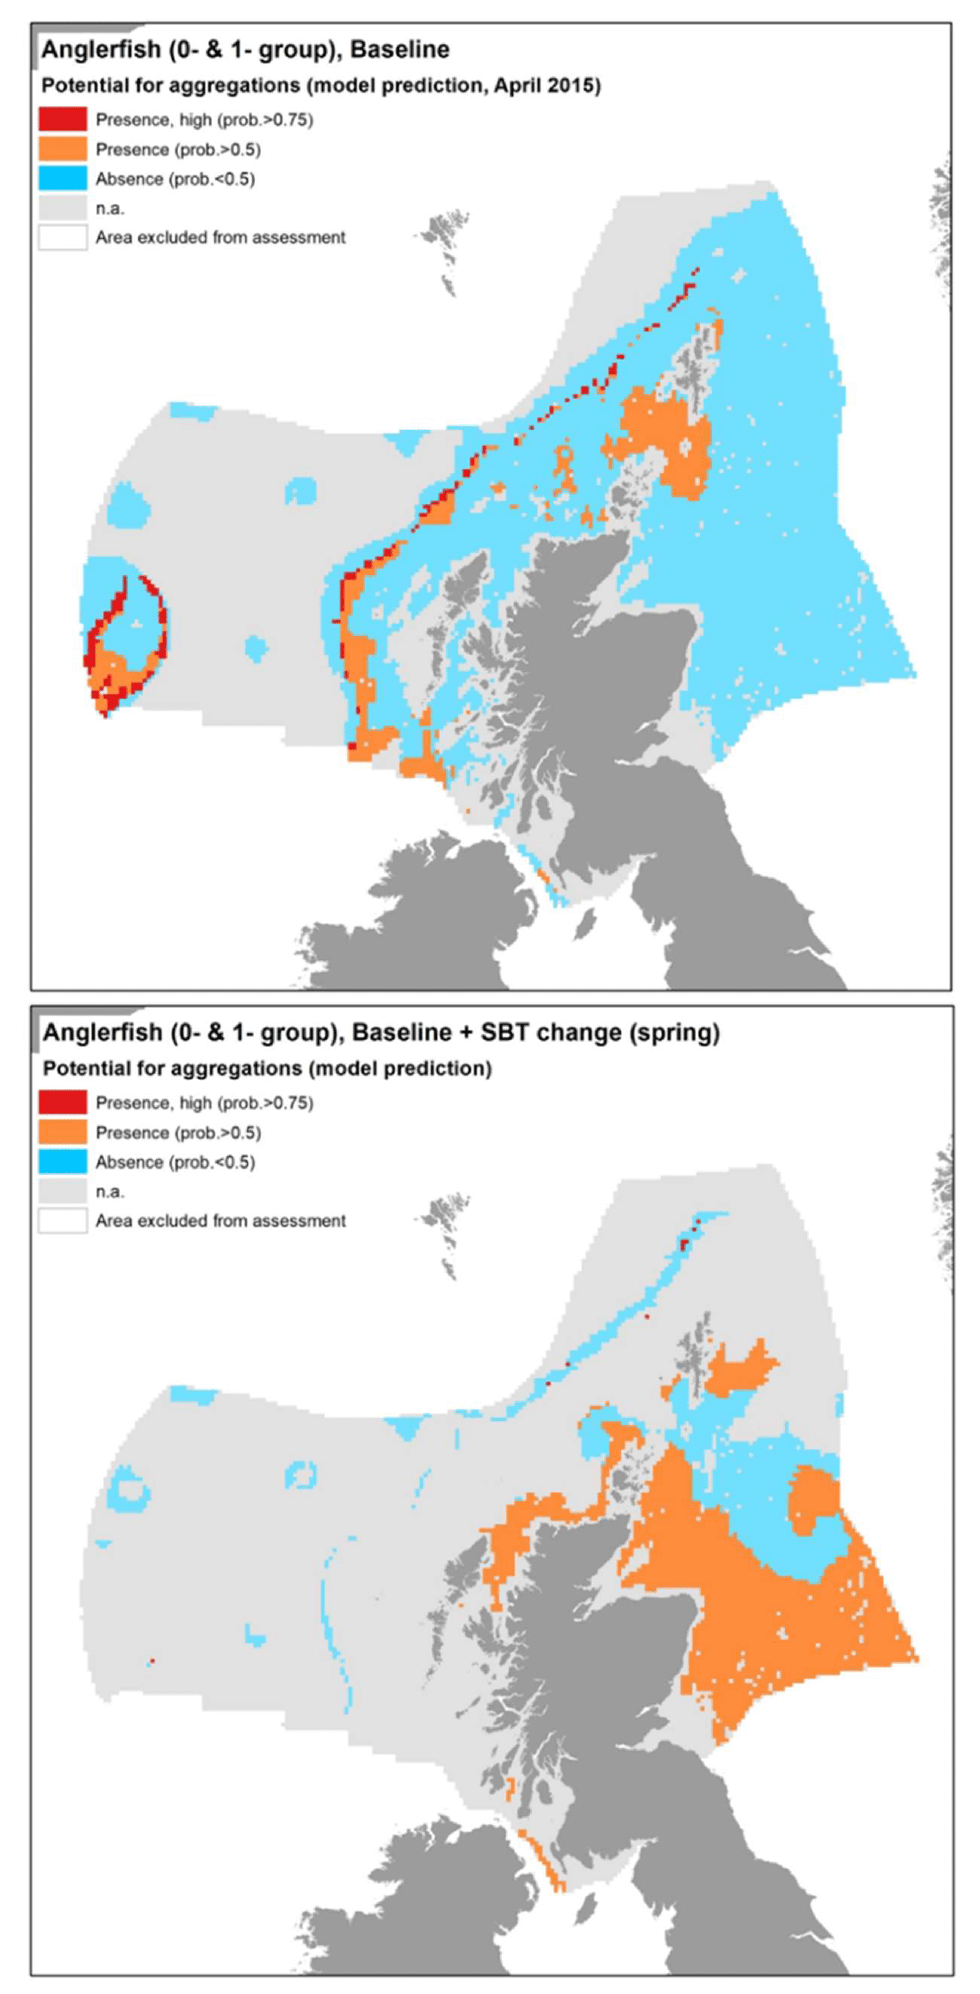
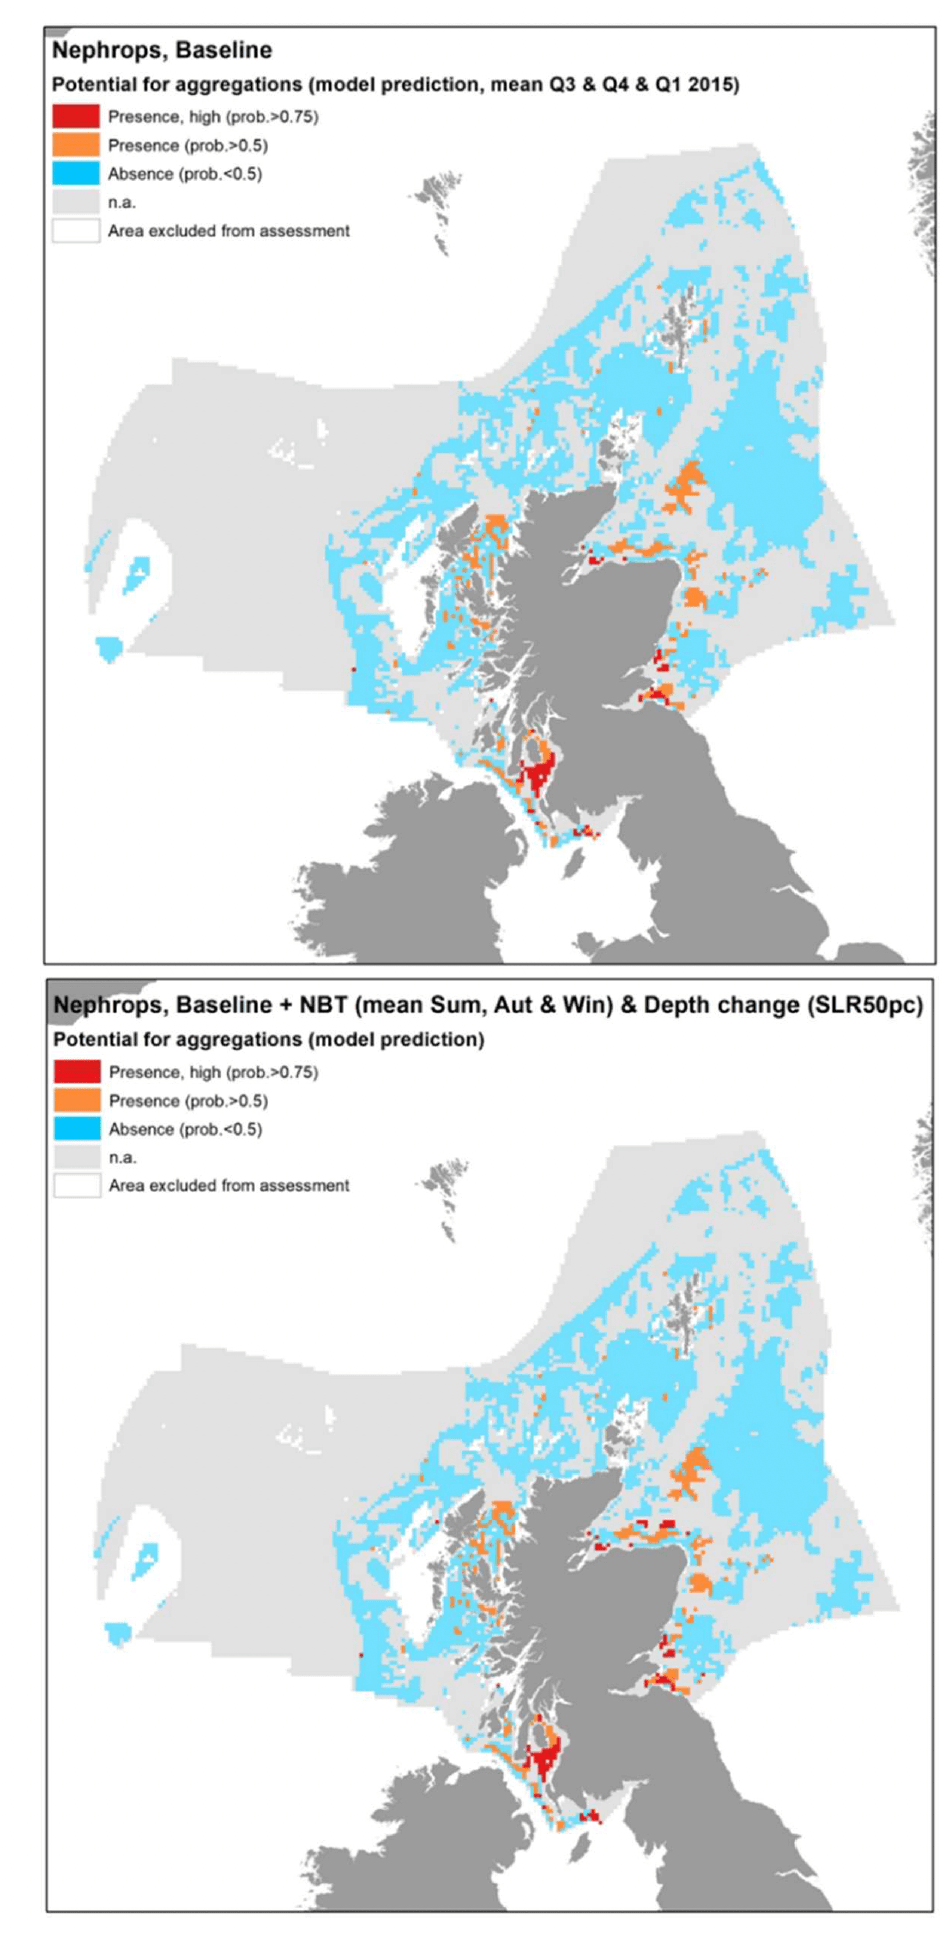
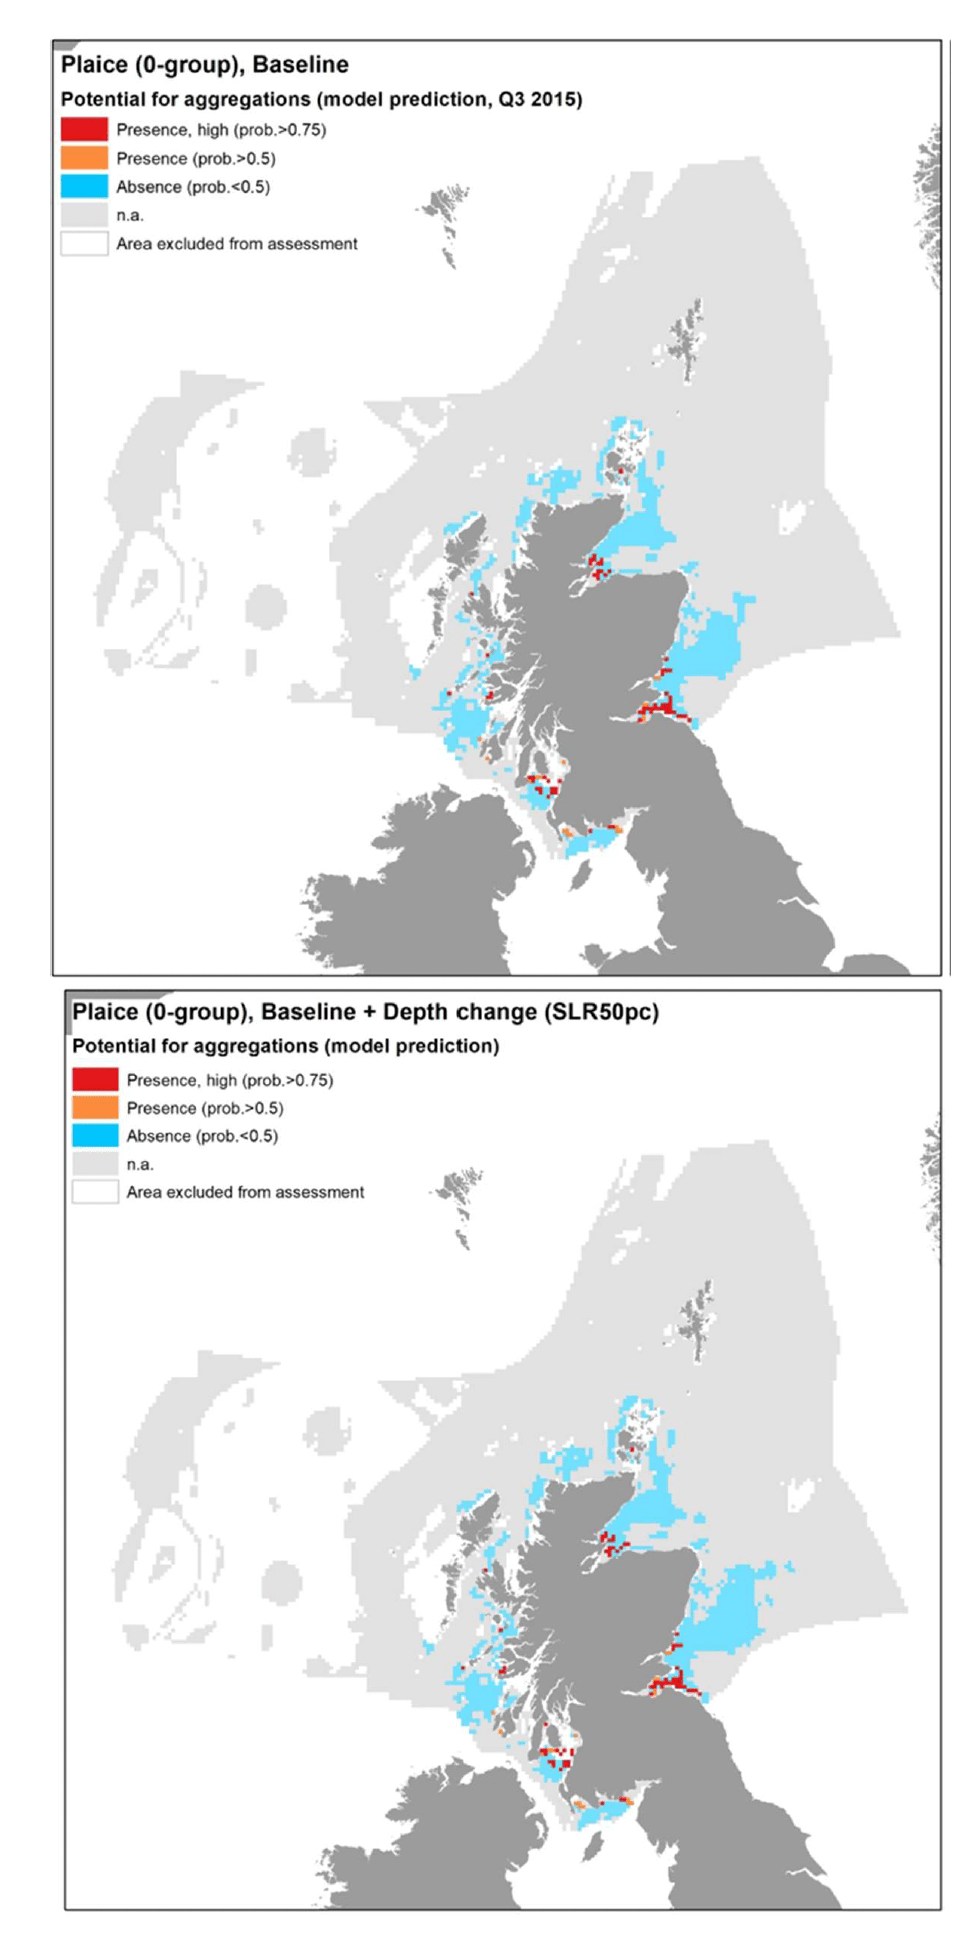
Contact
Email: ScotMER@gov.scot