Coronavirus (COVID-19): state of the epidemic - 4 February 2022
This report brings together the different sources of evidence and data about the Covid epidemic to summarise the current situation, why we are at that place, and what is likely to happen next.
Looking ahead
Scottish Contact Survey
Changes in patterns of mixing and adherence to restrictions will impact on future case numbers. The Scottish Contact Survey measures times and settings that people mix where they could potentially spread Covid-19. Average contacts from the most recent Panel B cohort of the Scottish Contact Survey (week ending 26 January) indicate an average of 4.7 contacts. This is an increase of 13% compared to two weeks prior.
Mean contacts have increased within the work and other setting (contacts outside home, school and work) by 45% and 13% respectively in the last two weeks. Contacts within the home have remained at a similar level over the same period.
All age groups with the exception of those in the 30-39 age group reported an increase in contacts in the last two weeks. Increases were largely driven by contacts within the work setting for those under 70. Individuals 70 and over reported a rise in contacts within the other setting.
Modelling the Epidemic
The latest Modelling the Epidemic report includes projections over the next few weeks for combined Delta and Omicron infections. These projections include the effect of the interventions announced on 14 and 21 December 2021; those announced as being lifted from 17, 24 and 31 January 2022; and booster take up. All projections also assume a lower vaccine effectiveness for Omicron than for Delta.
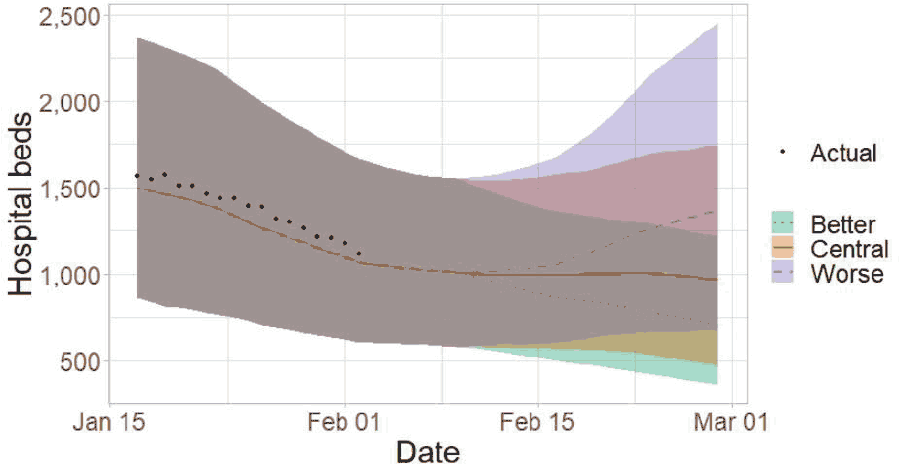
With this taken into account, it is estimated that daily infections may be between 5,000 and 50,000 at the start of March[68]. However, the future trajectory of infections is uncertain.
Figure 13 shows the impact of the daily infection projections on the number of people in hospital. The modelling includes all hospital stays, whereas the actuals only include stays up to 28 days’ duration that are linked to Covid-19. However, there continues to be uncertainty over hospital occupancy and intensive care in the next four weeks. In this figure, the ‘Central’ scenario assumes that infections broadly plateau at current levels. The ‘Worse’ scenario assumes a higher transmissibility for Covid-19, whereas the ‘Better’ scenario assumes a lower transmissibility. All projections also assume a lower vaccine effectiveness for Omicron than for Delta[69].
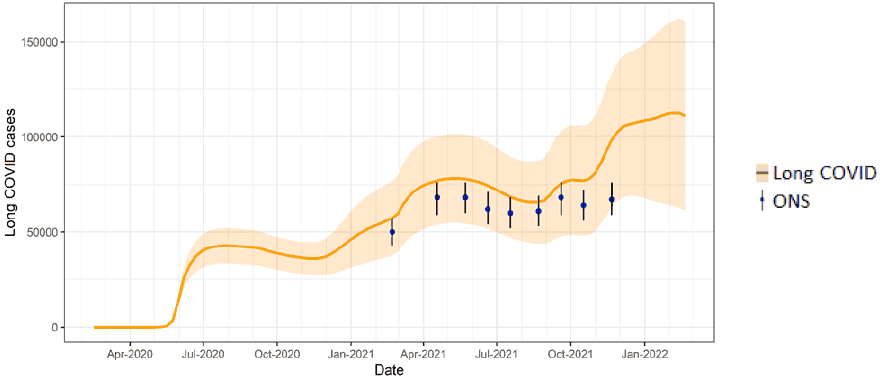
Long Covid
According to the Office for National Statistic (ONS), long Covid is defined as symptoms persisting more than four weeks after the first suspected coronavirus (Covid-19) episode that are not explained by something else.
The ONS Covid-19 Infection Survey estimated that 1,332,000 people (95% confidence interval: 1,290,000 to 1,373,000) in the private residential population in the UK (2.06% of the respective population; 95% CI: 2.00% to 2.12%) reported experiencing long Covid over the four-week period ending 2 January 2022. In Scotland, over the same period, an estimated 100,000 people (95% CI: 90,000 to 111,000) in the private residential population (1.91% of the respective population; 95% CI: 1.71% to 2.11%) reported experiencing long Covid of any duration. This compares to 2.10% in England (95% CI: 2.03% to 2.17%), 1.99% in Wales (95% CI: 1.74% to 2.24%) and 1.47% in Northern Ireland (95% CI: 1.19% to 1.74%)[72].
Scottish Government modelling of long Covid estimates that at 20 February 2022, between 61,000 (1.1% of the population) and 161,000 (2.9%) people are projected to self-classify with long Covid for 12 weeks or more after their first suspected Covid infection in Scotland (Figure 14)[73]. These are preliminary results, further data on rates of long Covid and associated syndromes as research emerges are required.