Coronavirus (COVID-19): state of the epidemic - 4 February 2022
This report brings together the different sources of evidence and data about the Covid epidemic to summarise the current situation, why we are at that place, and what is likely to happen next.
Severe Illness: Hospitalisation, ICU and Deaths
Hospital and ICU Occupancy and Admissions
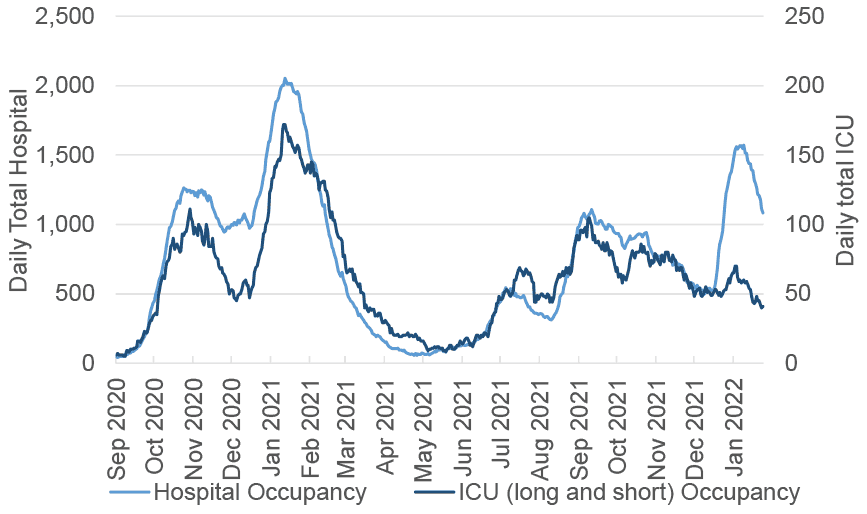
In the week to and including 2 February, Covid-19 hospital occupancy continued to decrease. NHS boards reported 1,116 patients in hospital on 2 February with recently confirmed Covid-19, compared to 1,389 on 26 January 2022. This is a decrease of 273 patients, or 20%, from the previous week and compares with 2,053 patients in hospital at the peak in January 2021 (Figure 9).
ICU occupancy (including short and long stay) has decreased to 40 patients on 2 February, a decrease of 4 patients or 9% since 26 January, and remains lower than the peak of 172 ICU patients recorded in January 2021. There was a decrease in ICU patients in short stay (28 days or less) ICU, while the number of long stay (more than 28 days) ICU patients plateaued in the week leading up to 2 February (Figure 9)[36].
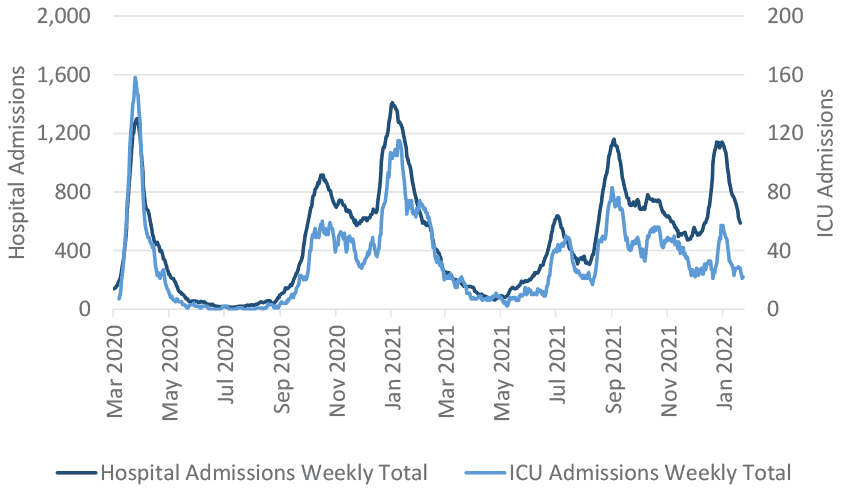
Admissions to hospital have decreased over the last week, with 589 admissions to hospital for people with confirmed Covid-19 in the week to 30 January compared to 761 in the week to 23 January (Figure 10)[38]. This is a 23% decrease.
The latest data from PHS shows 22 new Covid-19 patients admitted to ICU in the week to 2 February, compared to 28 in the week to 26 January (Figure 10)[39]. This is a 21% decrease. In the four weeks from 1 January to 28 January 2022, the rate of acute hospital admissions for individuals with a booster or third dose remains lower compared to unvaccinated people or those who have only received one or two doses of a Covid vaccine[40] [41].
Average hospital admissions (three-week rolling average) related to Covid-19 in children and young adults (aged under 22) have decreased all age groups, except for those aged between 2 and 11, in the three weeks leading up to 26 January compared to the previous three-week period leading up to 19 January. Among those aged 2 to 4 average hospital admissions increased by 6% compared to the previous three week period, while it increased by 23% in the age group 5 to 11. Overall hospital admissions related to Covid-19 in children and young adults remain high, but have decreased from the previous three-week period. The highest number (three-week rolling average) of hospital admissions in children and young adults was seen among those aged 0-1 in the three weeks leading up to 26 January[43]. These figures refer both to young patients in hospital because of Covid-19 and with Covid-19.
Not all people hospitalised with a recent COVID-19 diagnosis will be in the hospital setting because of this infection. It is important to be able to differentiate between patients in hospital who are admitted to hospital ‘because of’ their COVID-19 as opposed to patients who are admitted to hospital for other reasons with a Covid-19 diagnosis incidentally identified through testing.
Last week, Public Health Scotland published a final report of clinical audit data on people with a recent, community-acquired COVID-19 diagnosis admitted to hospital in selected NHS Boards (NHS Dumfries and Galloway, NHS Grampian, NHS Greater Glasgow and Clyde and NHS Tayside). Findings from this report concluded that 64% of patients were in hospital ‘because of’ COVID-19 during the period December 2021 to January 2022, as opposed to ‘with’ a Covid-19 diagnosis[44].
This week, Public Health Scotland published additional analysis based on the national SMR01 data base, looking at the proportion of people in hospital ‘because of’ Covid-19 by using the clinical diagnosis information recorded from the patient discharge summary. A hospital admission ‘because of’ COVID-19 is defined as an admission where COVID-19 is recorded as the main diagnosis on the patients discharge summary[45]. This data is received from NHS boards with a two-to-three- month lag. Based on data from six NHS boards, this analysis concludes that as at October 2021[46], an estimated 73% acute hospital admissions in Scotland ‘with’ Covid-19 had a primary diagnosis of Covid-19.
The analysis also concluded that the average length of time a patient is spending in hospital ‘because of’ COVID-19 has reduced from 8.1 days in May 2021 to 6.9 days in October 2021. This reduction is most likely linked to the roll out of the vaccination programme and the change in the age profile of patients being admitted[47].
While it may be helpful to compare hospital occupancy between the UK nations, any comparisons must be made with caution. Definitions are not consistent across the nations and data are not reported daily by each nation. Additionally, data from Scotland, Wales and Northern Ireland is updated retrospectively if errors come to light. Data from England is not revised retrospectively, but instead is corrected in the following day's data update. For more information see UK Government website.
The seven day average hospital occupancy in Scotland per 100,000 people in the week to 1 February was 23[48]. Seven day average hospital occupancy per 100,000 population in the same period for other UK nations were as follows:
- England: 24 per 100,000 population;
- Wales: 25 per 100,000 population;
- Northern Ireland: 21 per 100,000 population.
There were 2 hospital admissions (7 day average) in Scotland per 100,000 people in the week to 28 January[49]. Seven day average hospital admissions per 100,000 population in the same period for other UK nations were as follows:
- England: 3 per 100,000 population
- Wales: 1 per 100,000 population
- Northern Ireland: 1 per 100,000 population.
Deaths
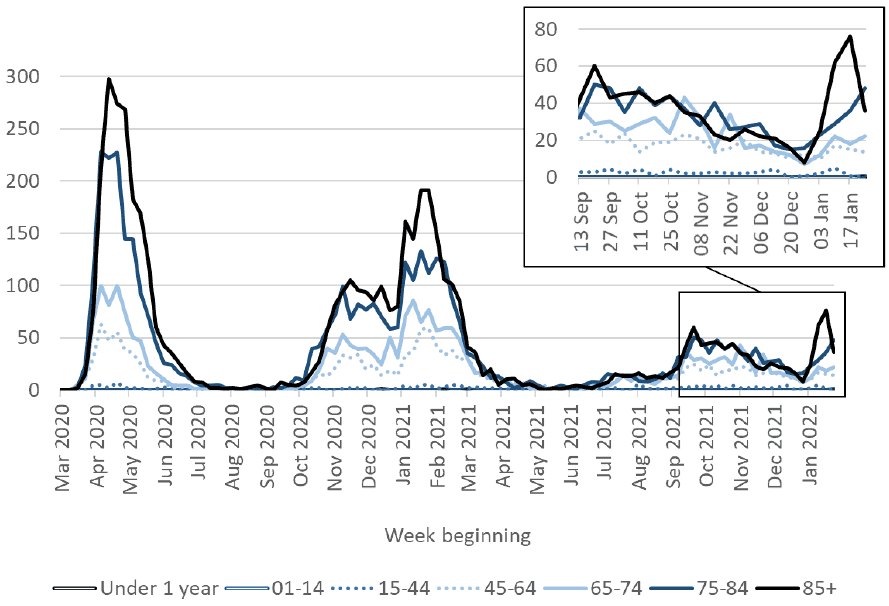
Covid-19 deaths most recently peaked in the week leading up to 26 September 2021, with 167 deaths registered in that week where Covid-19 was mentioned on the death certificate. After a period of decreasing numbers of Covid-19 deaths throughout the last quarter of 2021, the week to 23 January 2022 saw 146 Covid deaths. This came after three weeks of increasing numbers of deaths, largely consisting of fatalities among those aged 45 or above as Covid-19 deaths among younger age groups have remained at similar low levels throughout the pandemic.
While remaining high, the overall number of Covid-19 deaths have decreased by 17% to 121 deaths in the week leading up to 30 January compared to the week leading up to 23 January. This figure is 82% lower than the peak in April 2020 (663 deaths)[50]. However, there are different trends in different age groups. In the week leading up to 30 January, deaths decreased among those aged 85 or above, while continuing to increase among those aged 75 to 84. The age group 75 to 84 had the highest number of Covid-19 deaths, with 48 registered in the week to 30 January. Those aged 65-74 also saw an increase in the number of Covid-19 deaths in the week to 30 January (Figure 11). National Records of Scotland publish a weekly detailed analysis on deaths involving Covid-19 in Scotland in their weekly report[51].
Excess deaths are the total number of deaths registered in a week minus the average number of deaths registered in the same week over the previous five years (excluding 2020). Measuring excess deaths allows us to track seasonal influenza, pandemics and other public health threats. Excess deaths include deaths caused by COVID-19 and those resulting from other causes.
In the week leading up to 30 January 2022, all cause deaths were 8% below average levels for this time of year. This constitutes the fourth week in a row where deaths were below average[52].
Data from England, Northern Ireland, Scotland and Wales use different methodologies, so they cannot be directly compared. Additionally, deaths within 28 days of positive test will be updated on 1 February 2022 to include deaths following the most recent episode of infection, using the new episode-based case definition in England. For more information see UK Government website.
There were 3 average daily deaths in Scotland[53] per 1 million people in the week to 1 February. Average daily deaths per 1 million population in the same period for other UK nations were as follows:
- England: 4 per one million
- Northern Ireland: 3 per one million
- Wales: 2 per one million[54].