Coronavirus (COVID-19): state of the epidemic - 4 February 2022
This report brings together the different sources of evidence and data about the Covid epidemic to summarise the current situation, why we are at that place, and what is likely to happen next.
Estimated Infection Levels and Case Numbers
Estimated Infection Levels
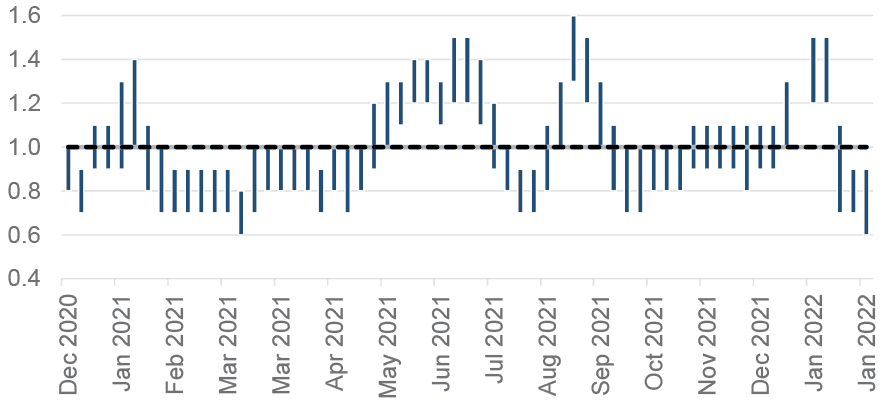
The reproduction number (R) is the average number of secondary infections produced by a single infected person. If R is greater than one the epidemic is growing, if R is less than one the epidemic is shrinking. The higher R is above one, the more people one infectious person might further infect other people and so the faster the epidemic grows. Please note that R is an indicator that lags by two or three weeks. For more information please visit the UK government website.
The UK Health Security Agency’s (UKHSA) consensus estimate for R in Scotland as at 18 January 2022 is between 0.6 and 0.9 (Figure 1)[2] [3]. The lower limit of the R value has decreased since the last published R value, while the upper limit has remained unchanged.
As at 18 January, the UKHSA’s consensus view was that the incidence of new daily infections in Scotland was between 146 and 270 per 100,000 people[5]. This equates to between 8,000 and 14,800 people becoming infected each day in Scotland[6].
The growth rate reflects how quickly the numbers of infections are changing day by day. It is an approximation of the percentage change in the number of new infections each day. More information can be found on the UK government website.
The latest growth rate for Scotland as at 18 January 2022 was between -8% and
-1%[7]. The upper limit has increased since the previous week, while the lower growth limit remains unchanged[8].
Covid Infection Survey
The Covid-19 Infection Survey is a UK wide study carried out by the Office for National Statistics (ONS) and the University of Oxford. The survey invites private residential households to test whether they have the infection, regardless of whether they have symptoms, using a PCR test. Participants are also asked to provide a blood sample to test for antibodies. This means the study is unaffected by testing policy changes mentioned at the start of this report.
In Scotland, the percentage of people testing positive for COVID-19 decreased in the two weeks up to 29 January, but the trend was (statistically) uncertain in the most recent week. The estimated percentage of people testing positive for Covid-19 in the private residential population is 3.52% (95% credible interval: 3.08% to 4.00%)[9], equating to around 1 in 30 people (95% credible interval: 1 in 30 to 1 in 25). This is higher than the latest peak of 2.29% recorded in the week to 11 September 2021, and higher than the previous peak of 1.24% recorded in the week to 17 July 2021.
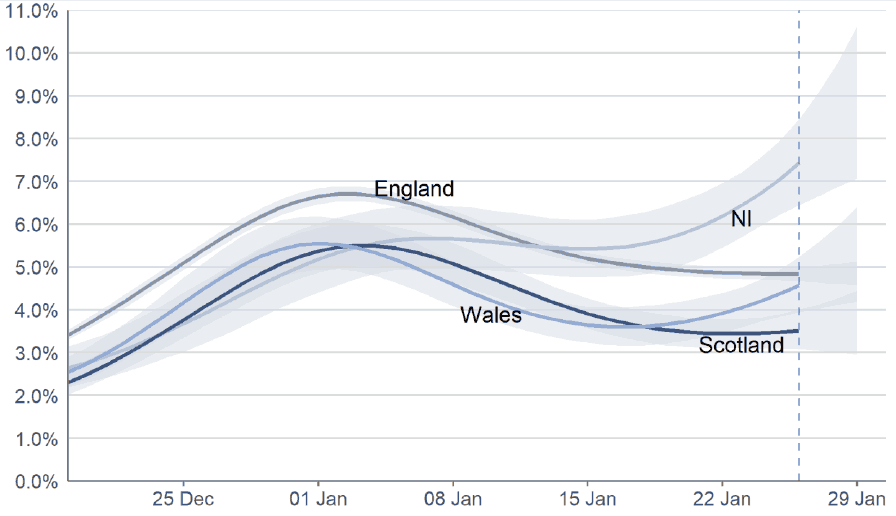
Figure 2 shows that the COVID-19 Infection Survey daily positivity estimates for Scotland may be starting to level off from mid to late January. This roughly aligns with the trends seen in PCR and LFD reported cases.
In the week 23 to 29 January 2022, estimates for the other nations of the UK are as follows and can be seen in Figure 2.
- In England, the percentage of people testing positive in private residential households remained high: 4.83% (95% credible interval: 4.67% to 5.00%), equating to around 1 in 20 people (95% credible interval: 1 in 20 to 1 in 20).
- In Wales, the percentage of people testing positive in private residential households increased: 4.57% (95% credible interval: 3.94% to 5.24%), equating to around 1 in 20 people (95% credible interval: 1 in 25 to 1 in 20).
- In Northern Ireland, the percentage of people testing positive in private residential households increased: 7.43% (95% credible interval: 6.44% to 8.46%), equating to around 1 in 15 people (95% credible interval: 1 in 15 to 1 in 10)[10].
In Scotland, estimates for the percentage of people testing positive for COVID-19 in private residential households increased for primary school aged children and decreased for young adults. The trends were uncertain for secondary school ages, as well as the older ages[11].
Wastewater Estimates
The Scottish Government has been working with the Scottish Environment Protection Agency (SEPA) to detect and analyse fragments of Covid-19 virus RNA in wastewater. The number of locations where the levels of SARS-CoV-2 in wastewater are monitored has increased to 141 sites around Scotland. In contrast to Covid-19 case records, virus shedding into wastewater is a biological process. This means that wastewater data is unaffected by factors that impact whether testing is done.
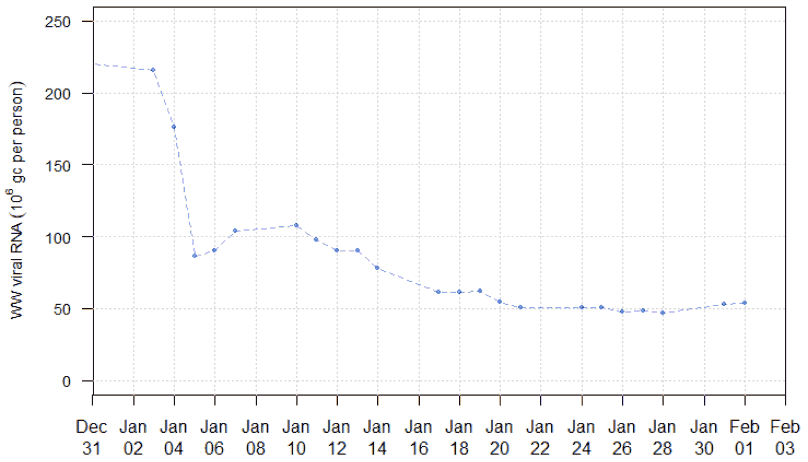
Nationwide, wastewater Covid-19 levels have stopped falling, with the week ending on 1 February recording levels of 56 million gene copies per person per day (Mgc/p/d), matching 57 Mgc/p/d the previous week (week ending 25 January). There may also be early indication of viral levels showing a slight increase in some areas of the country[12].
Compared to before December 2021, wastewater Covid-19 levels appear lower than anticipated given the known levels of Covid-19 activity. This effect may be due to the switchover from Delta variants to the new Omicron variant. Thus, Figure 3 shows only data from after the end of 2021, at which point the Omicron variant already represents almost all cases in Scotland. From this, we see a rapid decline from peak levels in early January with a continued albeit slower decline up to the start of February[13].
Covid-19 Cases
Please note that on 5 January 2022 people were advised that they no longer need to seek a confirmatory PCR test following a positive lateral flow test. This will impact the number of cases reported from 6 January 2022, and means that comparisons over time need to be made with caution. The Omicron variant represents the dominant variant in Scotland. For more information on the difference between reporting and specimen date, please see this earlier publication.
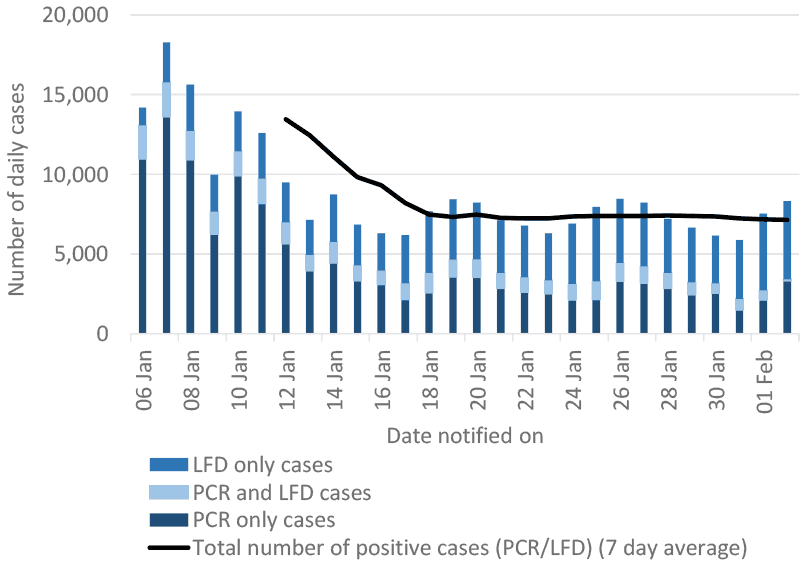
The seven-day average number of combined PCR or LFD daily reported cases has levelled off since 18 January. By reporting date[15], an average number of 7,144 cases confirmed by either a PCR or LFD test[16] were reported per day in the week leading up to 22 February. This is a slight decrease (3%) from the daily average of 7,394 cases reported in the week leading up to 26 January (Figure 4)[17].
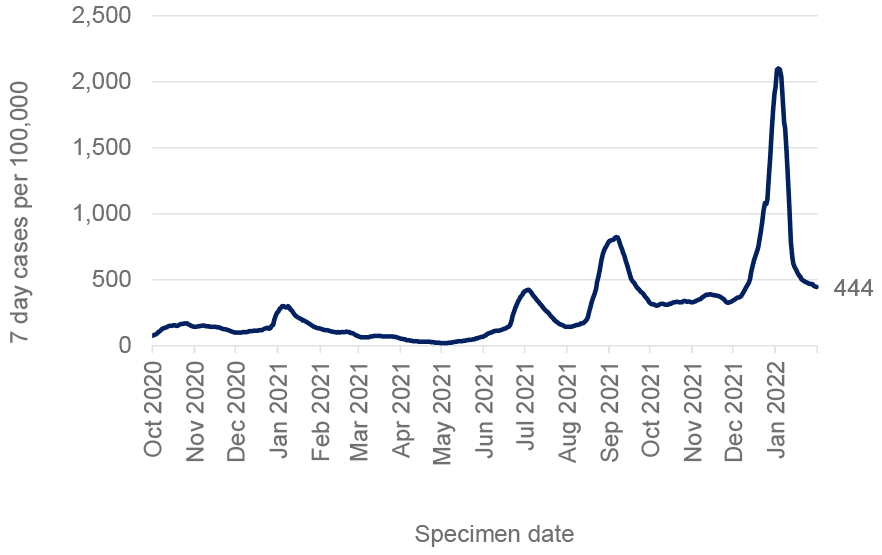
By specimen date[19], seven-day PCR case rates decreased in Scotland in the week leading up to 31 January. There were 444 weekly PCR cases per 100,000 population in the week to 31 January 2022, which is a 7% decrease from 476 weekly cases per 100,000 on 24 January (Figure 5)[20]. Covid-19 case data that combines PCR and LFD test results are not yet available by specimen date following the change in testing policy on 5 January, so the figures above and in Figure 5 only include PCR test results and caution must be exercised interpreting these figures.
A similar decreasing trend as seen in the PCR case rates per 100,000 by specimen date can be seen when looking at the seven-day average of PCR only daily cases by reporting date, which decreased by 6% in the week to 2 February compared to the previous week. However, this contrasts with the seven-day average of LFD only cases by reporting date, which increased by 7% in the same period. This is likely why the seven-day average of combined LFD and PCR daily reported cases has shown signs of levelling off since mid-January.
The following age breakdowns only include test results by reporting date.
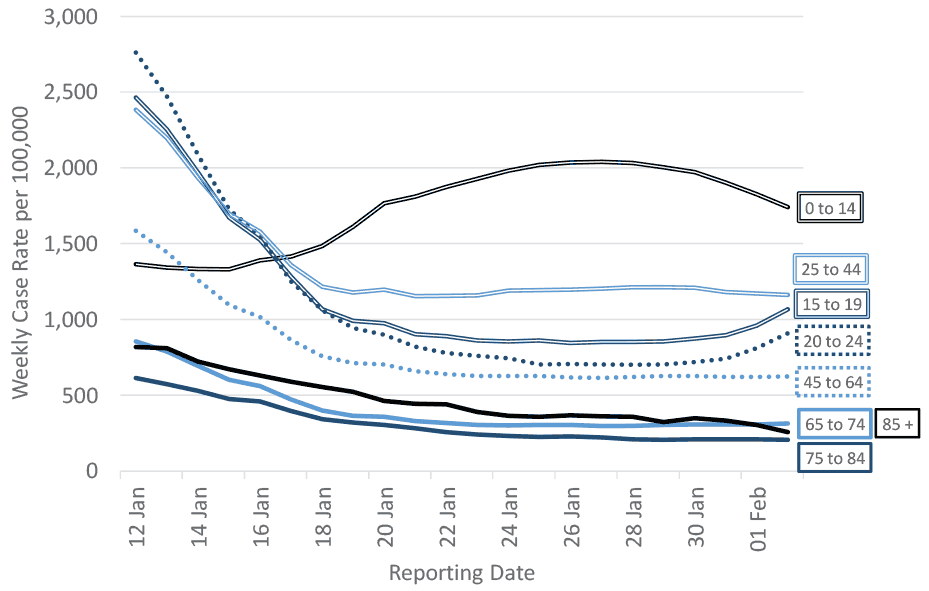
Combined PCR and LFD weekly cases by reporting date (as per data from the PHS Daily Dashboard) have decreased in all age groups apart from those aged 14 or below in the period from 12 January to 2 February. The weekly case rate for those aged 14 and below has started to decrease later, peaking on 27 January (Figure 6)[21]. As of 2 February, the highest combined PCR and LFD weekly case rates by reporting date per 100,000 were observed amongst those aged 0 to 14, followed by those aged 25 to 44, 15 to 19, 20 to 24, and 45 to 64. The lowest total weekly combined PCR and LFD case rates per 100,000 were in the age groups 65-74, aged 85 and above, and 75 to 84.
In the week leading up to 2 February, compared to the week leading up to 26 January, the total combined PCR and LFD weekly case rate for those aged 14 or younger decreased by 14%. Among those aged 20 to 24, the weekly case rate increased by 29% to 910 per 100,000 in the week leading up to 2 February. There was also a 26% increase in the weekly case rate for those aged 15 to 19 in this time period, increasing to 1,067 weekly cases per 100,000 population in the week leading up to 2 February[22].
The trend seen among those aged 14 and below from the PHS daily dashboard aligns with data published on the PHS Education dashboard, which provides a weekly combined PCR and LFD case rate by specimen date. The highest total combined PCR and LFD weekly case rates by specimen date among children and young people (aged under 22) in the week to 30 January 2022, were observed among those aged 5 to 11, 12 to 15, 2 to 4 and 18 to 19.
Total combined PCR and LFD weekly case rates per 100,000 among children and young adults in the week leading up to 30 January have decreased for ages under 16 compared to the previous week (ending 23 January). In the same time period, the weekly case rate has increased in age groups 16 to 17, 18 to 19 and 20 to 21, with the biggest increase seen among those aged 18 to 19, where the case rate increased by 35%, and among those aged 20 to 21, where it increased by 30%. All younger age groups (aged under 22) have a higher seven day combined PCR and LFD case rate than the Scotland level in this time period[24].
Due do different case definitions across the UK, comparisons between countries cannot be made at this time. Cases data from Scotland and Wales used below includes only PCR test results. Cases data from Northern Ireland includes both PCR and LFD results, and cases data from England includes PCR, LFD and LAMP (loop-mediated isothermal amplification) test results.
Additionally, from 31 January 2022, case reporting in England and Wales has changed to an episode-based definition which includes possible reinfections. Historical data on cases by specimen date from these two countries has been revised back to the beginning of the pandemic, but cases by reporting dates have not. This changing case definition has not yet been implemented for data from Scotland or Northern Ireland. Reported case numbers can be found on the UK Government Dashboard.
Due to the different case definitions outlined above, we have not included case comparisons across the four UK nations using data from the UK Government dashboard in this edition of the report. When these definitions are more aligned we will resume reporting on these comparisons. To compare estimated infection levels in private residential households across the UK, please see the previous section on the Covid-19 Infection Survey.
Testing Rates and Positivity
After a period of increase, the seven day total of conducted PCR tests per 1,000 populations peaked at 83 on 7 January 2022, and then decreased to 33 on 23 January. The seven day total of conducted PCR tests per 1,000 has since plateaued, showing 30 tests per 1,000 people in the week leading up to 2 February.
Showing a similar trend, the proportion of positive PCR tests in the last seven days (test positivity rate) reached 29.4% on 4 January and then sharply decreased to 17.9% on 18 January. The PCR test positivity rate has since plateaued with slight fluctuations throughout the two most recent weeks, with a 17.3% PCR positivity rate on 2 February[25]. Please note that caution must be exercised when interpreting these figures following changes to the testing policy on 5 January 2022.
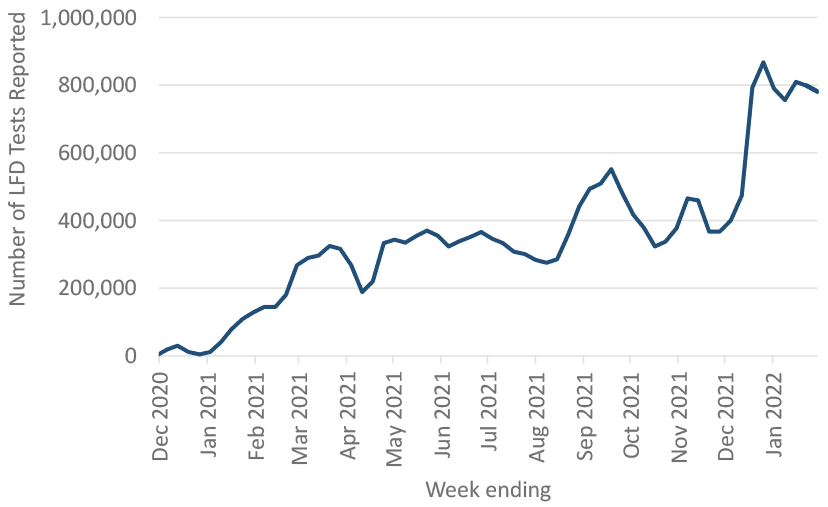
After a decrease in the number of LFD tests that were reported between 27 December 2021 and 9 January 2022, there was a 7% increase in the number reported in the week leading up to 16 January 2022, with 810,225 reported tests[26]. The weekly total of tests reported in the week to 30 January decreased by 2% from the previous week. This follows a sharp increase in LFD tests that were reported throughout December 2021 (Figure 7)[27].
YouGov survey results have shown that on 18-19 January, 58% of respondents had taken a LFD test and 10% a PCR test in the past week[28]. Of those who had taken a LFD test, 47% recorded the result of their last LFD test online and 48% did not record the results online[29].
Scottish Contact Survey asks whether people use Lateral Flow Device tests and if so how often. Approximately 78% of individuals had taken at least one lateral flow test within the last 7 days for the survey pertaining to the 20 to 26 January, decreasing from 84% two weeks prior. Of those individuals who had taken a lateral flow within the last 7 days, 27% did not report their results[30].
There are differences in the results from the YouGov and the Scottish Contact Survey (SCS) which may be likely to be due to differences in sampling and methodology. YouGov is an online survey based on an active sample which is representative of the Scottish population with around 1000 respondents[31]. The SCS[32] is based on a longitudinal survey with a larger sample of around 3000, with the responses being modelled to represent the Scottish population.
Covid-19 Reinfections
In Scotland, possible reinfections are defined as a positive test 90 days or more after a previous positive test. This amount of time is set in order to be able to distinguish between viral persistence of the primary Covid-19 episode and a true reinfection. The current Covid-19 Case definition only includes the first time a person is infected, but Public Health Scotland is currently reviewing its methodologies and infrastructure to incorporate reinfection reporting routinely in late February 2022, as well as provide revised historical data on hospitalisations and deaths. See more in the PHS Weekly Report.
As of 24 January 2022, 3.1% of all PCR confirmed cases in Scotland throughout the pandemic were determined to be reinfections, according to the 90-day threshold (34,774 out of 1,158,822). This is in line with what has been reported in England, where 4% of cases have been determined as reinfections as of 31 January 2022[33].
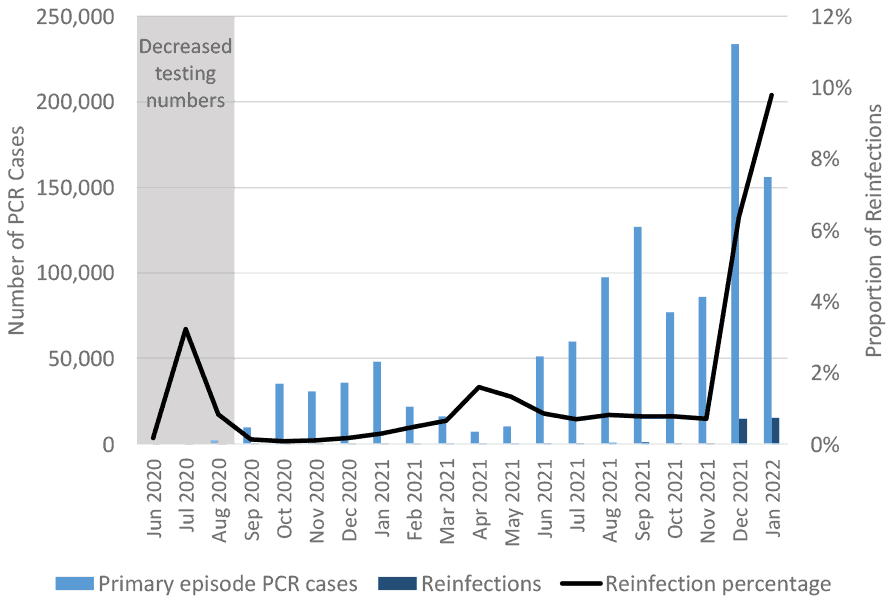
As can be seen in Figure 8, the proportion of reinfections has fluctuated over time. Between June 2020 and December 2021, the overall proportion of reinfections remained low, with two peaks of reinfections occurring in July 2020 and April 2021. The small number of cases between June and August 2020 will have contributed to the increased proportion of reinfections in this period.
The proportion of reinfections has seen an increase in December 2021 and January 2022, where the proportion of reinfections were at 6.4% and 9.8%, respectively, of all reported PCR cases. This coincides with the rapid increase of the Omicron variant in Scotland; which, evidence suggests, is associated with an increased risk of reinfection.
In Scotland, the Health boards with the highest rates of reinfection are NHS Greater Glasgow and Clyde, and NHS Lanarkshire, at 946 and 927 reinfections per 100,000. The highest number of reinfections have been reported among peope aged 20 to 24 and there have been a higher number of reported reinfections among females than among males. The difference between males and females is likely linked to higher rates of routine occupations screenings by women in healthcare roles[35].